Gap Inc. (GAP) Has Dropped in All 6 Midterm April Windows as the Next One Nears
Gap Inc. shares are up 12% for 2026 despite a post-earnings slide, but an April midterm-election seasonal window that has never favored the stock is coming into view.

Key takeaways
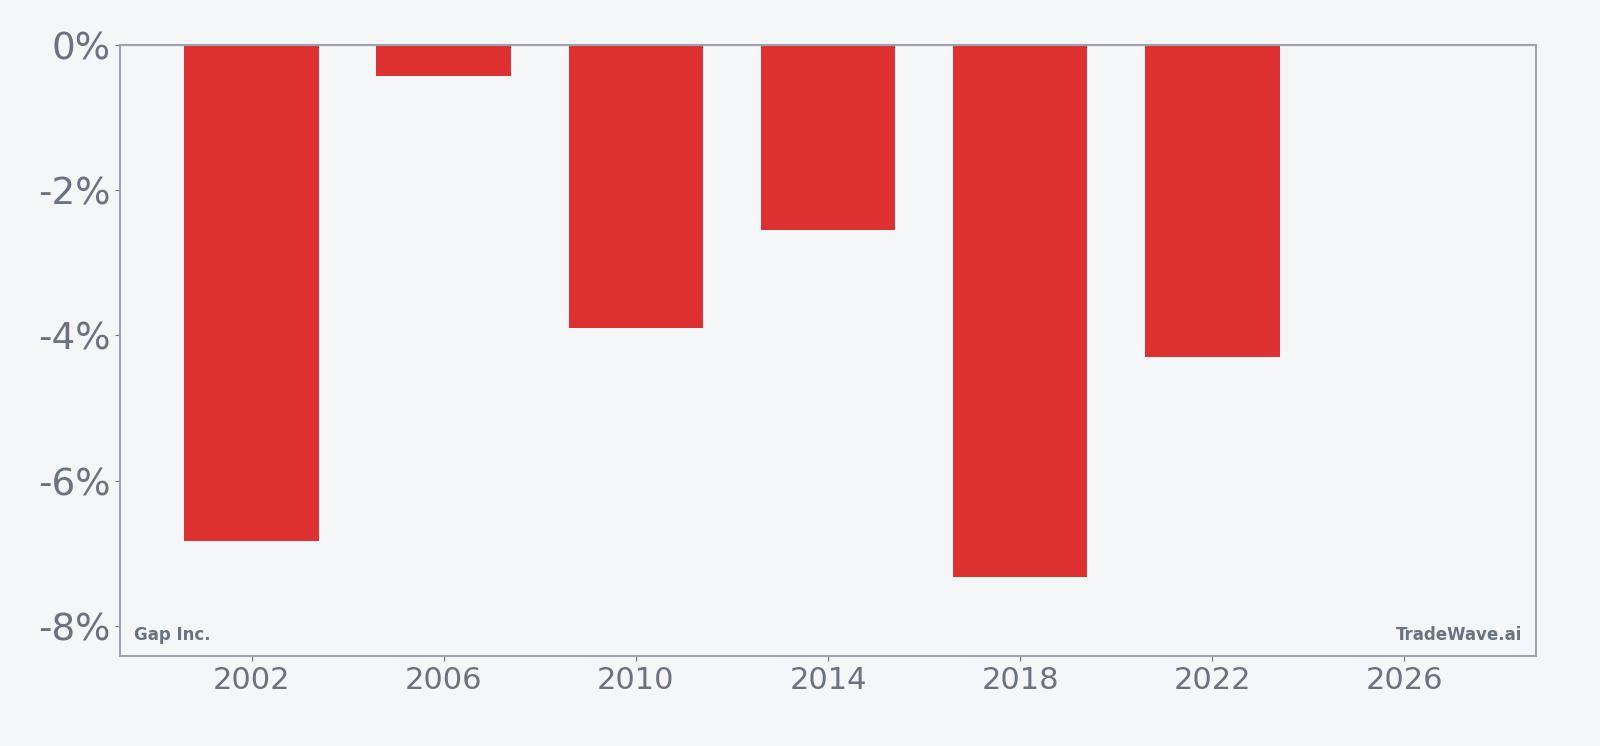
- Gap Inc. has posted declines in all six comparable midterm-election spring windows, with an average move of 4.22% in favor of a short setup.
- The upcoming 31-day window starting Apr 6, 2026, is grouped across the last six midterm election years, not consecutive calendar years.
- Percent Profitable is 100%, with 6 winners and 0 losers for the short direction across the historical sample.
- Average winner profit of 4.22% comes with a TradeWave Ratio of 2.52 and a Sharpe ratio of 1.5, pointing to consistent directional follow-through.
- Intraperiod swings have been sharp, with worst-case adverse moves reaching more than 16% in some years even when the short ultimately worked.
- Gap’s stock is up 12% year to date but fell more than 14% on Mar 6 after missing Q4 earnings estimates, setting a tense backdrop into this historically weak stretch.[1]
According to historical data from TradeWave.ai, this specific midterm-election spring period has behaved very differently from an average month on the calendar for Gap Inc., and the next iteration is only weeks away.
Seasonal window
Gap Inc. has moved in favor of a short position in all six midterm-election spring windows in this study, averaging 4.22% gains for the bearish side over 31 trading days. The next window begins on Apr 6, 2026, with the stock last trading at $23.28, up 12% year to date but well below its recent highs.[1]
Grouping by the presidential election cycle matters here because midterm years often bring a different policy and spending mix than election or pre-election years. Retail names like Gap can feel those shifts quickly as tariffs, wage rules and consumer confidence ebb and flow with Washington’s agenda, so a pattern that repeats only in midterm years is not just a calendar quirk.
This seasonal window begins on Apr 6 and spans 31 trading days. Historically, during this period across the last six midterm election years, Gap Inc. has shown a clear downside tendency that aligns with a short trade direction rather than a long one.
The trade direction for this pattern is short, and every year in the sample has been a winner for that stance. Percent Profitable sits at 100%, with 6 winners and 0 losers, meaning each midterm-year iteration saw the stock finish the window lower than where it started when viewed through a short lens.
Average profit across those winning short trades is 4.22%, which reflects the typical net move from entry to exit over the 31-day span. Because there are no losing years in this sample, the all-years average is the same as the average winner, and there is no separate drag from down years to factor in.
The Sharpe ratio for this pattern is 1.5, indicating that the risk-adjusted outcome of the end-of-window returns has been relatively strong for a short setup. The TradeWave Ratio of 2.52 measures how far price typically travels in the trade direction within the window, independent of the final close, and a value above 2 suggests that intraperiod moves have often extended well beyond the final net change.
Looking at individual years, 2002 and 2018 stand out as some of the strongest short-friendly windows, with net returns of about 6.83% and 7.32% in favor of the bears, respectively. In 2010 and 2022 the net moves were smaller, but the pattern still finished in the red for longs, keeping the 6-for-6 record intact.
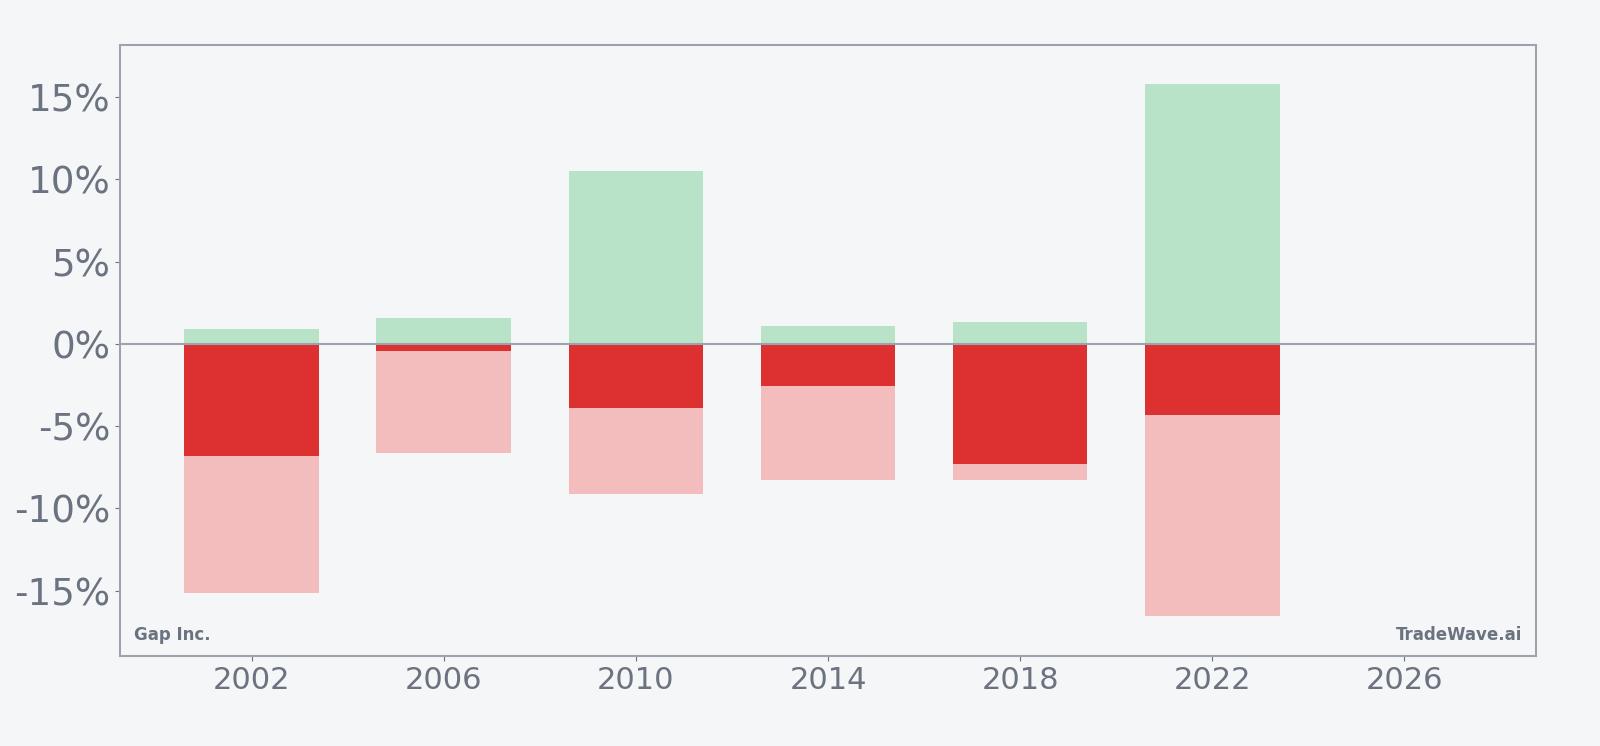
Intraperiod volatility has been meaningful. The best point-to-peak move in favor of the short, known as the maximum favorable excursion, reached 15.8% in 2022, while the worst drawdown from entry, or maximum adverse excursion, hit 16.52% that same year. In 2002 the short trade saw a worst-case adverse move of 15.12% even though it ultimately finished as a winner, underscoring how bumpy the ride can be.
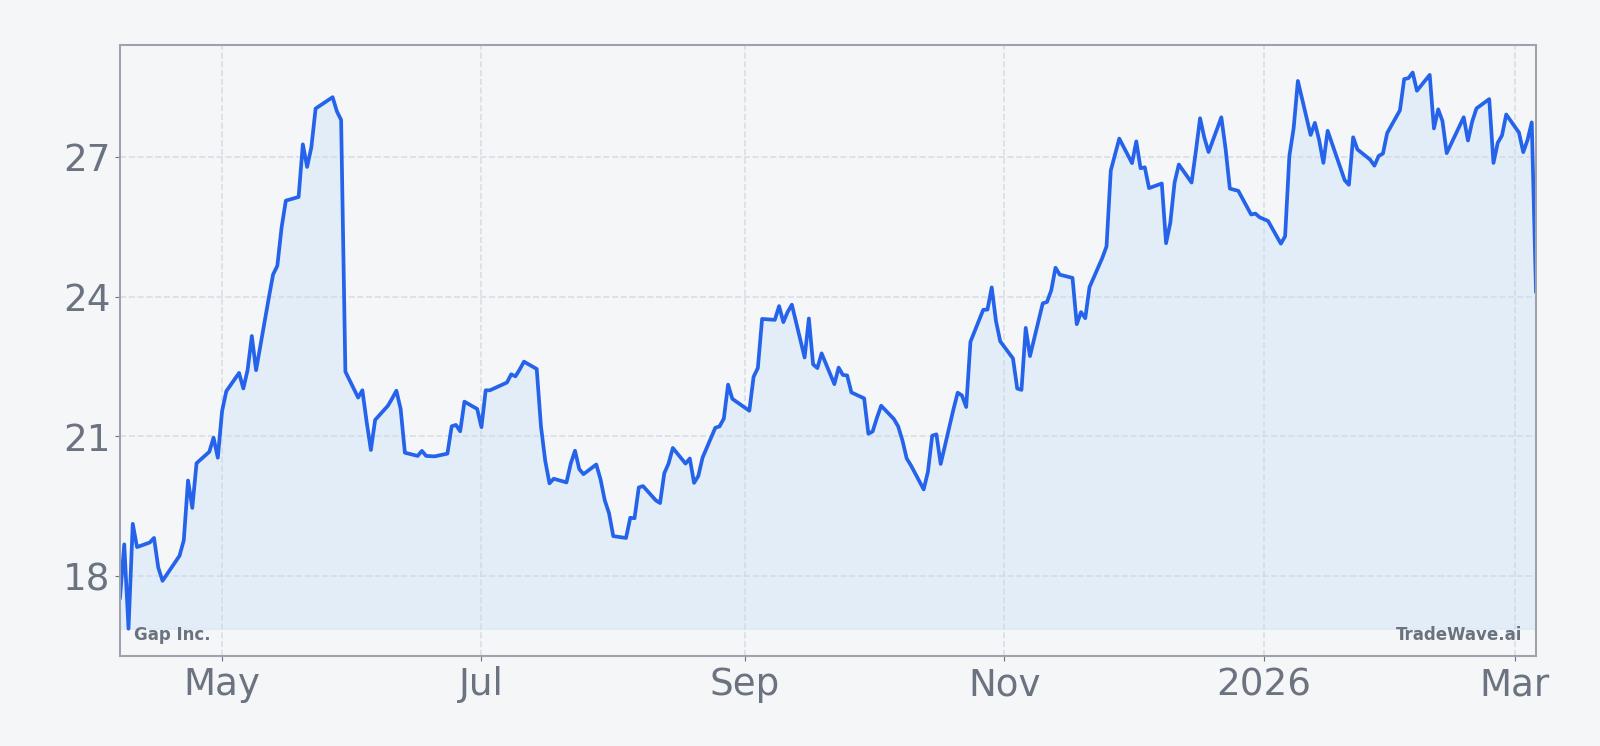
The historical seasonal trend chart for this window shows that weakness has tended to build gradually rather than in a single air pocket. Returns often drift lower through the middle of the window, with some years seeing a sharper acceleration toward the end as selling pressure compounds.
The cumulative return profile across all six midterm years adds up to a 27% gain for the short side over the full history of this pattern. That cumulative line slopes steadily in favor of bears, with no major reversals that would suggest the window has lost its character over time.
Year-by-year bars with both peak gains and worst drawdowns show how far the stock has tended to swing inside the window.
History does not guarantee future results; adverse excursions can be large even in winning windows, so traders using this pattern still face meaningful drawdown risk.
Price and near-term drivers
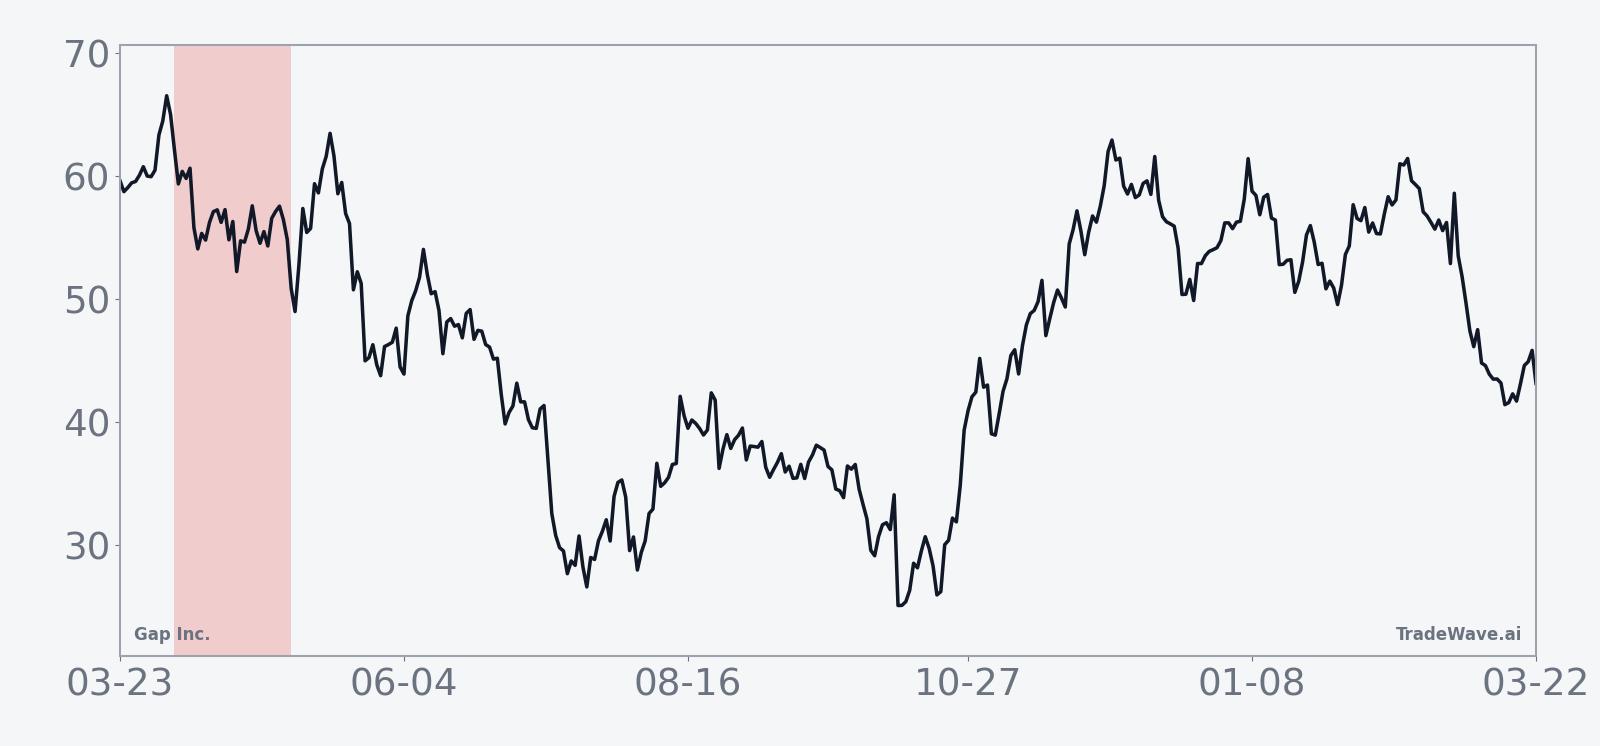
Gap Inc. closed at $23.28 after dropping 14.41% in the latest session, a sharp reversal that still leaves the stock up about 12% for 2026.[1] The move followed Q4 earnings on Mar 6, when the retailer reported earnings of 45 cents per share versus a 46-cent estimate and revenue of $4.24 billion that was roughly in line with expectations, triggering an 8% to 13% slide as investors focused on the slight profit miss.[1]
The stock’s pullback comes after a strong run that had been supported by better execution and brand work through 2025. In November 2025, Gap beat quarterly sales and profit estimates on the back of marketing-driven demand and 5% comparable sales growth, helping to rebuild confidence in the turnaround story even as the broader apparel space wrestled with soft demand.[3]
Analysts have leaned into that narrative. On Jan 8, 2026, UBS upgraded Gap to Buy with a $41 price target, arguing that improving Athleta sales and earnings growth could still deliver more than 50% upside from earlier price levels.[2] In late 2025, Barclays and Jefferies also moved to more positive stances, citing brand revitalization, tariff mitigation efforts and new category opportunities, though those calls came in a different price regime than today’s post-selloff levels.[10][14]
Macro and policy risks remain part of the story. In 2025, Gap warned that potential tariffs could add up to $300 million to annual costs and shave 100 to 110 basis points off operating margin guidance, a reminder that trade policy in a midterm election year can quickly hit apparel retailers’ P&Ls.[4][5][9] The company has flagged tariffs as a key swing factor for profitability, and any renewed escalation on that front in 2026 would intersect directly with the upcoming seasonal window.
Sector-wise, Gap still faces a mixed retail apparel backdrop, with soft demand in some categories and ongoing pressure at Athleta offset by marketing and brand initiatives that helped drive the late-2025 beat.[3] That leaves the stock straddling two narratives heading into April: a fundamental story that has improved enough to attract upgrades, and a price path that just reminded investors how quickly sentiment can flip after a single quarter.
The chart below situates the latest move in its recent multi-month context.
What to watch as the window opens
The next 31-day midterm-election spring window for Gap Inc. starts on Apr 6, giving traders a few weeks to see how the stock settles after its earnings shock. Historically, this period has leaned consistently in favor of shorts, with every prior midterm-year iteration finishing lower for longs and several years delivering sizable intraperiod swings.
Into that start date, the first watchpoint is whether the post-earnings slide stabilizes above key recent lows or continues to bleed. A firm base and quick recovery would contrast with the typical pattern of grinding weakness inside this window, while a failure to bounce would line up more closely with the historical script.
Second, the policy calendar matters. Any fresh headlines on tariffs, trade negotiations or consumer-focused fiscal measures in this midterm election year could reawaken the margin fears Gap flagged in 2025, especially if cost estimates creep back toward the $300 million range that previously rattled investors.[4][5][9] How the stock trades around those headlines during the April–May stretch will be a key tell on whether the midterm-year pattern is still in force.
Third, watch volume and positioning around any retests of the recent gap lower. Strong buying interest that absorbs supply near current levels would suggest investors are willing to lean against the seasonal tendency, while a lack of demand on rallies would leave the door open for the kind of steady downside drift seen in prior cycles.
Finally, the behavior of Gap’s peers in retail apparel will help frame whether this is a company-specific story or part of a broader midterm-year consumer pattern. If sector sentiment weakens alongside Gap during the window, it would echo the macro-sensitive nature of past midterm springs; if the group holds up while Gap lags, traders may focus more on execution and brand-specific issues than on the calendar.
Add it up: a stock that just reminded investors how volatile it can be, a midterm election year with live policy risk, and a 6-for-6 bearish seasonal window starting in early April. The next month will show whether Gap can finally break that streak or whether the midterm pattern still has one more act.
Sources
- [1] CNBC, "Stocks making the biggest moves premarket: Oil stocks, Gap, Marvell Technology, Samsara and more" (Mar 6, 2026)
- [2] CNBC, "Gap shares can rally more than 50% as Athleta sales improve, says UBS" (Jan 8, 2026)
- [3] Reuters, "Gap beats quarterly sales, profit estimates on marketing-driven demand" (Nov 20, 2025)
- [4] Reuters, "Gap misses quarterly sales estimates on soft apparel demand, warns of tariff hit" (Aug 28, 2025)
- [5] Reuters, "Gap forecasts weaker annual margin growth amid tariff concerns, shares fall" (Aug 28, 2025)
- [9] Fortune, "Gap says Trump’s tariffs could cost the company a whopping $300 million, sending shares into a tailspin" (May 30, 2025)
- [10] Reuters, "Barclays upgrades Gap to Overweight on brand revitalization and tariff offsets" (Nov 17, 2025)
- [14] Reuters, "Jefferies upgrades Gap to Buy, citing beauty opportunity and brand momentum" (Nov 14, 2025)