Bath & Body Works, Inc. (BBWI) Has Rallied in 8 of 9 Early-April Midterm Windows
Bath & Body Works, Inc. is approaching an early-April seasonal window that has usually favored the bulls, even as the stock trades deeply negative for 2026 amid softer sales guidance and pressure on discretionary spending.

Key takeaways
- Bath & Body Works, Inc. enters an 8-day window starting Apr 1 that has produced gains in 8 of the last 9 midterm election years.
- The pattern is long-biased, with 89% profitable years, 8 winners and 1 loser, and an average winner gain of 3.94% versus a 3% average across all years.
- Historical returns cluster in a relatively tight band, but adverse moves inside the window have reached as much as about 6.9% in the weakest year.
- Shares last traded at 22.29, down about 33% year-to-date and well below the 52-week high, as management guides to a 2.5% to 4.5% annual sales decline amid cautious consumers.[4]
- The early-April window sits in the midterm election year phase, where policy uncertainty and consumer-spending jitters have often amplified short, sharp moves in retail names.
- History points to a bullish seasonal skew, but the combination of soft guidance and elevated intraperiod drawdowns means traders still need to respect downside risk.
According to historical data from TradeWave.ai, this short early-April stretch has behaved very differently from an average month on the calendar for Bath & Body Works, Inc., and the next iteration is only weeks away.
Seasonal window
Bath & Body Works, Inc. has risen in 8 of the last 9 midterm election years during this early-April window, with winning years averaging 3.94% gains over just eight trading days. The upcoming 2026 window begins on Apr 1 and runs through Apr 9, with the stock currently at 22.29 and down about 33% year-to-date, leaving it well below its 52-week high of roughly 33.35.[4] That mix of a historically bullish sliver of the calendar and a beaten-up share price gives this year’s setup an unusually asymmetric feel for a short-term pattern.
The pattern groups only midterm election years, a phase that often brings policy uncertainty, shifting expectations for consumer spending and tighter financial conditions. For a discretionary retailer like Bath & Body Works, Inc., that backdrop has historically mattered: the stock has tended to respond quickly to any hint that shoppers are either pulling back or rediscovering appetite for small-ticket indulgences.
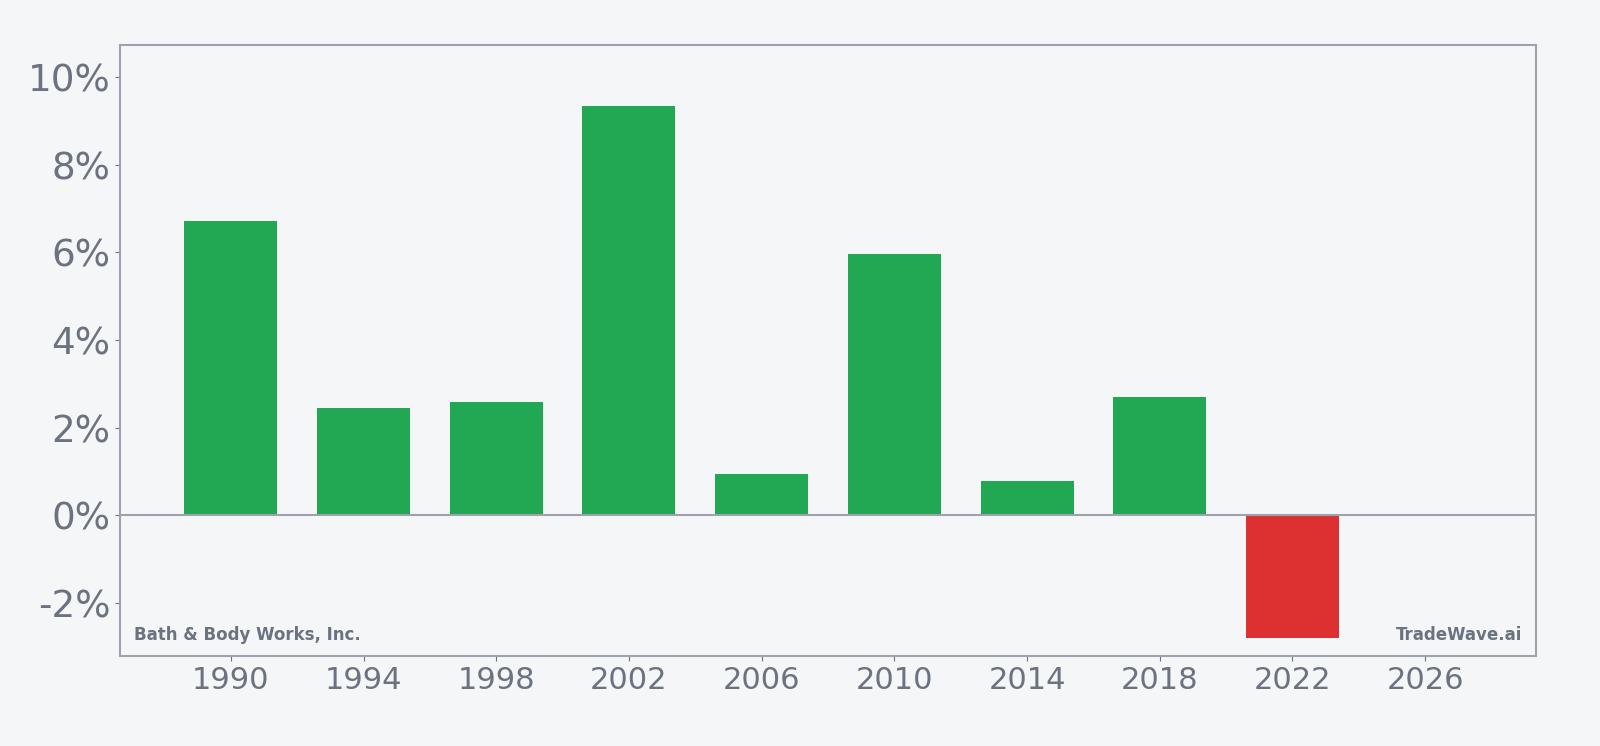
Across the last nine midterm election years, the long-biased setup has produced a 31% cumulative gain, with an annualized return of 3.13% for this specific 8-day slice. The 3% average profit across all years, including the lone loser, shows that the one down year did not fully erase the gains from the stronger cycles. Median profit of 2.58% underscores how often returns have landed in a modest but positive range rather than relying on a single outlier.
Two years illustrate the spread. In 2002, the stock gained 9.34% during the window, with the best intraperiod move matching that 9.34% run-up and a worst drawdown of about 5.73% from entry. In 2022, by contrast, the window finished down 2.8%, with a maximum favorable move of 2.44% that faded and a maximum adverse move of roughly 6.93%, showing how quickly a midterm-year shock can flip the script.
The historical seasonal trend chart shows a pattern that usually grinds higher rather than spiking in a single session. Gains tend to build over the middle of the window, with some years front-loading strength and others finishing with a late push, but the average path slopes upward more often than not.
A closer look at yearly net returns and intraperiod swings shows how upside and downside have coexisted inside this short window.
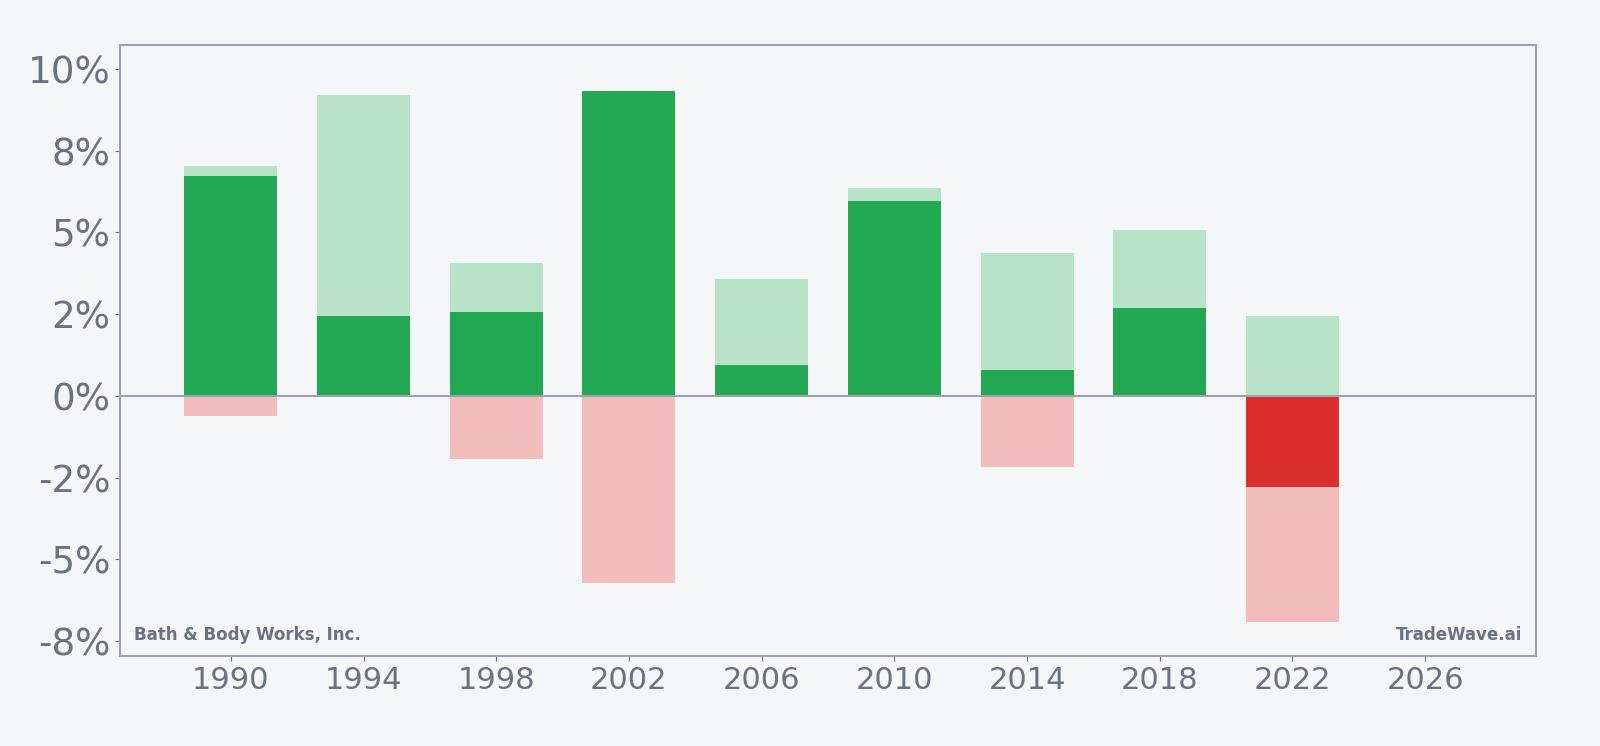
The stacked net, MFE and MAE bars show that even in winning years, the stock has often dipped meaningfully before finishing higher. Several cycles saw favorable intraperiod moves that were larger than the final net gain, while MAE readings in the weakest years approached 7%, underscoring that short windows can still deliver sharp drawdowns.
History does not guarantee future results; adverse excursions can be large even in winning windows, and traders should treat this pattern as context rather than a forecast.
Price and near-term drivers
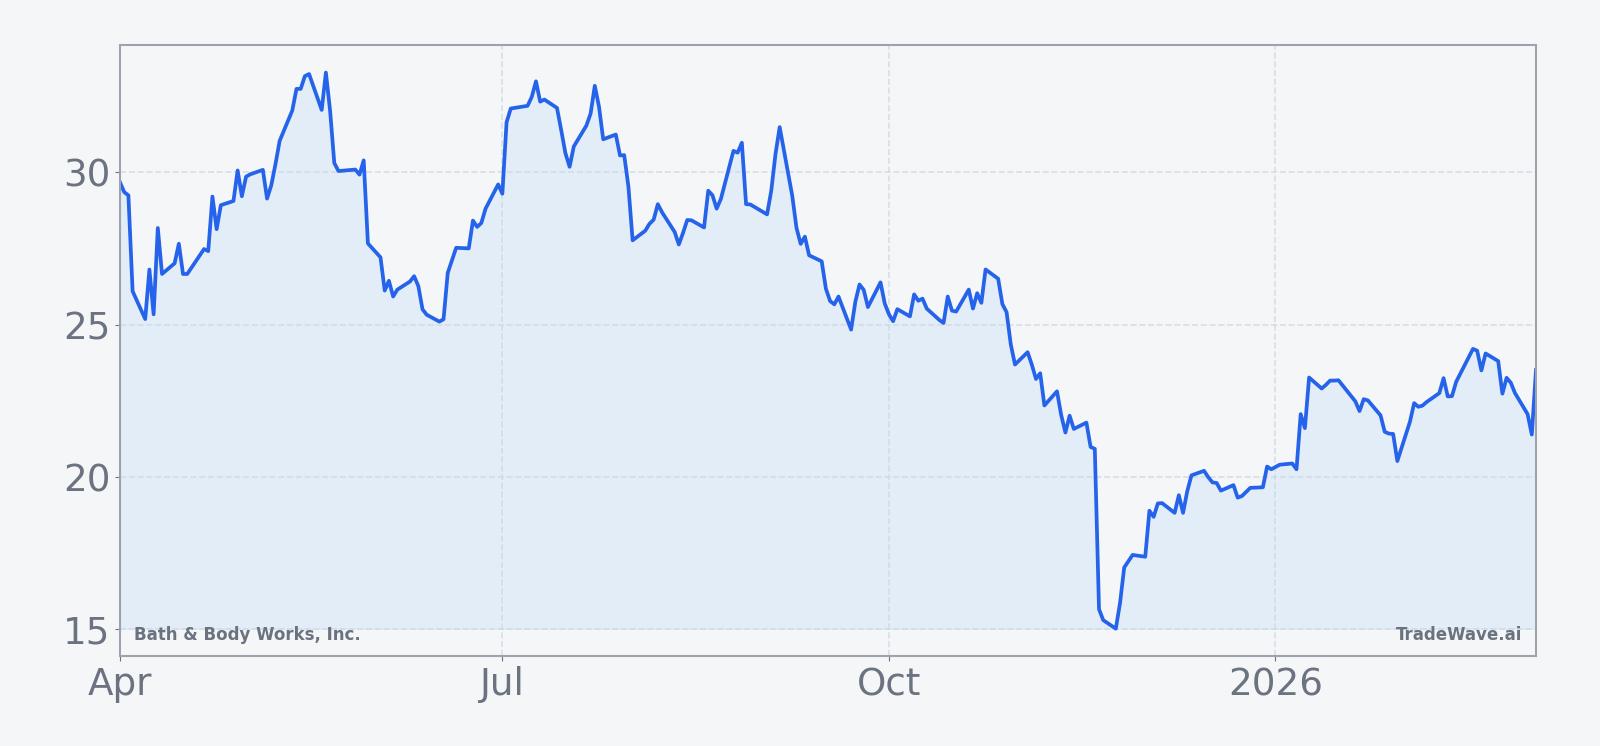
Bath & Body Works, Inc. closed at 22.29 on Mar 6, down 3.1% on the day and roughly 33% lower year-to-date, leaving the stock about 33.2% below its 52-week high near 33.35 and still well above its 52-week low of 14.28.[4] The shares have been under pressure since late 2025, when disappointing third-quarter results and a weaker holiday outlook triggered a sharp reset in expectations.[1]
On Nov 20, 2025, the company reported third-quarter revenue of 1.59 billion dollars, down 1% year-over-year and below estimates of 1.63 billion dollars, with adjusted earnings per share of 35 cents missing the 39-cent consensus.[3] Management cut full-year 2025 EPS guidance to at least 2.83 dollars and projected a low single-digit decline in net sales, citing softer demand for candles and fragrances as budget-conscious shoppers pulled back on non-essentials.[3] The stock fell 24.8% on that report, a reminder of how quickly sentiment can swing when a retailer disappoints during the holiday run-up.[3]
The pressure has not eased in early 2026. On Mar 4, Bath & Body Works forecast that full-year net sales would decline 2.5% to 4.5%, again pointing to muted spending on discretionary self-care products as consumers juggle higher costs and a softer labor backdrop.[4] That guidance reinforced a broader theme across the sector: shoppers are trading down, stretching purchases and prioritizing essentials, which leaves specialty retailers more exposed when the macro picture wobbles.[3]
Legal overhang has added another layer of uncertainty. In January 2026, law firms including Faruqi & Faruqi and the Schall Law Firm announced investigations and potential securities-fraud class actions tied to the stock’s late-2025 plunge and prior disclosures.[1][5] Those cases focus on whether investors were adequately warned about the risk of a sales slowdown and margin pressure, and while they do not change the company’s fundamentals, they can weigh on sentiment and headline risk.
Macro conditions have not been kind to the story either. Consumer-spending data show cash-strapped shoppers cutting back on non-essentials, a trend that hits categories like scented candles and home fragrances directly.[3] Analysts have also flagged that in downturns or inflation shocks, such as the 2022 episode, Bath & Body Works has historically suffered disproportionate share-price losses compared with some more defensive peers.[2]
Within the retail and consumer-defensive space, the company is wrestling with stagnant revenue and margin pressure tied to heavy promotions and reduced investment in core categories.[1] Weak holiday demand and budget-conscious behavior have forced management to lean on discounts to move inventory, which can support traffic in the short term but erodes pricing power over time.[3] That backdrop helps explain why the stock is trading below its 50-day moving average of about 22.13 dollars despite a modest 4.16% gain over the past month.[4]
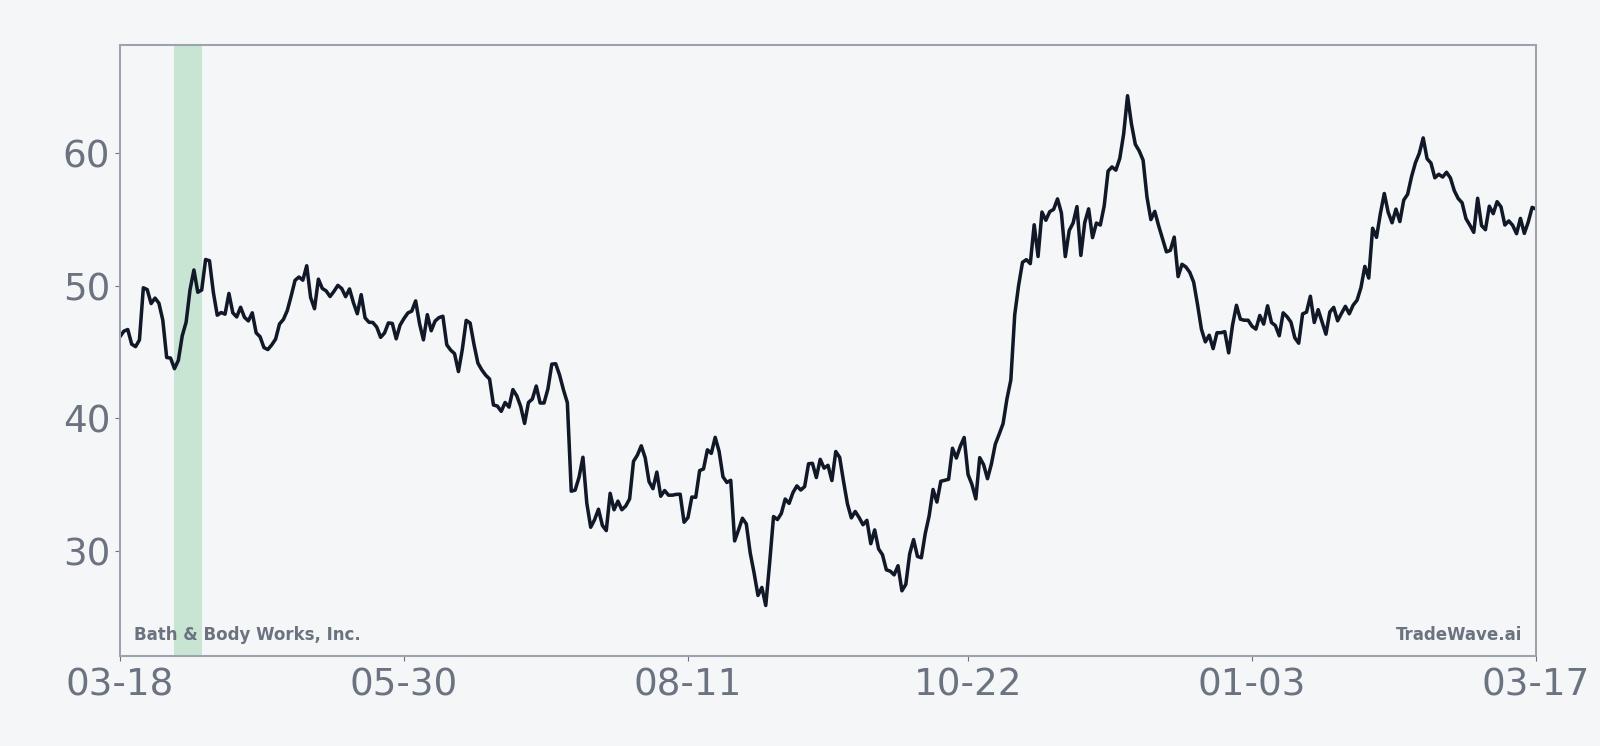
The chart below situates the latest move in its recent multi-month context.
What to watch as the window opens
The early-April window arrives as the United States moves deeper into the midterm election year, a phase that often brings shifting expectations for fiscal policy, regulation and consumer confidence. For Bath & Body Works, Inc., the key question is whether a historically favorable eight-day stretch can coexist with a tougher macro tape and cautious guidance.
Traders watching this pattern will likely focus on three things. First, how the stock behaves around the 22 dollar area and the recent lows on the daily chart; a firm bid into the window would be more consistent with prior midterm-year rallies, while fresh breakdowns would mark a clear departure from the historical script. Second, any updates on consumer-spending trends in upcoming retail sales data or peer earnings, which could either validate management’s cautious tone or hint at stabilization in discretionary categories.[3][4]
Third, legal and headline risk around the ongoing shareholder lawsuits bears monitoring, since new filings or settlements could inject volatility into an already jumpy tape.[1][5] If the stock can absorb that noise and still show buying interest during the Apr 1 to Apr 9 window, it would echo the pattern of prior midterm years where short bursts of strength appeared even against a choppy macro backdrop. If instead the window opens with heavy selling and deeper intraperiod drawdowns, it would signal that this cycle is breaking from the usual playbook and that macro and company-specific pressures are overwhelming the seasonal tailwind.
Sources
- [1] Morningstar: Faruqi & Faruqi investigates claims on behalf of Bath & Body Works investors (Jan 17, 2026)
- [2] Forbes: “Bath & Body Works Stock To $10?” (Oct 16, 2025)
- [3] Reuters: Bath & Body Works forecasts sales dip as holiday demand wanes; shares plunge (Nov 20, 2025)
- [4] Reuters: Bath & Body Works forecasts steeper decline in annual sales (Mar 4, 2026)
- [5] Morningstar: Schall Law Firm seeks lead plaintiffs in Bath & Body Works securities lawsuit (Jan 15, 2026)