Oil Prices Fall but ConocoPhillips (COP) Lifts 2025 Production Outlook
ConocoPhillips shares are hovering near $110 as the stock moves through a midterm-election-year seasonal stretch that has historically skewed positive, adding another layer to the story around oil prices and its Marathon Oil deal.

Key takeaways
- ConocoPhillips is in a 70-day seasonal window that begins Feb 9 and has historically been a strong period for the stock in midterm election years.
- The pattern is long-directed and has been profitable in 100% of the last 9 midterm election-year instances, with 9 winners and 0 losers.
- Average profit across those years is 13.25%, with a median gain of 14.06%, pointing to a consistently positive skew.
- Historical best-case intraperiod rallies have been sizable, while the worst drawdowns within the window have varied from shallow to double-digit pullbacks in some years.
- Today’s price near $110 comes against a backdrop of solid Q3 2025 execution and a raised production outlook, even as Brent crude has been weaker year-on-year.[5]
- Investors are entering the early part of the midterm election year, a phase where policy and regulatory signals can interact with this historically constructive seasonal backdrop for energy producers.
According to historical data from TradeWave.ai, this part of the calendar has shown a distinct pattern for ConocoPhillips in past midterm election years. The following section looks at how that seasonal tendency lines up with today’s fundamentals and policy backdrop.
Seasonal window
The current seasonal window is tied to the presidential election cycle, focusing on the last 9 midterm election years, which matters because energy policy, regulation and fiscal choices often shift meaningfully at this stage of the political calendar. This seasonal window is currently underway, spanning 70 days, and has historically been a strong stretch for ConocoPhillips. With the stock last changing hands at $110.01, up about 1.1% on the day, investors are watching how this pattern interacts with a market that lacks clear 52-week reference points in the latest data.[2] Historically, during this period the trade direction has been long, meaning the pattern is defined around years when the stock tended to rise rather than fall.
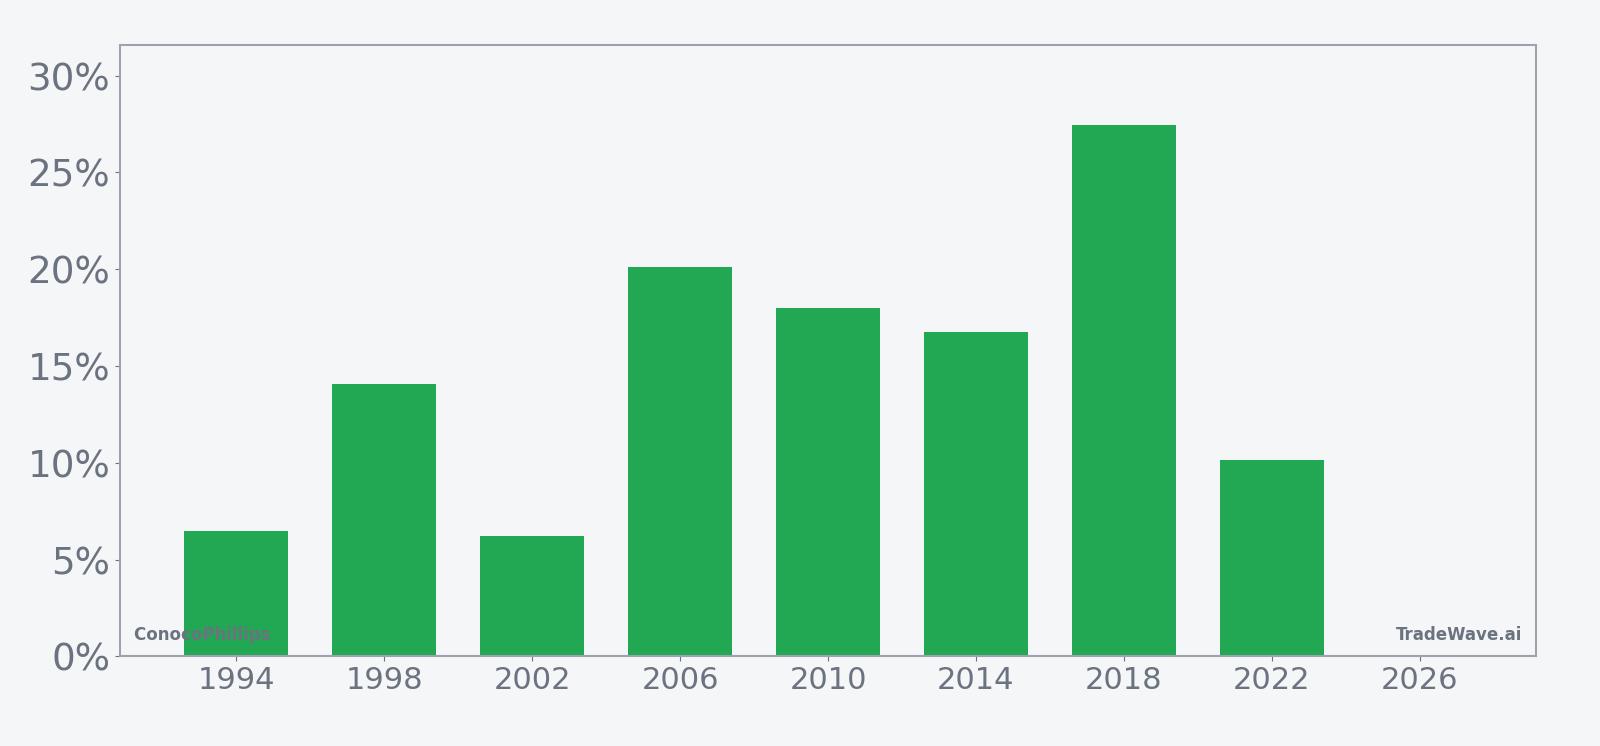
Across the last 9 midterm election years, this 70-day window has been profitable in every instance, with 9 winners and 0 losers and an average gain of 13.25%. The median profit of 14.06% underscores that the positive outcomes have not been driven by a single outlier year but by a cluster of solid advances. For a long-directed pattern, that consistency stands out, particularly in a sector that is often dominated by swings in crude benchmarks and policy headlines.
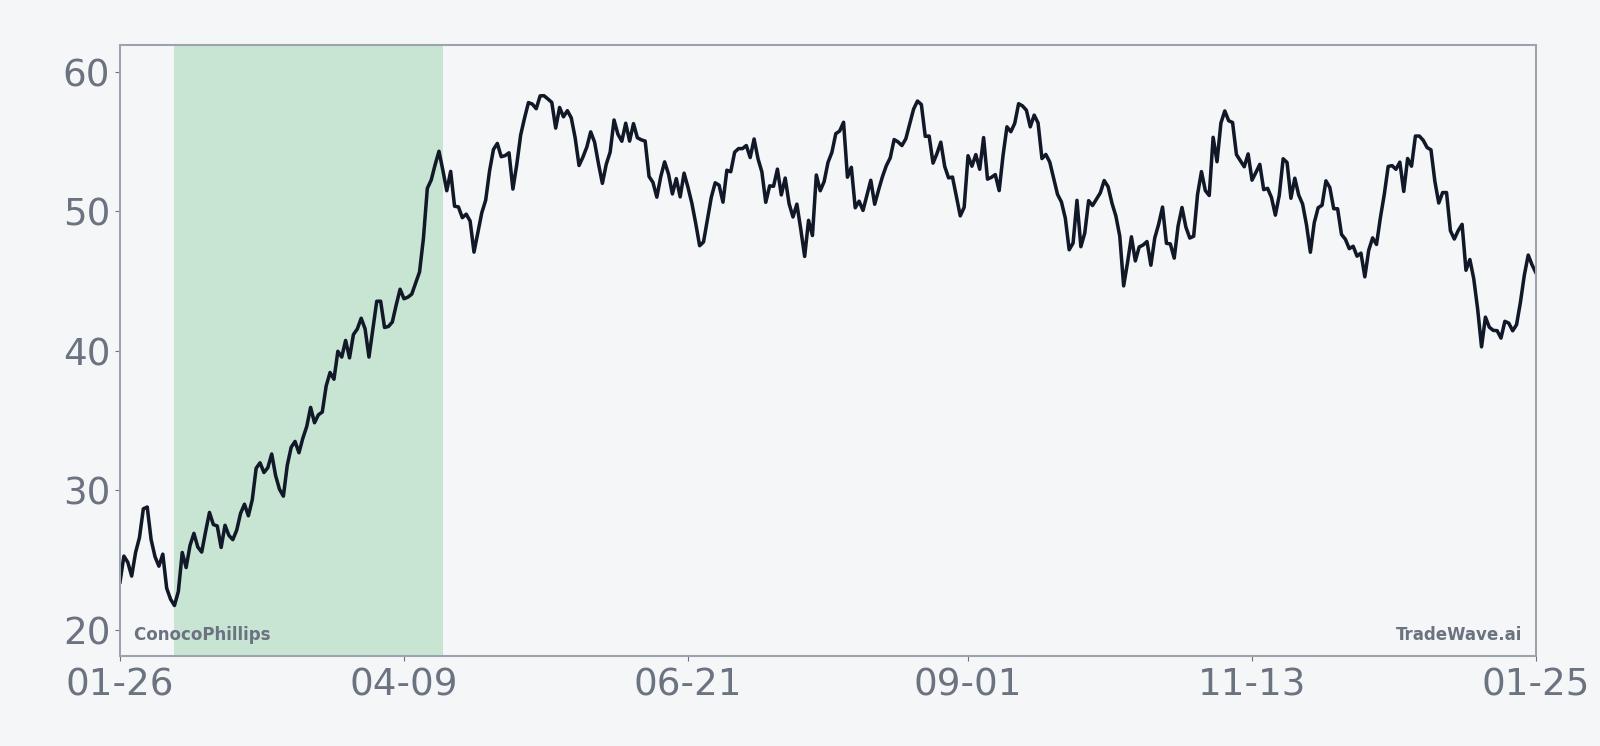
The historical seasonal trend chart suggests that gains in this window tend to build relatively steadily rather than in a single burst, with the average path grinding higher over the 70 trading days. That pattern implies that in prior midterm election years, rallies were not solely tied to one-off events but often unfolded alongside a broader supportive backdrop for energy equities.
A second view that combines net results with best and worst intraperiod moves helps frame the upside and downside ranges that have appeared in this window.
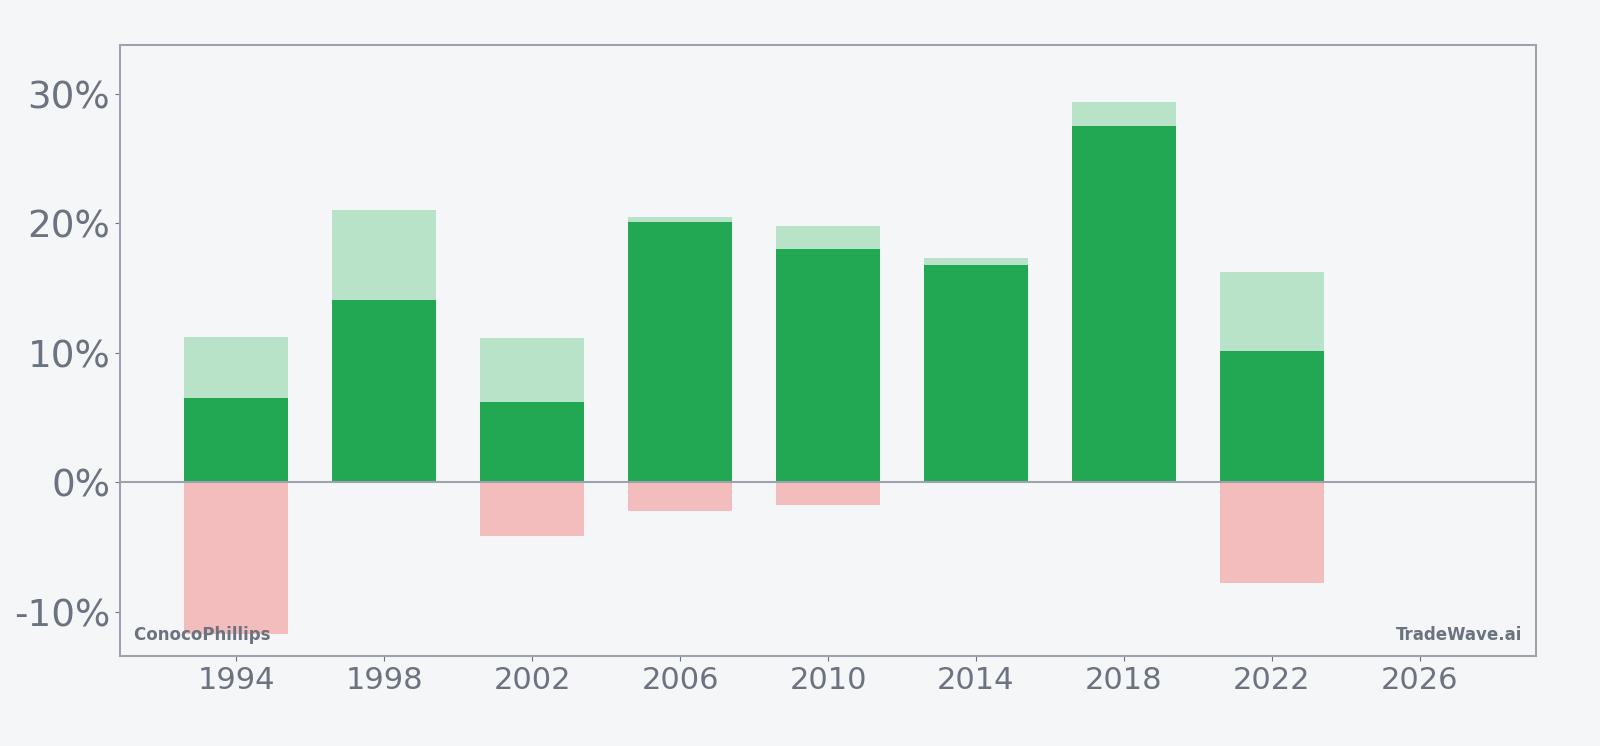
The combined net, maximum favorable move and maximum adverse move profile shows that even in winning years, the stock has sometimes experienced notable drawdowns before finishing higher. For example, in 1994 the net gain of 6.49% came alongside a best intraperiod rally of 11.25% and a worst drawdown of -11.69%, while in 2018 a 27.47% net gain was paired with a 29.37% best run-up and only a 1.0% worst pullback. That mix points to a window where upside potential has historically been meaningful, but where the path has occasionally involved sharp swings in both directions.
The per-year table also highlights how this midterm election-year window has behaved across different macro and oil-price regimes. Years like 2006 and 2010 delivered net gains of 20.1% and 18.0% respectively, with relatively modest worst drawdowns of -2.18% and -1.77%, suggesting periods when both the macro backdrop and company-specific drivers aligned with the seasonal tendency. By contrast, 2022 still finished with a 10.14% gain but saw a -7.78% worst drawdown, illustrating that even supportive windows can feature uncomfortable volatility when broader markets or commodities are unsettled.
The cumulative return statistics, including a 199% cumulative gain and a Sharpe ratio of 1.49, indicate that over the full history of this pattern the risk-adjusted profile has been favorable for a long bias. The TradeWave Ratio of 2.19 suggests that price has typically traveled a meaningful distance in the trade direction within the window, reinforcing the idea that this is not a marginal seasonal effect. Taken together, the historical pattern defines the quantitative seasonal backdrop for the current period.
History does not guarantee future results, and even in windows where all past years were winners, adverse excursions can be large enough to challenge positions before any recovery.
Price and near-term drivers
ConocoPhillips closed at $110.01 on Feb 18, up 1.13% on the day, with the latest data set not yet providing a clear 52-week high or low reference for additional context.[2] The move comes after a period in which the company has leaned on higher output and cost reductions to offset a 13% year-on-year drop in Brent crude prices, a combination that helped support profitability despite softer benchmarks.[5]
In Q3 2025, ConocoPhillips reported adjusted profit of $1.61 per share, topping estimates of $1.43 per share as higher production and lower costs cushioned the impact of weaker oil prices.[5] At the same time, the company raised its full-year 2025 production forecast to 2.375 million barrels of oil equivalent per day from a prior range of 2.35 million to 2.37 million, and guided Q4 output to between 2.30 million and 2.34 million barrels of oil equivalent per day.[5] That operational momentum has been a key part of the bull case as investors weigh how much of the seasonal strength is already reflected in the stock.
The strategic backdrop is also shifting as ConocoPhillips integrates its Marathon Oil acquisition, where management expects more than $1 billion in cost savings and a stronger U.S. shale portfolio over time.[5] The company has outlined workforce reductions following the merger to enhance cost efficiency, with cuts focused on corporate and support roles.[3] Those moves are intended to underpin free cash flow and returns to shareholders, but they also introduce execution risk as systems and teams are combined.
Sector-wide, ConocoPhillips has been cited as well positioned for growth in liquefied natural gas and U.S. conventional projects over the next four years, with peer-leading free cash flow growth potential through 2030.[1] That longer-term narrative intersects with the current midterm election-year phase, when policy debates around energy infrastructure, export approvals and climate regulation can influence capital allocation and valuation multiples. For income-focused investors, the stock has also appeared on lists of names favored by top Wall Street analysts for consistent or stable dividend income, reinforcing its role as a core energy holding in some portfolios.[2][4]
Macro conditions remain a swing factor. The earlier drop in Brent crude prices that pressured revenue was partly offset by ConocoPhillips’ operational levers, but future policy decisions in the midterm election year could affect supply expectations, permitting timelines and demand forecasts.[5] That makes the interaction between the company’s execution, the broader oil market and the historically supportive seasonal window particularly relevant as investors look ahead to the transition from the midterm election year into the pre-election year, a phase that has often been more risk-on for equities in past cycles.
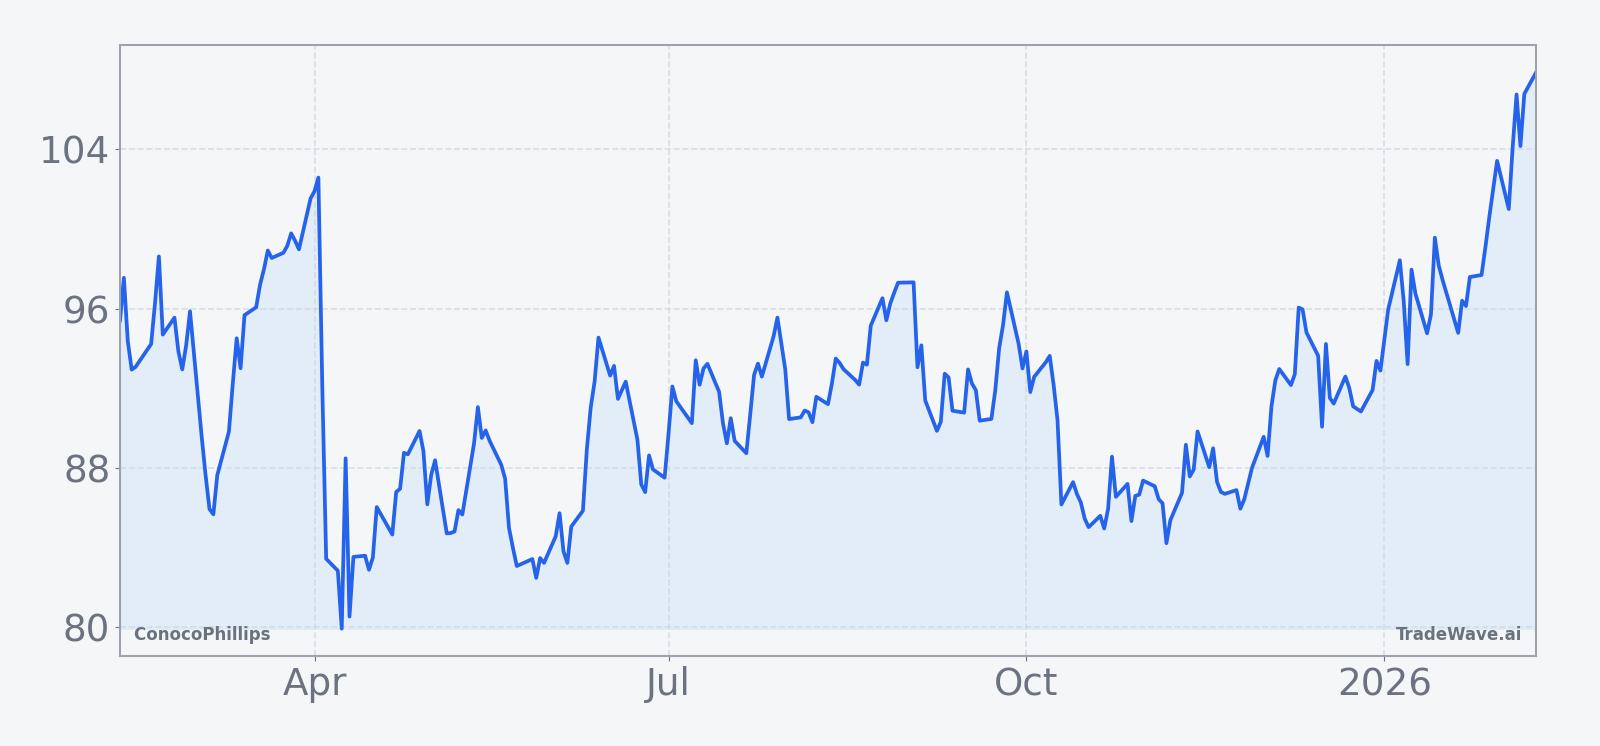
The chart below situates the latest move in its recent multi-month context.
What to watch in this window
For the remainder of this 70-day midterm election-year window, traders and investors will be watching how ConocoPhillips trades around key policy and macro milestones. Any shifts in U.S. energy regulation, export policy or fiscal priorities that emerge as the midterm election year progresses could either reinforce or counteract the historically constructive seasonal tendency for the stock.
On the company side, follow-through on the raised production guidance and the realization of expected cost savings from the Marathon Oil acquisition will be central to whether fundamentals stay aligned with the historical pattern.[5] Evidence that output is tracking toward the higher end of guidance, or that integration synergies are materializing without major disruptions, would support the case that operational momentum can coexist with the seasonal backdrop.
From a price perspective, the historical data suggest that this window has often featured meaningful intraperiod swings even in winning years, so how the stock behaves on pullbacks will be important. Shallow and short-lived dips would be more consistent with years like 2014 or 2018, where worst drawdowns were limited, while deeper and more prolonged setbacks would echo years such as 1994 or 2022, when investors had to tolerate larger adverse moves before the pattern ultimately resolved higher.
Finally, as the calendar moves from the early part of the midterm election year toward the eventual pre-election year, markets will be gauging whether the broader risk appetite that often characterizes that later phase begins to show up in energy equities. If ConocoPhillips continues to execute on its production and cost plans while policy signals remain supportive or at least predictable, the interaction between those drivers and the historically strong seasonal window will be a key storyline for the stock in the months ahead.
Sources
- [1] CNBC, “Top Wall Street analysts recommend these dividend stocks for stable income,” Nov 30, 2025.
- [2] CNBC, “Top Wall Street analysts recommend these stocks for consistent income,” Feb 15, 2026.
- [3] GuruFocus, “ConocoPhillips (COP) Plans Workforce Reductions Post-Merger,” Apr 23, 2025.
- [4] Yahoo Finance, “ConocoPhillips (COP): Among the Best Stocks to Buy Before Spring,” Mar 4, 2025.
- [5] Reuters, “ConocoPhillips lifts dividend, raises output forecast after profit beat,” Nov 6, 2025.