NASDAQ Composite
The NASDAQ Composite index includes over 3,000 stocks listed on the Nasdaq exchange, heavily weighted toward technology and growth companies.
The seasonal picture for NASDAQ Composite splits sharply depending on which lens you apply. The last ten consecutive years paint an increasingly bullish arc: 60% win rates at 30 days climbing to 90% at 90 days, with a projected 27% gain to 31,267. But midterm election years tell the opposite story, showing win rates collapsing to 38.5% at both 60 and 90 days, with average losses exceeding 3% and a projected decline to 22,479.
That divergence is the critical tension here. NASDAQ's growth-stock concentration makes it particularly sensitive to the policy uncertainty and rate volatility that historically define midterm cycles. With the index already down 0.89%, traders should watch whether the broader consecutive-year tailwind or the midterm headwind asserts dominance over the next 30 days.
Seasonal Price Projections
Select a historical basis and projection horizon to see where seasonal patterns suggest NASDAQ Composite may be headed.
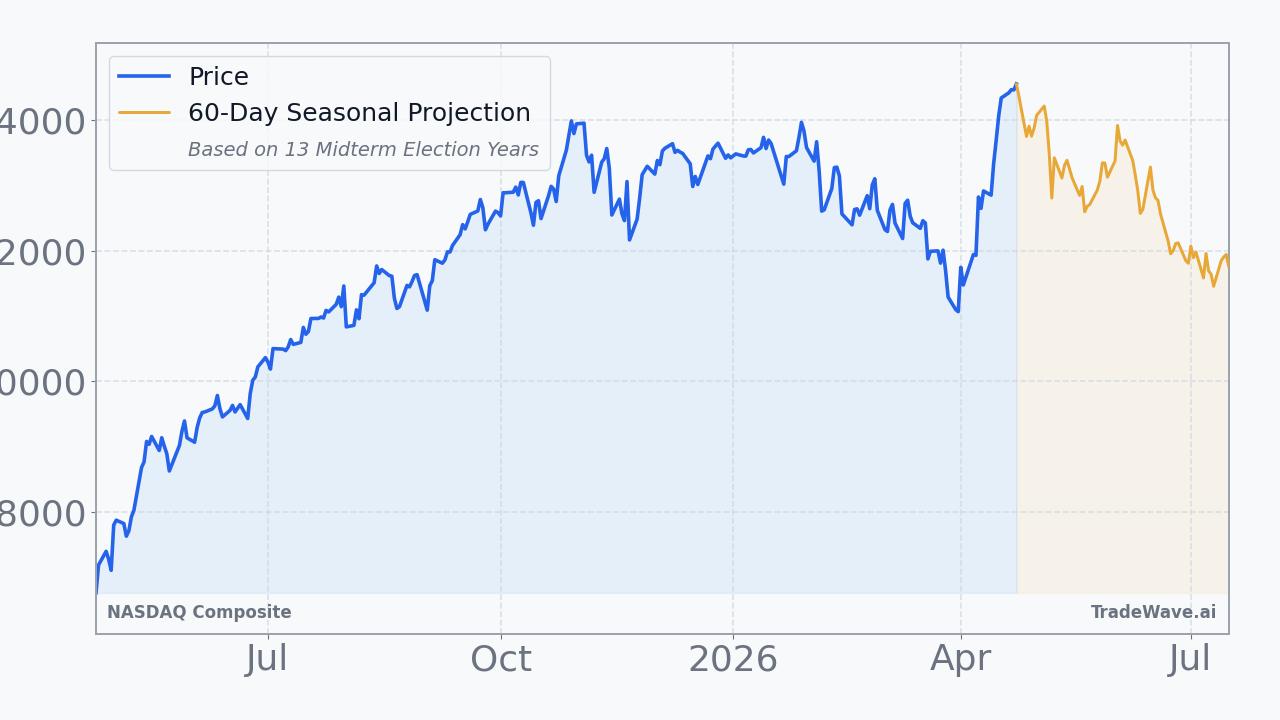
Projection as of Apr 24, 2026 from closing price $24,438.50
How to Use This Data
Seasonal projection data for the NASDAQ Composite illustrates how the index has historically performed during this same calendar period across prior years. The 80.0% consecutive win rate means the index closed higher in 80 out of every 100 comparable historical periods, while the midterm election year win rate of 38.5% reflects a notably weaker pattern during those specific cycles.
When the two bases point in opposite directions, as they do here, it signals that the election cycle environment has historically produced meaningfully different outcomes than the broader consecutive pattern alone would suggest. The median return is often more reliable than the average in these cases, since extreme outlier years can distort averages and the median better represents the typical historical experience.
Seasonal patterns cannot account for sudden shifts in monetary policy, geopolitical developments, earnings surprises, or macroeconomic shocks. A win rate of 80.0% reflects historical frequency, not certainty, and any individual year can fall outside even the strongest historical tendencies.
Market participants often use seasonal data as one layer of context alongside fundamental analysis, valuation metrics, and technical signals. The projected return range, from a best historical of plus 17.3% to a worst of minus 13.6%, illustrates the breadth of possible outcomes and underscores why seasonal tendencies inform expectations rather than replace comprehensive analysis.
This information is provided for educational purposes only and does not constitute financial advice, a recommendation, or a solicitation to buy or sell any security. Seasonal patterns are based on historical data and do not guarantee future performance. All investment decisions carry risk. Consult a qualified financial advisor before making investment decisions.
Understanding Seasonal Projections
Seasonal projections estimate future price movement based on how NASDAQ Composite has historically performed during the same calendar period. These are statistical baselines derived from decades of market data, not predictions.
Consecutive Years (Last 10)
Uses the most recent 10 years of data regardless of market regime. This captures the broadest recent behavior, including all economic and political environments. Over the next 60 trading days, this pattern has been positive 8 of 10 times with an average return of +5.4%.
Midterm Election Years (13 Available)
Uses only years that fall in the same position within the 4-year U.S. presidential election cycle. 2026 is a midterm election year. Markets often exhibit distinct patterns tied to fiscal and monetary policy shifts within this cycle. In 13 historical midterm election years, this 60-day window was positive 5 times with an average return of -3.2%.
Seasonal patterns reflect historical tendencies and do not guarantee future results. All projections are based on past performance and should be used as one input among many in your investment decision-making process. Data provided by TradeWave.ai.
Latest News
Recent headlines related to NASDAQ Composite, sourced from major financial news outlets with AI sentiment analysis.
- Review & Preview: Earnings Storm
- Stock market today: Dow, S&P 500, Nasdaq futures hold steady after Israel and Lebanon announce three-week ceasefire extension
- Stocks close lower on fading hopes for quick Iran deal
- Hercules Capital (HTGC) Sees a More Significant Dip Than Broader Market: Some Facts to Know
- Consolidated Water (CWCO) Increases Despite Market Slip: Here's What You Need to Know
- Garmin (GRMN) Registers a Bigger Fall Than the Market: Important Facts to Note
- BigBear.ai Holdings, Inc. (BBAI) Registers a Bigger Fall Than the Market: Important Facts to Note
- American Tower (AMT) Advances While Market Declines: Some Information for Investors
- Astrazeneca (AZN) Suffers a Larger Drop Than the General Market: Key Insights
- Here's Why Bumble Inc. (BMBL) Fell More Than Broader Market
Explore More
Other markets with seasonal analysis and recent pattern articles.