Crude Oil (WTI)
West Texas Intermediate (WTI) crude oil is the primary benchmark for U.S. oil pricing. It is one of the most actively traded commodities in the world.
Seasonal history sends a cautious signal for WTI crude at $97.18. The 10-year consecutive pattern shows a 60% win rate over 30 days but deteriorates to just 40% at the 90-day horizon, with a median return turning negative at -0.73%. Midterm election years reinforce that skepticism, posting a 40% win rate over 90 days and an average return of -1.14%, suggesting the political cycle adds meaningful headwinds.
What makes this setup notable is the divergence between average and median returns. Massive outlier rallies, including a best-case 94%, inflate the averages while medians tell a flatter story. In midterm years specifically, crude tends to underperform its own historical norms. Watch whether prices can hold above $94 as the key support level across all projected targets.
Seasonal Price Projections
Select a historical basis and projection horizon to see where seasonal patterns suggest Crude Oil (WTI) may be headed.
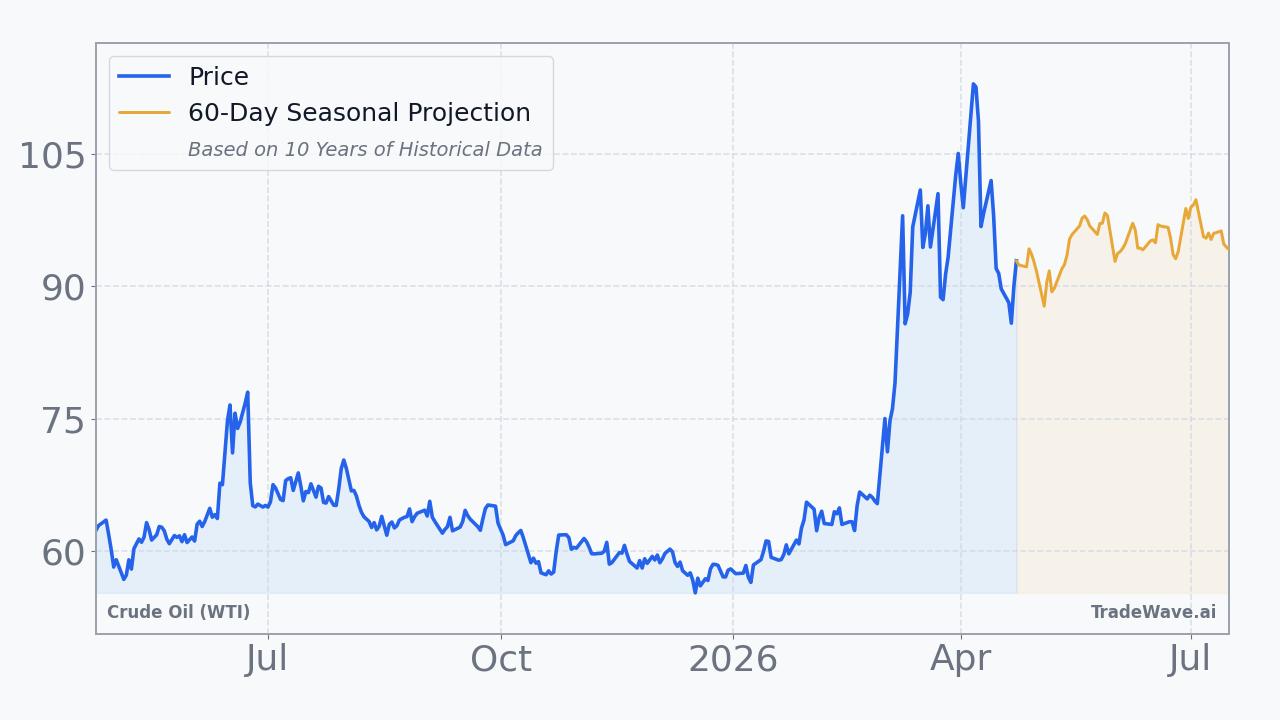
Projection as of Apr 24, 2026 from closing price $97.18
How to Use This Data
Seasonal projection data for Crude Oil (WTI) reflects how the commodity has historically performed during this same calendar period across prior years. The 60-day consecutive win rate of 50.0% means WTI finished higher than its starting price in exactly half of those historical instances, while the midterm election year pattern shows an identical 50.0% win rate with an average return of -0.5%.
When both the consecutive and midterm election year bases point in the same direction, the signal carries more consistency across different historical lenses. In this case, the median return is often more informative than the average, since extreme outliers like the historical best of +90.9% can significantly skew averages away from the typical experience.
Seasonal patterns cannot account for sudden supply disruptions, geopolitical developments, OPEC decisions, currency shifts, or macroeconomic surprises that frequently drive commodity prices. A 50.0% win rate does not imply any certainty about the current period, and these projections represent statistical tendencies drawn from the past, not predictions of future outcomes.
Market participants often use seasonal data as one contextual layer alongside fundamental supply-and-demand analysis, technical price levels, and broader portfolio risk considerations. Understanding historical tendencies can help frame expectations and timing context, but no single data source should drive decisions in isolation.
This information is provided for educational purposes only and does not constitute financial advice, a recommendation, or a solicitation to buy or sell any security. Seasonal patterns are based on historical data and do not guarantee future performance. All investment decisions carry risk. Consult a qualified financial advisor before making investment decisions.
Understanding Seasonal Projections
Seasonal projections estimate future price movement based on how Crude Oil (WTI) has historically performed during the same calendar period. These are statistical baselines derived from decades of market data, not predictions.
Consecutive Years (Last 10)
Uses the most recent 10 years of data regardless of market regime. This captures the broadest recent behavior, including all economic and political environments. Over the next 60 trading days, this pattern has been positive 5 of 10 times with an average return of +10.0%.
Midterm Election Years (10 Available)
Uses only years that fall in the same position within the 4-year U.S. presidential election cycle. 2026 is a midterm election year. Markets often exhibit distinct patterns tied to fiscal and monetary policy shifts within this cycle. In 10 historical midterm election years, this 60-day window was positive 5 times with an average return of -0.5%.
Seasonal patterns reflect historical tendencies and do not guarantee future results. All projections are based on past performance and should be used as one input among many in your investment decision-making process. Data provided by TradeWave.ai.
Latest News
Recent headlines related to Crude Oil (WTI), sourced from major financial news outlets with AI sentiment analysis.
- Collapsing Volatility Turbocharges Returns in Carry Trades
- Asian stocks slip, tracking Wall Street losses, and Iran war doubts push oil higher
- Oil extends gains, stocks sink as peace talk hopes fade
- How The LTM (NSEI:LTM) Story Is Shifting With New Analyst Targets And Fair Value Estimates
- Stocks close lower on fading hopes for quick Iran deal
- Delek Logistics Partners, LP Increases Quarterly Cash Distribution to $1.13 per Common Limited Partner Unit
- How Chris Ong helped Seatrium emerge from a messy merger between two shipyards to become a profitable offshore oil and wind giant
- Aircraft Demand Is Still Strong. These 3 Stocks Are Ready to Gain.
- How major US stock indexes fared Thursday 4/23/2026
- ONEOK Declares Quarterly Dividend
Explore More
Other markets with seasonal analysis and recent pattern articles.