5 of 6 Midterm Spring Runs Have Favored Corn (CME) (ZC) as 62-Day Window Opens
Corn (CME) is heading into a historically bullish 62-day midterm-year window just as futures rebound from USDA supply shocks and heavy fund selling.
Key takeaways
- A 62-day spring window for Corn (CME) in midterm election years starts Mar 10 and has favored long positions.
- Historically, this window has produced gains in 5 winners versus 1 loser, with 83% of years finishing positive.
- Average profit in winning years is 3.16%, while the all-years average including the lone loss is still 3%.
- Intraperiod swings have been meaningful, with past years showing both sharp rallies and drawdowns before the final result.
- Today’s close at 448.75 leaves ZC about 8.6% below its 52-week high and 21.7% above its 52-week low, after a 3.9% daily jump.
- USDA supply revisions and farmers’ plans for large corn acres frame this seasonal window against a heavy fundamental backdrop.[1]
According to historical data from TradeWave.ai, this specific midterm-year spring stretch has behaved differently from an average month on the corn calendar, and the next iteration is about to open.
Seasonal window
Corn (CME) has risen in 5 of the last 6 midterm election-year spring windows that begin around Mar 10, averaging 3.16% gains for the winners. Futures settled Thursday at 448.75, up 3.9% on the day, leaving the contract about 8.6% below its 52-week high of 490.75 and roughly 21.7% above its 52-week low of 368.75.
This seasonal window begins on Mar 10 and runs for 62 trading days, covering the heart of U.S. planting season in the year before the presidential election. Grouping by the presidential cycle matters here because midterm years often bring policy uncertainty on trade, biofuel mandates and farm support, which can amplify weather and acreage headlines into outsized price swings.
The trade direction for this pattern is long. Across the last six midterm election years in this phase, 83% of the windows finished positive, with 5 winners and 1 loser. Average profit in the winning years is 3.16%, while the average outcome across all six years, including the lone down year, is still a 3% gain. The median result of 2.42% shows that the typical year has delivered a modest but consistent upside bias rather than a single outlier driving the stats.
Maximum favorable moves inside the window have been much larger than the final closes. In the strongest year, 2014, corn rallied as much as 10.06% from the entry point before finishing the window up 5.4%. In 2022, the best intraperiod run-up reached 9.14% with a final gain of 3.79%. On the downside, the worst intraperiod drawdown came in 2022 as well, with a maximum adverse move of 5.84% from entry, while the only losing year in the sample, 2002, saw a 4.7% drawdown before ending the window down just 0.37%.
The per-year path shows that the weakest outcome, 2002, still featured a 2.97% rally at one point before rolling over, while the more recent cycles tended to build gains in the middle of the window rather than at the very start. That suggests traders have often had to sit through early noise before the seasonal tailwind asserted itself. The cumulative return across all six windows is 16%, and the annualized return of 2.56% for this slice of the calendar lines up with a Sharpe ratio of 0.98, indicating a reasonably strong risk-adjusted profile for a futures contract.
The TradeWave Ratio (TWR) for this pattern is 2.13. TradeWave Ratio (TWR) reflects how far price typically travels in the trade direction within the window regardless of the final close. In plain English, corn has often moved meaningfully in the long direction at some point during this stretch, even in years where the final gain was modest.
Looking at individual years, 2014 stands out as the strongest example of the pattern, with a 5.4% net gain and only a shallow 0.79% worst drawdown from entry. The softest outcome, 2002, still fits the broader story of volatility: a small final loss but a sizable intraperiod rally and a deeper drawdown. That mix of outcomes is consistent with a window that has tended to reward long exposure more often than not, but with enough noise to punish poor risk management.
History does not guarantee a repeat, but the record is clear: in the last six midterm election years, this 62-day spring window has favored the long side in corn more often than it has hurt it.
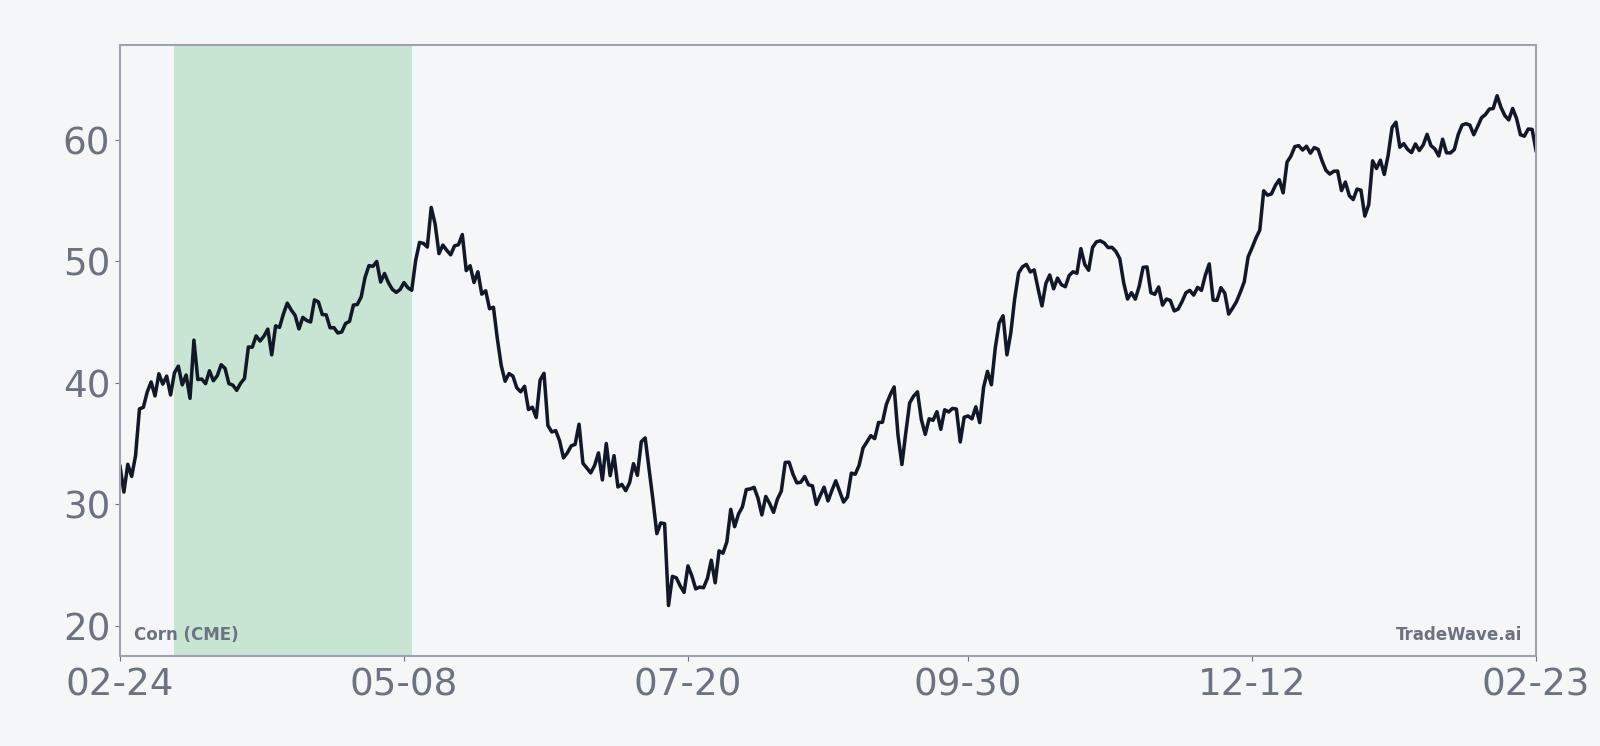
Year-by-year bars with maximum favorable and adverse moves show how often corn has swung hard inside this window before settling on a final result.

History does not guarantee future results, and even in winning years the worst intraperiod drawdowns (MAE) have been large enough to challenge unhedged positions.
Price and near-term drivers
Corn futures have started March on firmer footing. ZC closed Thursday at 448.75, up 17 cents or 3.9% on the day, extending a one-month gain of 3.56% and trading above its 50-day moving average of 433.27 on relatively light volume of 70,464 contracts versus a 20-day average near 194,000.
The rebound comes after a bruising winter for grains. On Jan 12, the U.S. Department of Agriculture lifted projected U.S. corn ending stocks to 2.23 billion bushels, a heavier cushion than many traders expected and a catalyst for sharp price drops across the complex.[1] Then on Feb 18, USDA revisions to 2025 acreage and yield estimates again leaned bearish for prices, yet farmers told Reuters they still see big corn acres as their best shot at breaking even in a tough margin environment.[1]
That combination of heavier stocks and stubbornly high intended plantings has kept speculative money on the defensive. Managed money positioning has already seen one near-record purge of bullish corn bets in response to tariff worries in 2025, when funds slashed net longs and highlighted how quickly sentiment can flip when policy risk collides with supply shocks.[2] The current setup is different in detail but similar in feel: policy and USDA surprises are again steering flows just as a historically important seasonal window approaches.
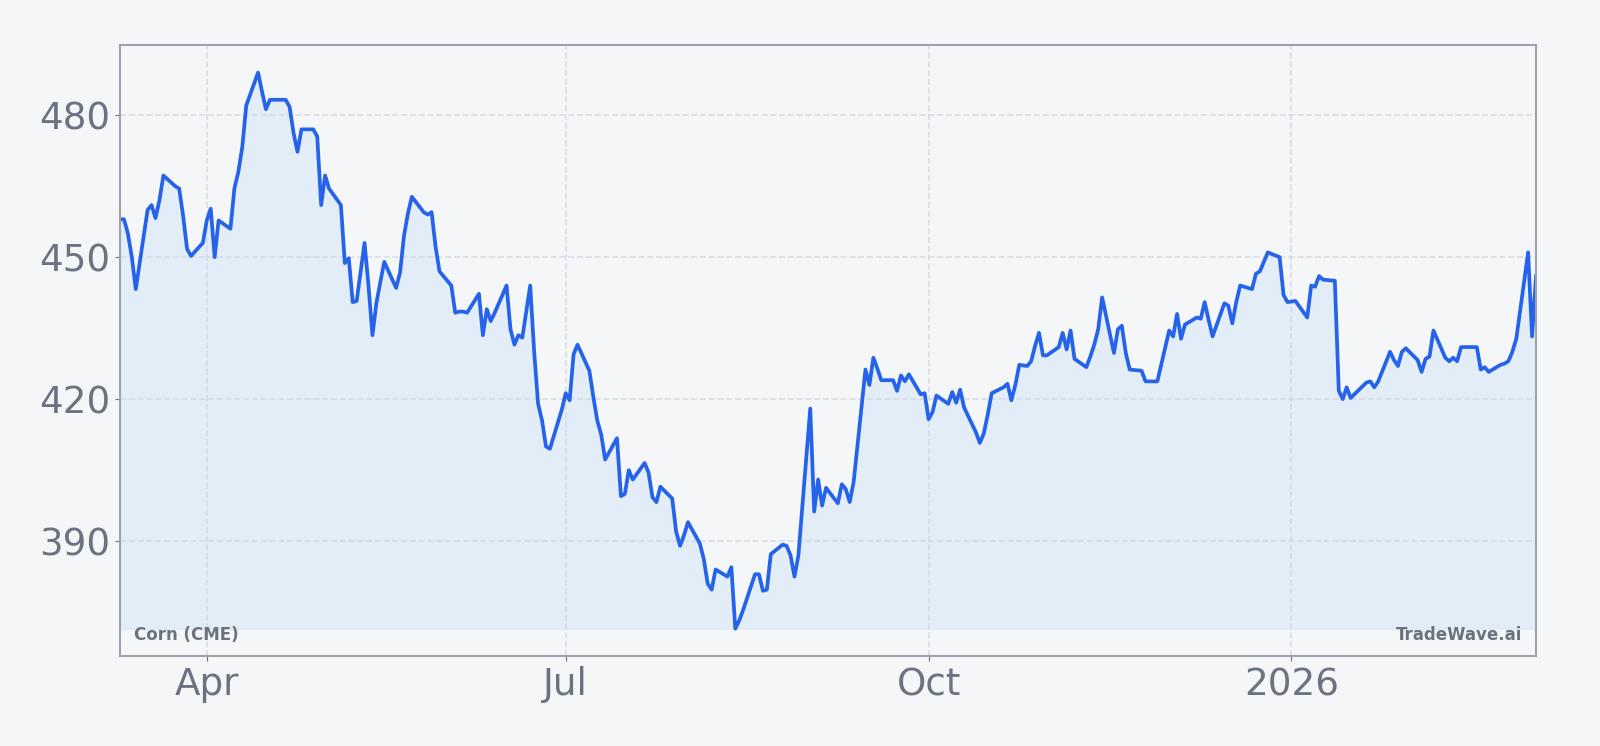
The chart below situates the latest bounce against the past year of trading in Corn (CME) futures.
Macro and policy backdrop
The broader macro story for corn in early 2026 is about supply comfort colliding with fragile farm economics. USDA’s higher stock estimates and yield revisions have signaled that the market is not short of grain, yet farmers still plan to plant large corn acres because alternative crops do not pencil out much better on current price decks.[1] That keeps a lid on long-term price expectations even as short-term weather or logistics shocks can still spark rallies.
Trade policy remains a wild card. In March 2025, tariff fears triggered a rapid liquidation of bullish corn positions as funds rushed to the exits.[2] While that episode is a year old, it is a reminder that midterm election years often bring renewed debate over tariffs, biofuel mandates and export programs. Any fresh policy surprise in 2026 would land right inside the upcoming seasonal window, potentially amplifying the historical tendency for sizable intraperiod swings.
For end users and food companies, the current price band matters. With corn about 8.6% below its 52-week high and more than 21% above its low, the market is neither at panic lows nor at rationing highs. That middle-of-the-range status gives policy and weather headlines more room to push prices in either direction without immediately hitting obvious technical extremes.
What to watch as the window opens
The 62-day window that starts on Mar 10 will overlap key points on the policy and planting calendar. Traders will be watching the next round of USDA supply and demand updates, any fresh guidance on 2026 acreage, and signals from Washington on trade or biofuel rules. A pattern of firm closes and contained drawdowns early in the window would line up with the historical bias toward positive outcomes, while a quick break below the 50-day moving average with deep intraperiod losses would look more like the weaker years in the sample.
Price levels around the recent high near 449 and the 52-week high at 490.75 are natural reference points. Sustained trade above the 50-day moving average with rallies that hold rather than fade would echo the stronger midterm-year windows such as 2014 and 2022. By contrast, a market that repeatedly spikes higher intraday but finishes flat or lower, especially if accompanied by renewed fund selling, would suggest that the seasonal tailwind is being overwhelmed by supply and policy headwinds.
Positioning will also matter. The 2025 tariff scare showed how quickly funds can unwind longs when policy risk rises.[2] If speculative length starts to rebuild into this window and then accelerates on bullish weather or acreage headlines, the historical pattern of sizable maximum favorable moves could reassert itself. If instead funds stay cautious or add to shorts despite the seasonal backdrop, that would be a clear sign that macro and policy concerns are dominating the calendar pattern.
For this cycle, the key tells will be how corn behaves on USDA days, whether price can hold above its 50-day moving average during setbacks, and whether intraperiod drawdowns stay closer to the shallow 2014 profile or revisit the deeper swings seen in 2002 and 2022. History says this window has usually rewarded the long side, but the path has rarely been smooth.