Industry Consolidation After Rayonier-PotlatchDeltic Tie-Up Weighs on Lumber (LB) Outlook
Lumber futures are trading without a clear trend as the market heads toward a midterm-election-year seasonal stretch that has historically favored downside moves and elevated volatility.
Key takeaways
- Lumber is set to enter a 198-day seasonal window on Mar 6, 2026 that historically aligns with the midterm election year in the U.S. presidential cycle.
- Across this window, the historical trade direction is short, with returns tending to favor lower prices rather than rallies.
- The pattern has been profitable in 100% of the 11 historical midterm-year instances, with 11 winners and 0 losers over the lookback.
- Average profit in winning years is 20.3%, highlighting a sizable typical move when the pattern has worked.
- Historical best and worst intraperiod swings show that both maximum favorable and maximum adverse moves can be large, underscoring the potential for sharp volatility inside the window.
- The setup arrives as the timber and wood products industry continues to digest a major merger that could reshape North American lumber supply and pricing over time.[1]
According to historical data from TradeWave.ai, this upcoming midterm-year stretch for Lumber has shown a distinct seasonal bias in prior cycles. The next section looks at how that pattern has behaved and what it may signal about the backdrop for 2026.
Seasonal window
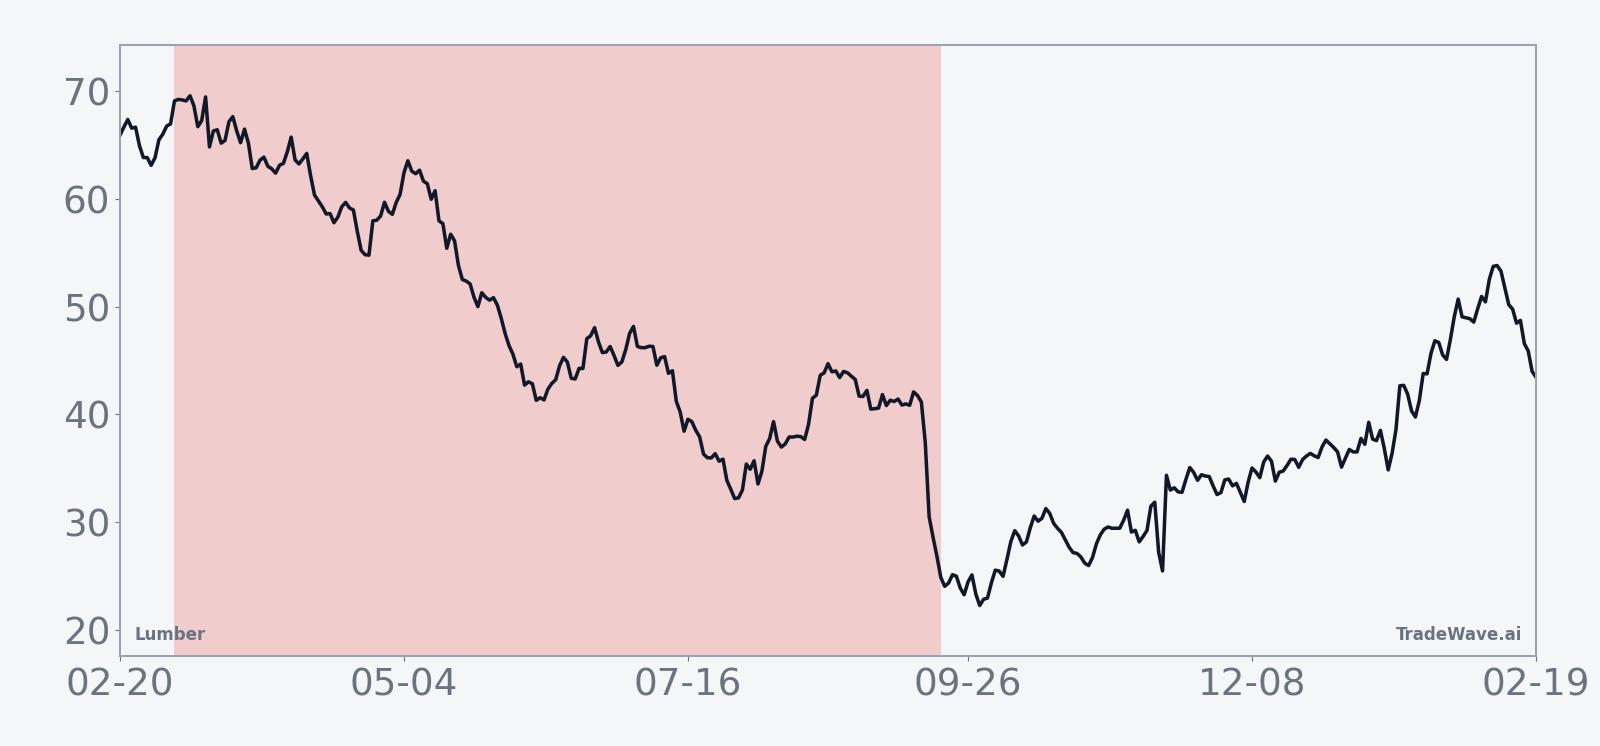
This seasonal window begins on 2026-03-06 and spans 198 days. Historically, during this period, Lumber has shown a weak directional tendency that favors lower prices in midterm election years. With futures currently trading between last year’s extremes and lacking a clear directional push, the historical pattern is emerging as a key reference point for traders trying to frame risk and opportunity into the second half of 2026.
Grouping the data by the presidential election cycle matters here because midterm years often coincide with shifting fiscal priorities, regulatory debates and infrastructure agendas that directly affect construction activity and wood demand. For a cyclical commodity like Lumber, those policy swings can amplify or dampen price moves, so isolating midterm-year behavior helps separate election-driven noise from more typical seasonal forces.
This seasonal window is built on a short trade direction, meaning the historical pattern has favored downside outcomes rather than rallies. Across the midterm-year lookback, the window has been profitable in 100% of the 11 years studied, with 11 winners and 0 losers, which is unusually consistent for a commodity contract. The average profit in those winning years is 20.3%, indicating that when the pattern has worked, the move lower has tended to be meaningful rather than marginal.
Within that average, individual years have shown a wide range of outcomes. The strongest example in the sample is 2022, when the contract fell 60.68% from entry to exit during the window, while one of the milder instances was 1990, which saw a 3.15% decline over the same seasonal span. These bookends illustrate how the same calendar stretch can deliver both grinding softness and outright breaks, even though the direction has historically leaned the same way.
The intraperiod behavior has also been volatile. In some years, such as 2010 and 2018, the maximum favorable move from the entry point was more than 20% at some stage of the window, while the worst drawdowns from entry in losing stretches of the path have exceeded 30% in several cases. In plain English, the best point-to-peak moves and the worst pullbacks inside the window have both been large, which means traders have historically faced significant swings even when the final outcome ended in profit for the short pattern.
Trend statistics from the same dataset show that about 70% of the window’s internal trend days have historically aligned with the short direction, with only around 30% favoring countertrend rallies. That skew suggests that while sharp squeezes have occurred, the prevailing tendency across the 198 days has been for rallies to fade and for downside pressure to reassert itself over time.
The cumulative return profile for the window typically shows a pattern of early choppiness followed by a more persistent drift lower as the midterm year progresses. Rather than a straight line, the historical path has tended to feature several countertrend bounces that ultimately give way to renewed weakness, which is consistent with a market digesting changing policy signals and demand expectations over many months.
A second view of the same window highlights how far prices have typically swung in both favorable and adverse directions before the period ends.
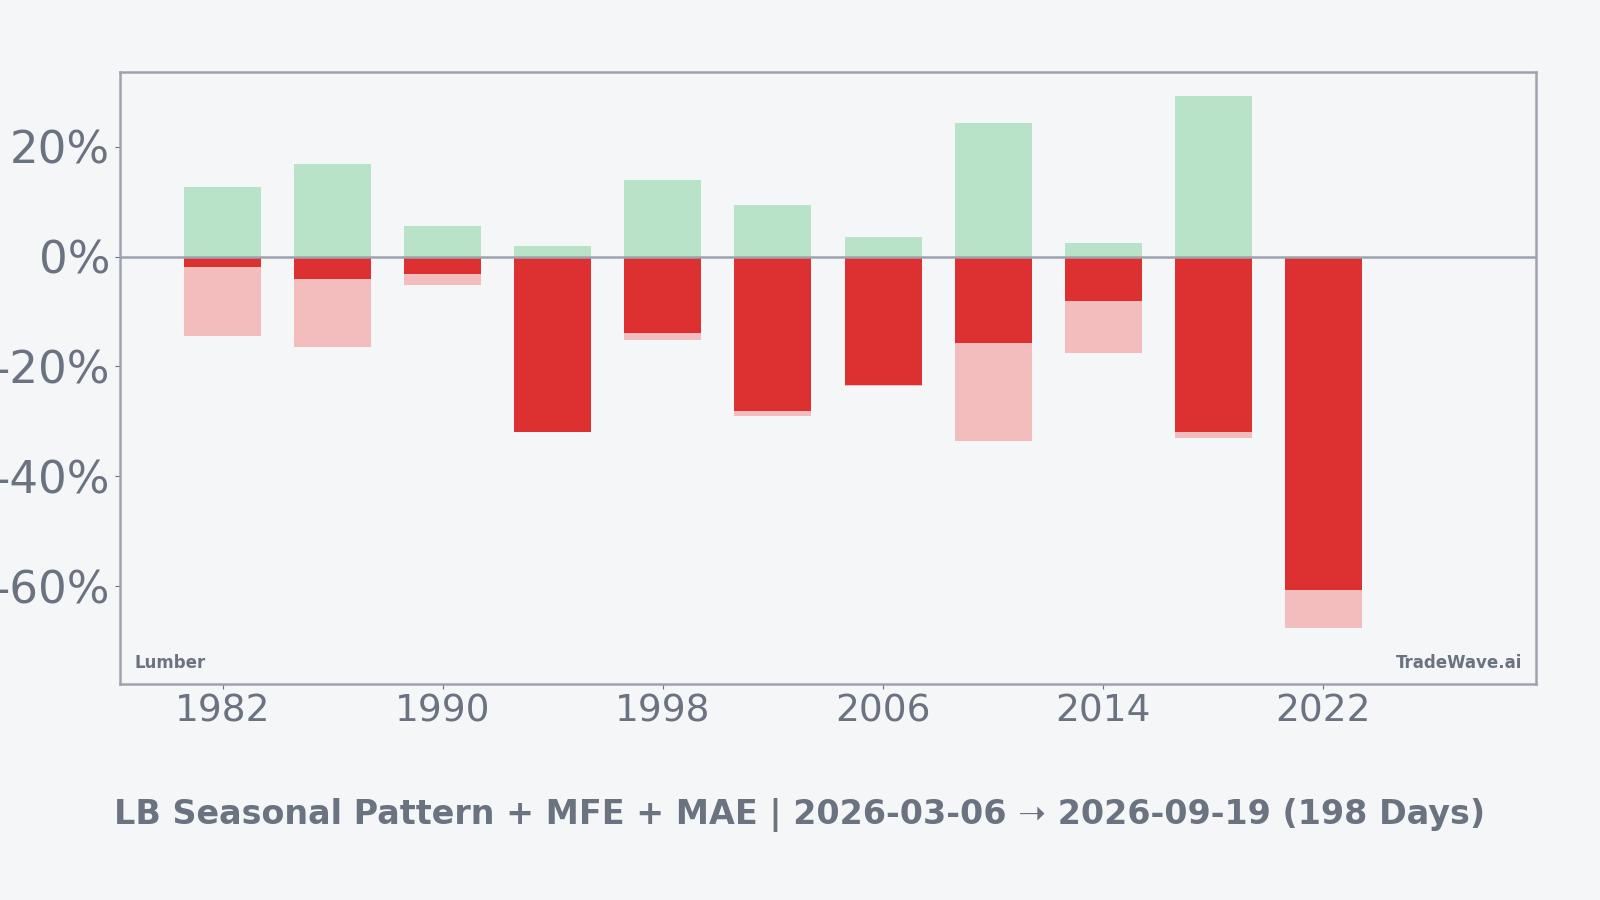
History does not guarantee future results, and adverse excursions (MAE) can be large even in winning windows.
Taken together, the historical pattern defines the quantitative seasonal backdrop for the period Lumber will enter in early March, framing a midterm-year window that has often coincided with sustained downside pressure and sizable intraperiod swings.
Price and near-term drivers
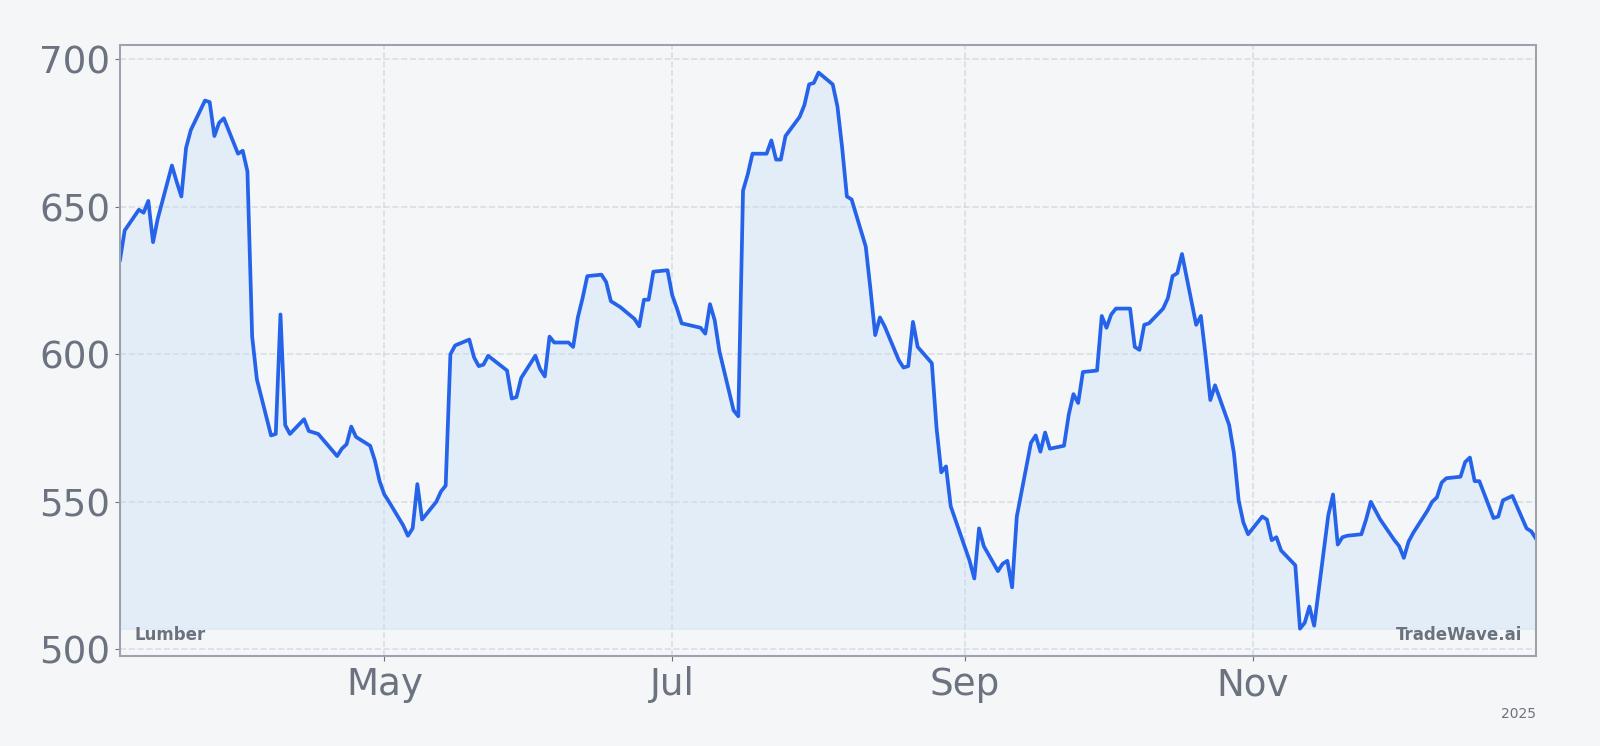
With no fresh price data available for early 2026, Lumber futures appear to be trading between last year’s highs and lows, leaving the contract without a clearly established trend as the new year begins. That neutral backdrop means traders are increasingly focused on structural forces in the timber market and on how those might interact with the upcoming seasonal regime.
In Oct 2025, Rayonier Inc. agreed to buy PotlatchDeltic Corp. in a multibillion-dollar all-stock deal that created one of the largest timber and wood products companies in North America, a move that could influence lumber supply, pricing power and contract liquidity over time.[1] The merger underscores how industry consolidation can reshape the balance between sawmill capacity, log supply and downstream demand from homebuilding and renovation, all of which feed directly into Lumber futures pricing.
For macro-focused traders, the timing of the seasonal window within the midterm election year is also notable. Midterm years often feature debates over housing policy, infrastructure spending and environmental regulation, each of which can affect construction activity and timberland economics. If policy uncertainty weighs on building plans or financing conditions, it could reinforce the historical tendency toward weaker prices in this stretch; if instead fiscal support or easing financial conditions boost construction, that could challenge the pattern.
The chart below situates the contract’s recent path in its broader 12‑month context.
What to watch as the window approaches
As Mar 6 approaches, traders will be watching whether Lumber begins to show signs of distribution, such as lower highs on rallies or heavier selling on down days, that would align with the historical short bias of the window. A sustained break of recent trading ranges during the early part of the period would be more consistent with prior midterm-year patterns than a decisive upside breakout.
Policy and macro catalysts will be central. Any shifts in interest-rate expectations that affect mortgage costs, changes in housing starts data, or new infrastructure and climate-related spending plans could all alter demand expectations for wood products. If those developments point to softer construction activity, they would fit the historical tendency toward weaker prices; if they instead signal a stronger building cycle, they could set up a test of the seasonal pattern’s durability.
Industry-specific developments tied to the Rayonier–PotlatchDeltic combination will also matter, particularly any updates on mill rationalization, harvest plans or capital spending that change the outlook for North American lumber supply.[1] Traders will be looking to see whether consolidation tightens the market and supports prices or leads to more disciplined production that keeps a lid on rallies during the seasonal window.
Finally, behavior inside the window itself will offer clues about whether the historical pattern is asserting itself. A market that sells off early and then struggles to reclaim lost ground would echo the typical cumulative path, while a contract that shrugs off policy noise and grinds higher would mark a clear departure from prior midterm-year experience. Either way, the 198-day stretch starting in March is likely to be a key reference period for how Lumber trades through the heart of the current election cycle.