S&P 500
The S&P 500 index tracks 500 of the largest U.S. publicly traded companies, weighted by market capitalization. It is widely regarded as the best single gauge of the U.S. equity market.
Seasonal signals for the S&P 500 are sharply divided right now. The trailing 10-year window projects a 19.30% gain over 60 days with a 90% win rate, pointing toward 8,493. But midterm election years tell a starkly different story: a 9.18% decline over that same window, with only a 45.8% win rate across 24 historical instances.
That divergence is the key tension to watch. Midterm years consistently pressure the index through the summer and into fall before a historically strong recovery. The 90-day midterm projection shows a sub-42% win rate, suggesting the seasonal headwind deepens before it eases. Investors should watch whether the index holds above recent support or begins confirming the midterm cycle's historically bearish lean.
Seasonal Price Projections
Select a historical basis and projection horizon to see where seasonal patterns suggest S&P 500 may be headed.
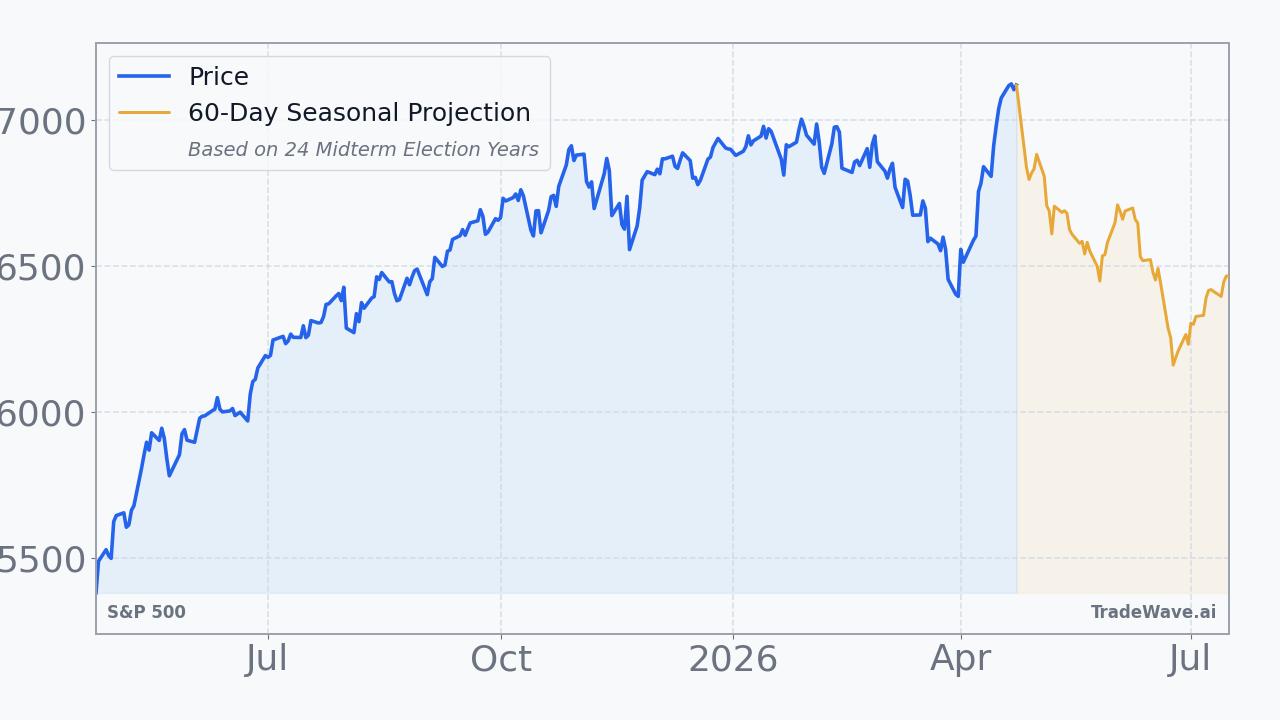
Projection as of Apr 24, 2026 from closing price $7,108.40
How to Use This Data
Seasonal projection data shows how the S&P 500 has historically performed during this exact calendar period across comparable years. The consecutive pattern carries a 90.0% win rate, meaning the index closed higher in 9 out of 10 such historical periods, with an average return of +3.0%. The midterm election year pattern tells a notably different story, with a 45.8% win rate and an average return of -3.0%.
When the two bases diverge like this, it signals that the election cycle has historically created meaningfully different conditions than the broader consecutive pattern suggests. The median return of -1.4% for midterm years is worth noting because it is less distorted by extreme outliers than the average, offering a cleaner picture of the typical outcome.
Historical patterns cannot account for breaking news, Federal Reserve decisions, earnings surprises, geopolitical events, or sudden shifts in market sentiment. A 90.0% win rate reflects past tendencies, not a guarantee of any specific outcome in the current year. The projections are statistical tendencies, not forecasts.
Market participants often use seasonal data as one lens among several, pairing it with fundamental analysis, technical indicators, and macroeconomic context. Diverging bases like these can help calibrate expectations and highlight where historical precedent is less clear, without dictating any particular course of action.
This information is provided for educational purposes only and does not constitute financial advice, a recommendation, or a solicitation to buy or sell any security. Seasonal patterns are based on historical data and do not guarantee future performance. All investment decisions carry risk. Consult a qualified financial advisor before making investment decisions.
Understanding Seasonal Projections
Seasonal projections estimate future price movement based on how S&P 500 has historically performed during the same calendar period. These are statistical baselines derived from decades of market data, not predictions.
Consecutive Years (Last 10)
Uses the most recent 10 years of data regardless of market regime. This captures the broadest recent behavior, including all economic and political environments. Over the next 60 trading days, this pattern has been positive 9 of 10 times with an average return of +3.0%.
Midterm Election Years (24 Available)
Uses only years that fall in the same position within the 4-year U.S. presidential election cycle. 2026 is a midterm election year. Markets often exhibit distinct patterns tied to fiscal and monetary policy shifts within this cycle. In 24 historical midterm election years, this 60-day window was positive 11 times with an average return of -3.0%.
Seasonal patterns reflect historical tendencies and do not guarantee future results. All projections are based on past performance and should be used as one input among many in your investment decision-making process. Data provided by TradeWave.ai.
Explore More
Other markets with seasonal analysis and recent pattern articles.