Dow Jones Industrial Average (DJI) Enters 271-Day Window With a Perfect 10-for-10 Record
A long seasonal stretch that has delivered gains for Dow Jones Industrial Average in each of the past 10 years just opened, even as the index trades below record territory and investors juggle rotation and macro risks.

Key takeaways
- A 271-day seasonal window for Dow Jones Industrial Average that began on Mar 6 has produced gains in 10 of 10 years, with a long trade direction.
- Across the past decade, the window’s average profit has been 10.25%, with a 163% cumulative return and a Sharpe ratio of 1.63.
- Every winning year has seen a positive run-up, with a TradeWave Ratio of 2.7 that points to meaningful intraperiod travel in the trade direction.
- Even in winning years, adverse moves have been sharp at times, including a roughly 29.58% drawdown inside the 2020 window before finishing higher.
- DJI recently pulled back about 6.0% from its 52-week high, leaving the index below January’s record levels as investors weigh rotation and macro uncertainty.
- History suggests this long regime has favored patient long exposure, but the depth of past drawdowns means risk management still matters during the stretch.
According to historical data from TradeWave.ai, this part of the calendar has behaved very differently from an average year for the Dow. The next section walks through how that pattern has played out across the past decade.
Seasonal window
Dow Jones Industrial Average has finished higher in all 10 years of this 271-day window, averaging 10.25% gains for a long trade. The latest iteration started on Mar 6 and arrives with the index at 47,501.55, down 0.9% on the day and about 6.0% below its 52-week high of 50,512.79. That combination of a flawless historical record and a market backing off records gives this year’s run a different feel than the straight-up rallies that defined several prior cycles.
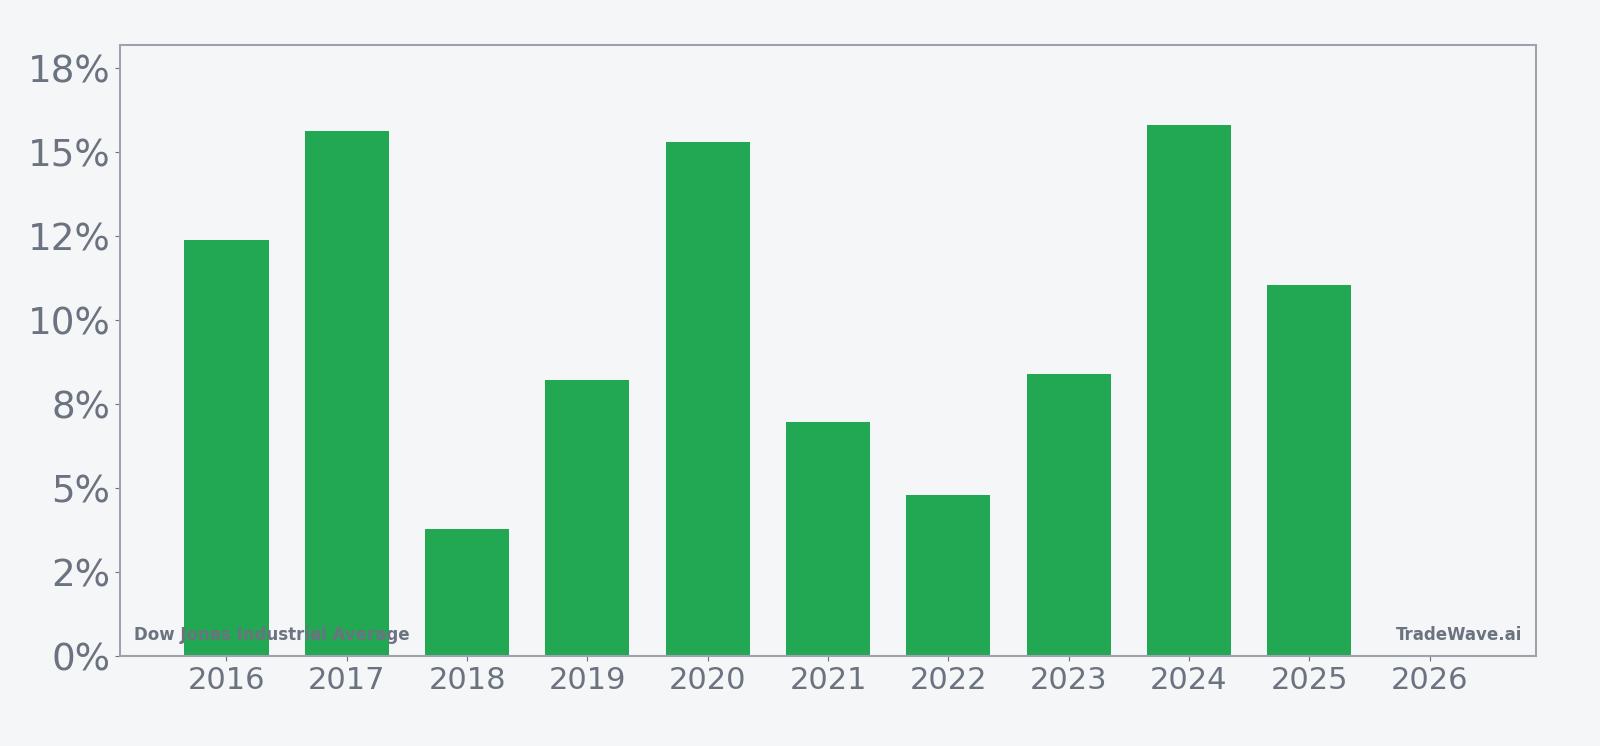
Across the decade, the strongest years in this window have been 2017, 2020 and 2024, with net gains of 15.64%, 15.31% and 15.83% respectively. The softest outcome was 2018, which still finished up 3.79% after a choppy stretch that included a 6.19% intraperiod drawdown. That consistency is unusual for a major index and stands out even more given the macro shocks that landed inside some of these windows.
The historical path is not a straight line. In 2020, for example, the Dow ultimately rallied 15.31% between the Mar 6 entry and the end of the 271-day window, but at one point it was down 29.58% from the starting level before recovering. By contrast, 2021 saw a smoother ride, with a 6.98% net gain and almost no adverse move, as the worst intraperiod drawdown was just 0.06%.
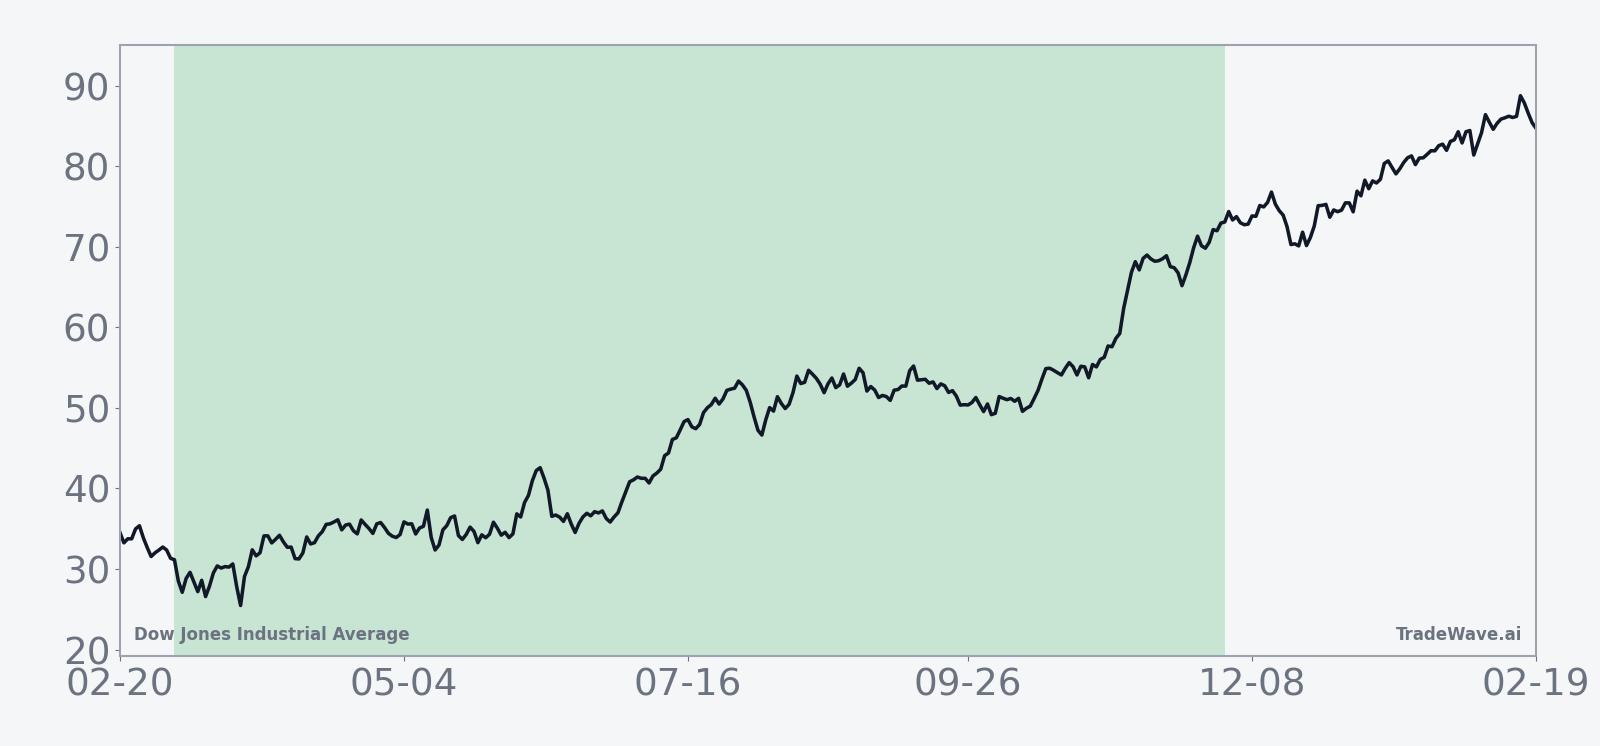
The trend view behind this pattern shows a tendency for gains to build in stages rather than in a single burst. Early parts of the window have often been volatile, with several years posting meaningful pullbacks before the longer grind higher took over. Later in the window, the average path tilts more steadily upward, reflecting how many of the strongest years saw their biggest advances in the back half of the period.
A combined view of net returns with peak run-ups and worst drawdowns shows how far the Dow has tended to swing inside this window.
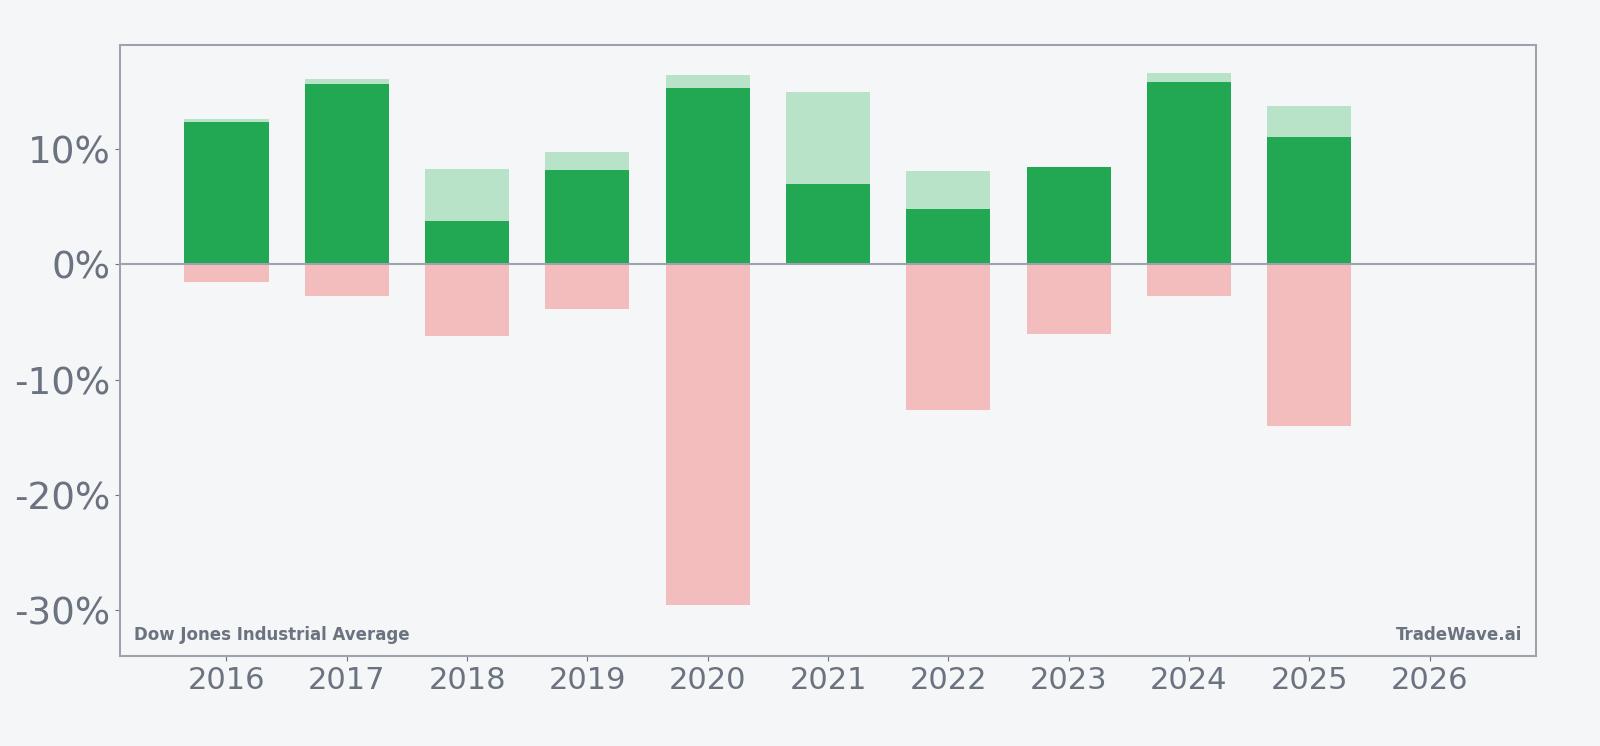
Those bars highlight the trade-off. Maximum favorable moves have often run into the mid-teens, with several years showing peak gains above 16%, while maximum adverse moves have ranged from negligible to nearly 30%. The TradeWave Ratio of 2.7 signals that price typically travels a substantial distance in the long direction during the window, but the 2020 and 2025 bars remind traders that the path can include deep air pockets before the final outcome lands in the win column.
History does not guarantee future results; adverse excursions can be large even in winning windows, so position sizing and risk controls remain critical.
Price and near-term drivers
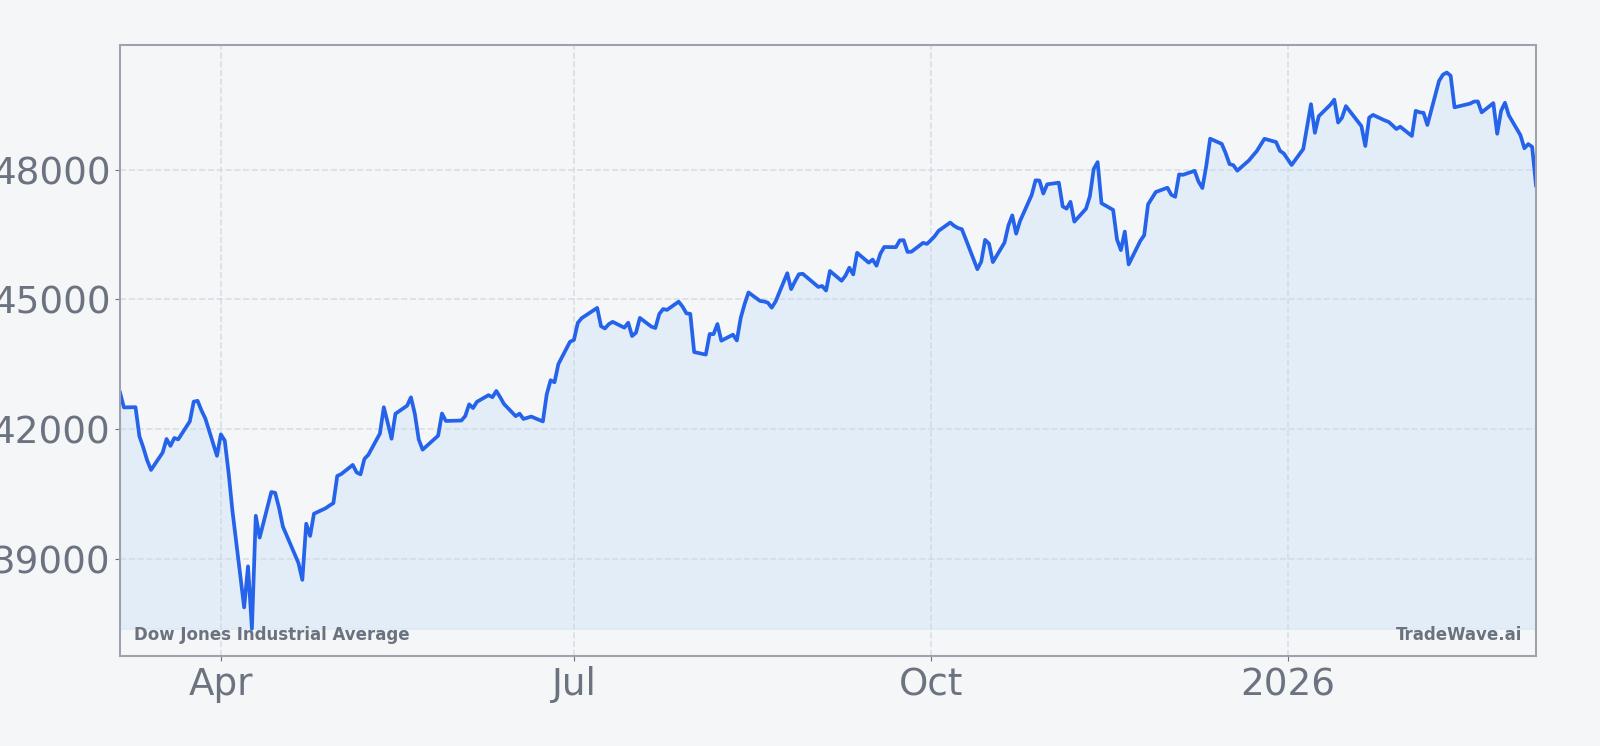
Dow Jones Industrial Average closed Friday at 47,501.55, down 453 points or 0.9% on the session, after trading between 47,009.01 and 47,634.55. The index has slipped 2.88% over the past month and sits about 6.0% below its 52-week high of 50,512.79, even after setting a fresh record close on Jan 5 as investors looked past geopolitical tensions tied to U.S. operations around Venezuela.[3]
That January record capped a run that saw the Dow benefit from investors rotating away from the narrow group of mega-cap AI winners and toward more broadly valued sectors such as healthcare and energy in late 2025.[2] Earlier in the prior year, skepticism from firms like Cantor Fitzgerald about the durability of the broader rally had already pushed some investors to question how long the Dow’s strength could last, especially with Fed policy and earnings in flux.[1]
Bank stocks have also reminded traders how quickly single-name moves can ripple through the price-weighted index. In December 2025, a slide in JPMorgan shares weighed on the Dow ahead of a key Federal Reserve decision, underscoring how concentrated exposures can amplify macro headlines into index-level volatility.[4] More recently, investors have shown a willingness to rotate toward smaller and cheaper companies, a shift that can either complement or compete with flows into the Dow depending on how risk appetite evolves.[3]
The chart below situates the latest pullback against the Dow’s climb to record highs over the past year.
What to watch in this window
The 10-for-10 track record in this 271-day window gives bulls a strong historical backdrop, but the way the Dow behaves inside the stretch will matter more than the averages. Traders will be watching whether early pullbacks resemble the shallow dips of 2021 or the deeper air pockets seen in 2018, 2020 and 2025, when intraperiod drawdowns ran into double digits before the index recovered.
On the macro side, upcoming Federal Reserve decisions and any renewed debate over the pace of rate cuts will be key, given how prior windows have overlapped with policy inflection points and bouts of volatility around bank stocks and retail earnings.[1] Sector rotation is another swing factor: if investors continue to favor more defensive or value-oriented groups over the narrow AI leaders, the Dow’s heavier exposure to industrials, healthcare and financials could again become a relative tailwind.[2]
From a levels perspective, the 50,512.79 high is the obvious line in the sand on the upside, while traders will be watching how the index behaves around its 50-day moving average near 49,117.43 and the recent lows in the 47,000 area. A pattern that sees the Dow defend those supports and grind back toward records would rhyme with the historical seasonal bias. A sustained break lower with expanding breadth to the downside would mark a clear departure from the past decade’s script.
Add it up: the seasonal window has been friendly to long exposure, but the path has rarely been smooth. For this cycle, the tell will be whether early volatility attracts dip buyers in the same way it has in prior years, or whether macro and sector shifts finally force the Dow to write a different chapter.
Sources
- [1] Seeking Alpha, "Wall Street moves lower as investors digest retail earnings and Fed minutes," Aug 20, 2025.
- [2] MarketWatch, "Dow’s banner day points to investor pivot beyond S&P 500’s top winners," Nov 11, 2025.
- [3] The Wall Street Journal, "JPMorgan’s Stock Slide Weighs on Dow Industrials," Dec 9, 2025.