CBOE Volatility Index (VIX) Has Fallen in 10 of 10 Spring-Summer Windows Since 2016
CBOE Volatility Index is heading into a long seasonal stretch where volatility has consistently bled lower, even as today’s level sits far below last year’s panic highs.
Key takeaways
- A 130-day seasonal window for the CBOE Volatility Index starting Mar 6 has seen VIX fall in 10 of the past 10 years.
- The pattern is aligned with a short volatility trade direction, with an average profit of 23.95% across those winning years.
- All 10 years in the sample were winners for the short setup, with 10 winners and 0 losers and a Sharpe ratio of 2.74.
- The TradeWave Ratio of 3.05 signals that VIX has typically traveled meaningfully in the short direction within the window, not just drifted.
- Intraperiod swings have been large, with some years showing point-to-peak spikes above 100% before volatility ultimately faded.
- Today VIX trades at 19.86, about 67.0% below its 52-week high of 60.13, leaving room for both sharp spikes and extended compression.
According to historical data from TradeWave.ai, this upcoming stretch has behaved very differently from an average month on the volatility calendar. The next section walks through how that pattern has played out over the past decade and what it could mean for the next 130 trading days.
Seasonal window
CBOE Volatility Index has declined in 10 of 10 years during this 130-day spring–summer window, with the short-volatility setup averaging a 23.95% gain. The next iteration begins on Mar 6, with VIX at 19.86 after a 6.6% jump today and sitting about 67.0% below its 52-week high of 60.13. That combination of a strong historical tendency for volatility to fade and a still-elevated level versus last year’s lows gives this window unusual weight for anyone running equity risk.
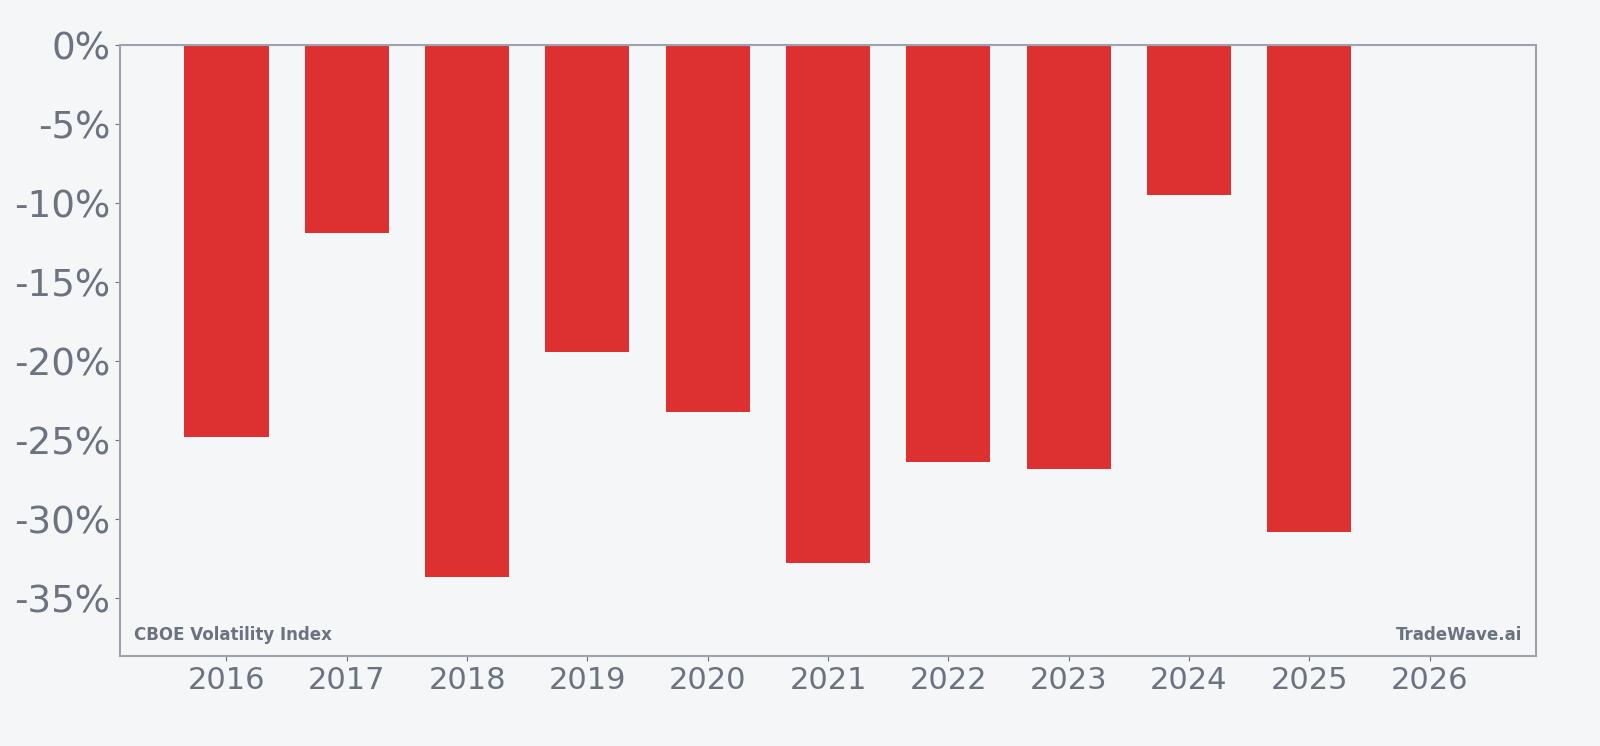
Year-by-year net returns and intraperiod swings show how often early volatility spikes have ultimately given way to lower VIX readings by the end of the window.
Across the decade, the trade direction is firmly short. Every year from 2016 through 2025 ended the 130-day stretch with VIX lower than where it started, which is why the Percent Profitable metric sits at 100% with 10 winners and 0 losers. Average profit of 23.95% reflects the typical gain for a short-volatility stance over the full window, while the median outcome of 25.63% shows that the middle-of-the-pack year was still a sizable move.
The per-year table shows how that has played out in practice. In 2018, for example, VIX started the window at 18.36 and finished at 12.18, a net decline of 33.66% that would have been a strong year for shorts. In 2025, the index fell 30.84% from an entry level of 24.87 to 17.20, again rewarding traders positioned for volatility to compress by the end of the period.
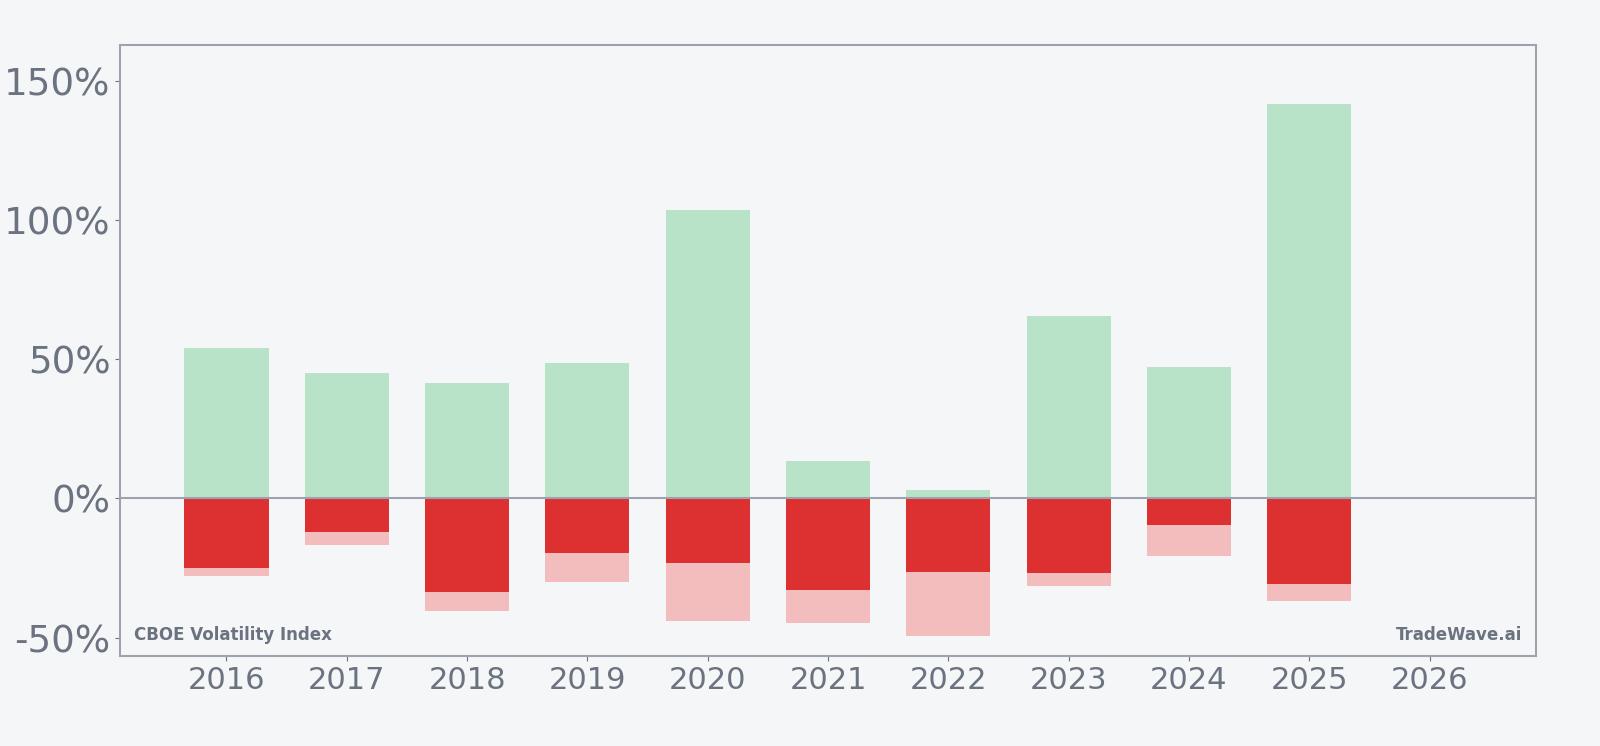
Intraperiod behavior has been far more violent than the smooth end-of-window stats suggest. In 2020, VIX’s best point-to-peak move within the window was a 103.79% surge from the entry level, while the worst drawdown from entry was a 43.87% drop. That is the pattern across many years: large maximum favorable excursions for volatility itself, followed by equally meaningful adverse moves as those spikes are sold and the index drifts lower into the close of the window.
The maximum adverse excursions for the short setup, which correspond to VIX’s biggest rallies from the entry point, have been substantial. Years like 2018 and 2022 saw worst-case intraperiod moves of 40.58% and 49.38% against the short direction before the index ultimately finished lower. That profile means the window has historically rewarded patience but punished poor risk control, especially for leveraged or path-sensitive volatility products.
The cumulative return chart for the pattern, which stacks each year’s outcome, shows a steady climb for the short-volatility strategy rather than a choppy sideways line. Add it up: 738% cumulative return across the 10 iterations, annualized at 23.7%, with a Sharpe ratio of 2.74. The consistency is unusual for any index, let alone one built on fear.
Trend metrics inside the pattern echo that story. The long-trend score for the short direction is 100, with the shorter-term trend reading at 90, indicating that in most years the bulk of the downside in VIX has come through a persistent grind rather than a single air pocket. The typical path in the trend chart shows volatility often flaring early in the window, then fading as equity markets stabilize and hedging demand cools.
History does not guarantee future results; adverse excursions can be large even in winning windows, and the path of VIX inside the window has often been far more volatile than the final numbers suggest.
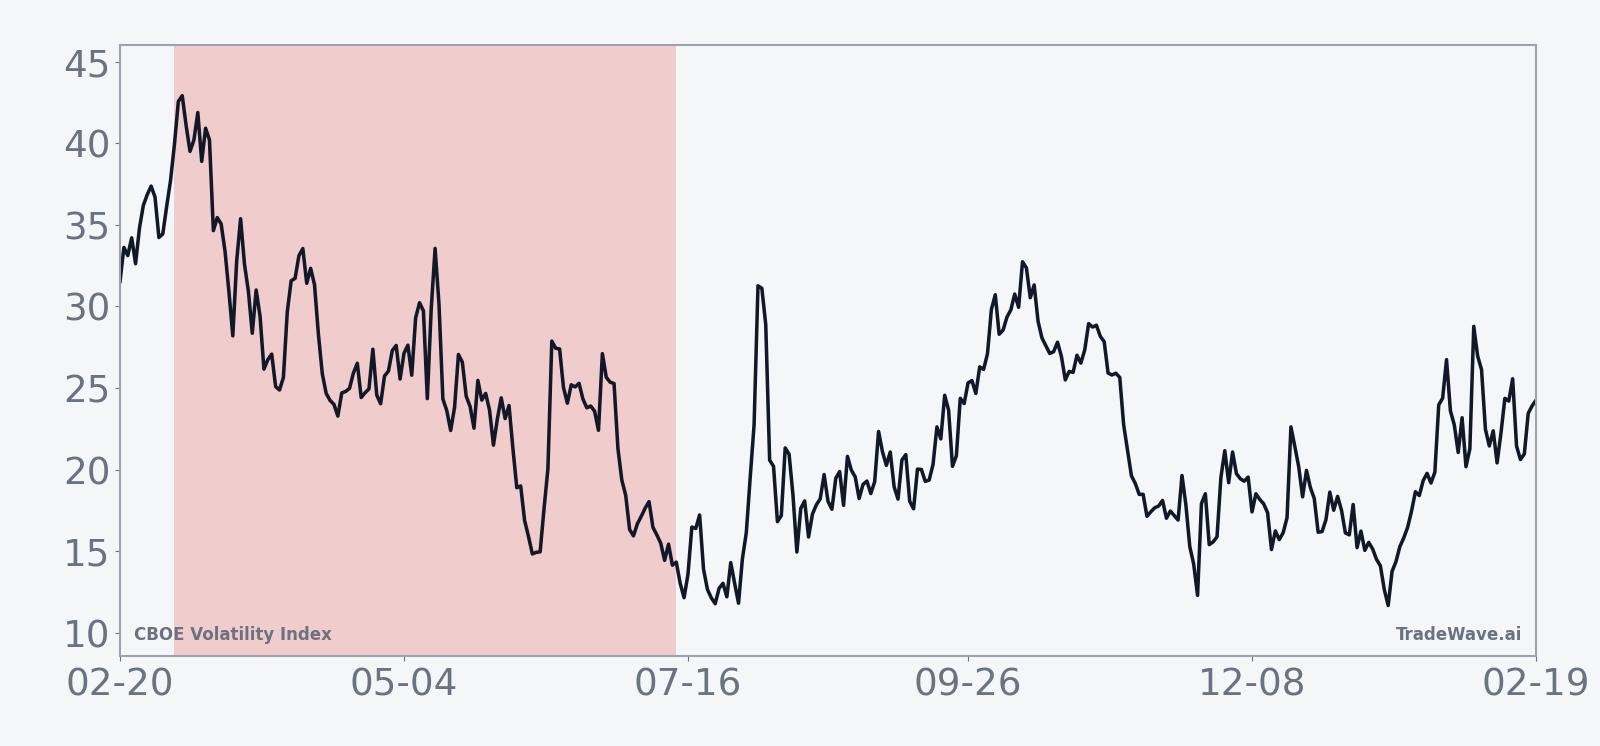
Price and near-term drivers
CBOE Volatility Index closed at 19.86, up 6.6% on the day, after trading between 18.77 and 21.74. That leaves VIX well off its 52-week high of 60.13 and about 48.4% above its 52-week low of 13.38, a middle-of-the-range level that still reflects some residual anxiety rather than outright complacency. In January 2026, analysts highlighted lingering policy and geopolitical risks and pointed to VIX call options as a relatively cheap form of protection against potential volatility spikes, underscoring that hedging demand can build even when the index is not at crisis levels.[1]
The chart below situates the latest move in its recent multi-month context.
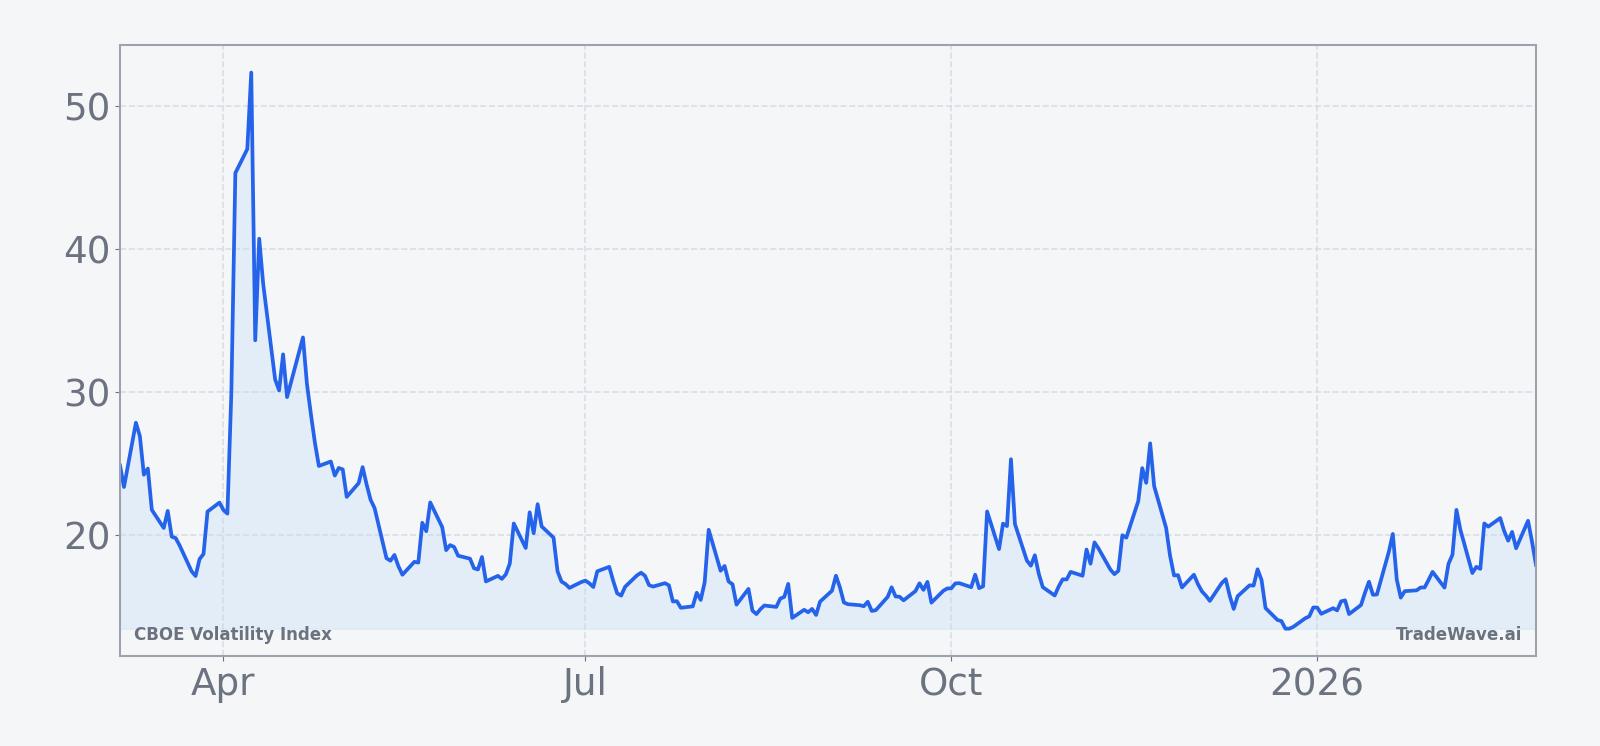
VIX’s behavior still tracks the familiar pattern: implied volatility tends to compress when equities are calm and well-supported, then spikes abruptly when risk-off episodes hit. In 2025, tariff anxiety and policy shocks repeatedly pushed the index toward or above 30, with one episode seeing the futures curve invert as investors scrambled for short-term hedges.[2] Those episodes show how quickly the index can jump from mid-teens or high-teens levels into stress territory when macro headlines turn.
Options positioning has often amplified those swings. In March 2025, Bloomberg reported huge volumes of call buying in March-expiry VIX strikes, with more than 260,000 contracts trading in the 55 to 75 range as equities slumped.[2] That kind of upside-focused flow can fuel sharp, self-reinforcing spikes in the index, even if the eventual path over the following months lines up with the historical tendency for volatility to fade.
Macro risk remains the wild card for this year’s window. Trade tensions, shifting tariff policies and uncertainty around central bank leadership all pushed VIX higher at various points in 2025, with closes above 40 described as rare and associated with major market events.[3][4][5] If similar shocks emerge in 2026, they could again produce large intraperiod rallies in volatility, even if the longer seasonal pattern ultimately reasserts itself.
What to watch as the window opens
The 130-day window starting Mar 6 has a clear track record: VIX has finished lower in every one of the past 10 iterations, and the short-volatility trade direction has been rewarded each time. The catch is the path. Historical maximum adverse excursions show that volatility spikes of 40% to more than 100% from the entry level have been part of the ride in several years, especially around macro shocks.
For equity traders, the key tell will be how VIX behaves on the next bout of stress. If a policy or growth scare sends the index sharply higher early in the window, the historical pattern suggests watching whether that spike is sold over subsequent weeks or whether elevated volatility persists into late summer. A fast reversal back toward the mid-teens would rhyme with prior years; a sustained stay above 30 would not.
Options flow is another important signal. In March 2025, the surge in deep out-of-the-money VIX call buying flagged intense demand for crash protection as equities slumped.[2] A repeat of that kind of concentrated upside activity, especially in near-dated strikes, would hint that institutional hedgers are bracing for a more durable volatility regime rather than a brief flare-up. Watching whether that flow builds or fades as the window progresses will help show whether this cycle is tracking the historical script.
Finally, keep an eye on the relationship between VIX and the broader equity tape. If stocks grind higher while VIX fails to make new lows, that divergence would suggest a different backdrop from prior years, where calm markets and falling implied volatility tended to reinforce each other. If instead equities stabilize and VIX resumes its typical spring–summer drift lower, the 10-for-10 seasonal record will be the context many volatility desks have in the back of their minds.
Sources
- [1] Bloomberg, "Market calm despite risks," Jan 13, 2026.
- [2] Bloomberg, "VIX Futures Curve Sends Distress Signal as Equities Slump," Mar 4, 2025.
- [3] Business Insider, "Inside the volatility-trading strategy one investor is using to capitalize on Trump market madness," Apr 29, 2025.
- [4] Bloomberg, "VIX Nears 30 First Time Since August Shock on Tariff Anxiety," Mar 10, 2025.