Holiday Week Rally Lifts Dow Jones Industrial Average (DJI) Toward Records Into Year-End
Dow Jones Industrial Average is hovering near record levels as it approaches a 276-day seasonal stretch that has delivered steady gains over the past decade, putting added focus on breadth, sector rotation, and macro risks.

Key takeaways
- Dow Jones Industrial Average is set to enter a 276-day seasonal window starting Mar 1 that has historically been strongly positive for long positions.
- Across the past 10 years, this window was profitable in 100% of cases, with 10 winners and 0 losers and an average gain of 9.82% per year.
- The pattern shows a long trade direction, with a TradeWave Ratio of 2.84 and a Sharpe ratio of 1.68, indicating historically favorable risk-adjusted returns.
- Intraperiod swings have been meaningful, with some years experiencing double-digit drawdowns even as the window ultimately finished higher.
- The upcoming regime arrives as the Dow trades just below record territory, following a series of record closes in early January that highlighted investor resilience despite geopolitical shocks.[7]
According to historical data from TradeWave.ai, the next several quarters line up with one of the Dow’s most consistently constructive seasonal regimes in the past decade. The following section looks at how that pattern has behaved and how it fits with today’s backdrop.
Seasonal window
This seasonal window begins on Mar 1, 2026 and spans 276 days. Historically, during this period, Dow Jones Industrial Average has shown a strong upside tendency for long positions, with gains in every year of the past decade. With the index last quoted at 49,499.20, up 0.03% on the day and trading just shy of its early January record close, the seasonal backdrop adds another layer to an already elevated market context.[7]
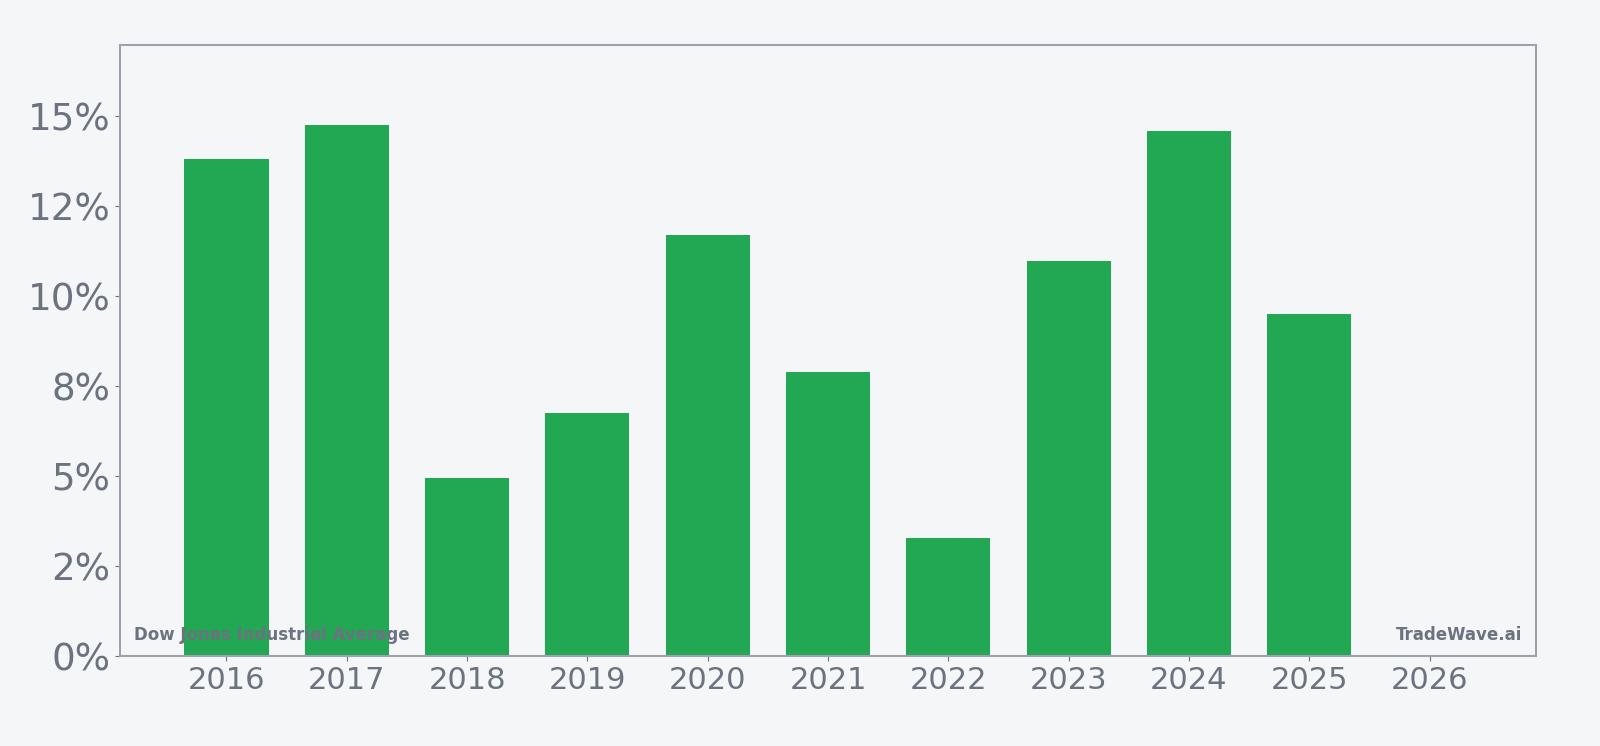
Across the 10-year sample, the trade direction is explicitly long, and every instance of this window finished with a positive net return. Percent Profitable stands at 100%, with 10 winners and 0 losers, and the average profit of 9.82% indicates that gains have typically been meaningful rather than marginal. The median profit of 10.23% is close to the average, which suggests that outcomes have clustered around a mid-to-high single-digit to low double-digit advance rather than being dominated by a single outlier year.
Looking at individual years, 2017 and 2024 stand out as some of the strongest examples, with net returns of 14.76% and 14.57% respectively, while 2018 and 2022 were comparatively softer at 4.95% and 3.30%. Even in those weaker years, the window still finished higher, which is consistent with the 100% win rate. The pattern’s annualized return of 9.75% and cumulative return of 153% over the decade underline how persistent this seasonal tailwind has been when viewed as a repeated regime.
Intraperiod swings, however, have not been trivial. The maximum favorable move, or peak run-up from entry, has often exceeded the final net gain, with years like 2021 showing a 15.95% best run-up against a 7.88% close-to-close return. On the downside, the maximum adverse move, or worst drawdown from entry, has occasionally been deep: 2020 saw a 31.79% intraperiod drop and 2022 experienced a 13.92% drawdown before the window ultimately recovered to finish positive. That combination of sizable peak gains and sometimes sharp interim losses is reflected in the TradeWave Ratio of 2.84 and a Sharpe ratio of 1.68, which together point to historically attractive but not low-volatility conditions.
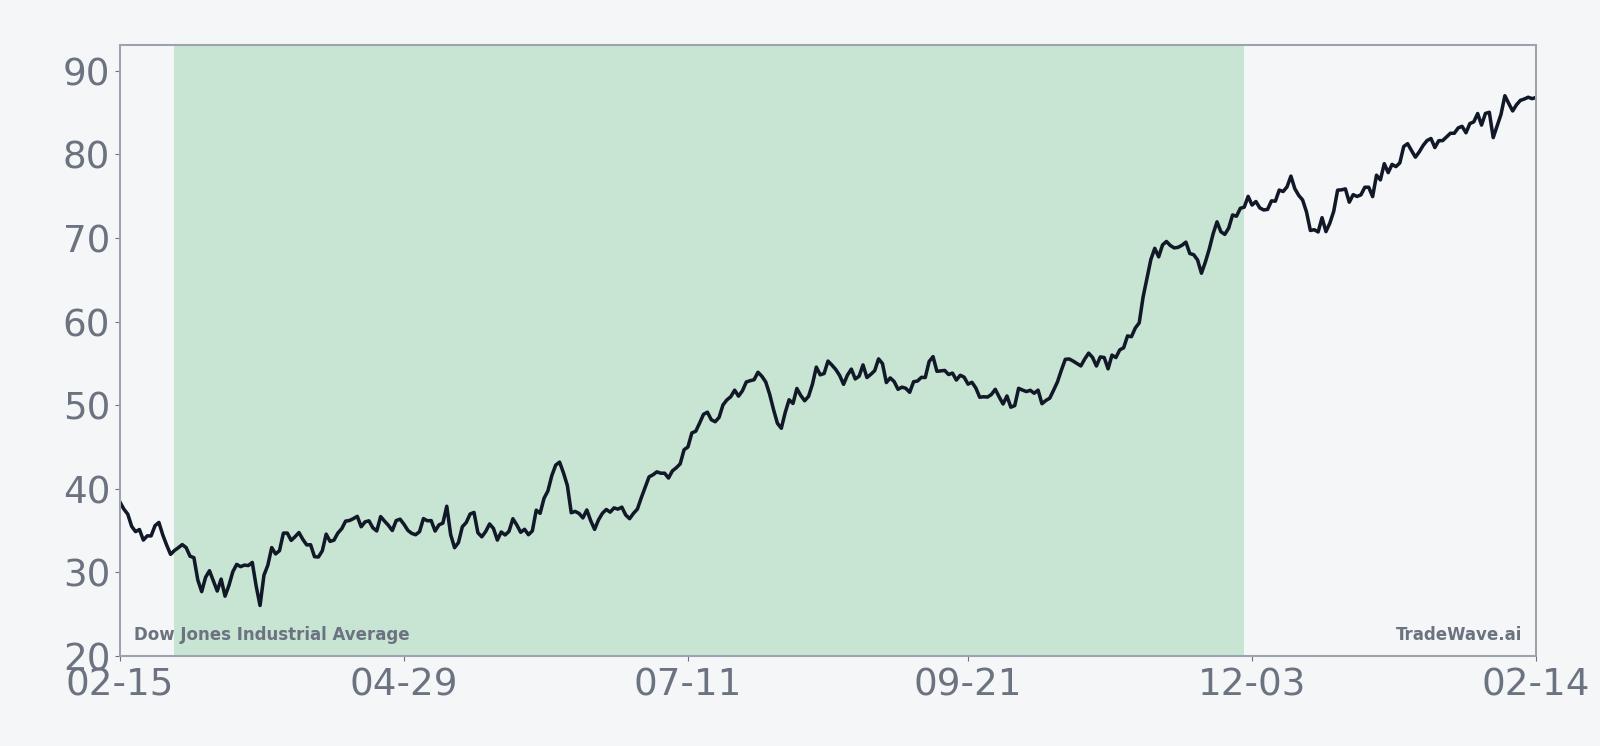
The 10-year average seasonal trend suggests that gains in this window tend to build gradually rather than arriving in a single burst. The typical path shows an early period of choppiness, followed by a more persistent climb as the window progresses, with cumulative returns tending to be highest toward the latter third of the regime. That shape is consistent with several individual years in which early drawdowns gave way to stronger finishes.
Year-by-year net returns and intraperiod swings highlight how upside and downside have historically coexisted within this window.
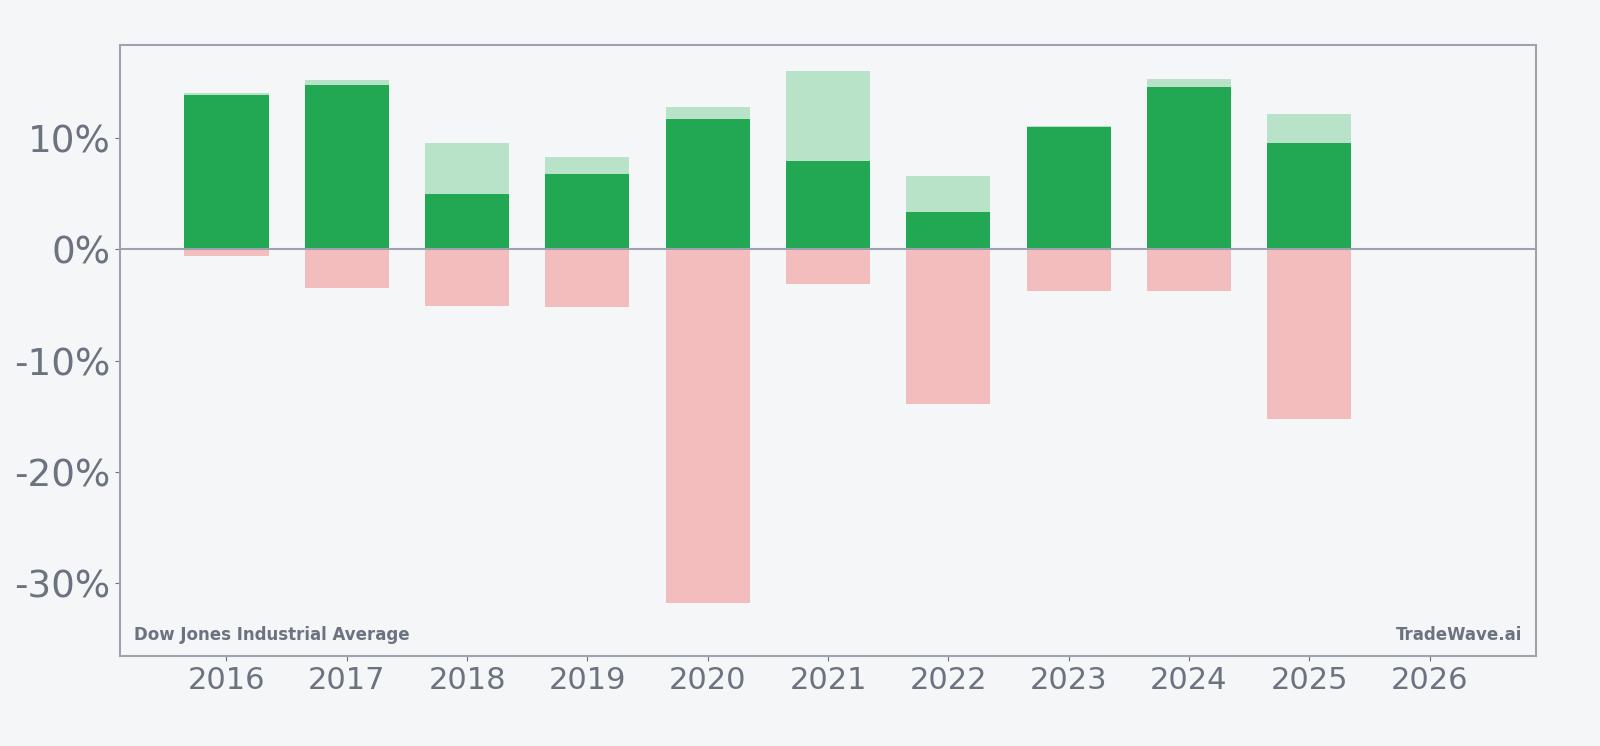
The combined net, peak favorable, and worst drawdown bars show that even in years with strong final gains, the Dow has often experienced notable setbacks along the way, particularly in 2020 and 2022. In other years, such as 2016, 2017, 2021, 2023, and 2024, the worst drawdowns were relatively contained while peak favorable moves tracked closely with the final result, indicating smoother advances. Taken together, the historical pattern defines the quantitative seasonal backdrop for the upcoming period.
History does not guarantee future results, and adverse excursions can be large even in winning windows.
Price and near-term drivers
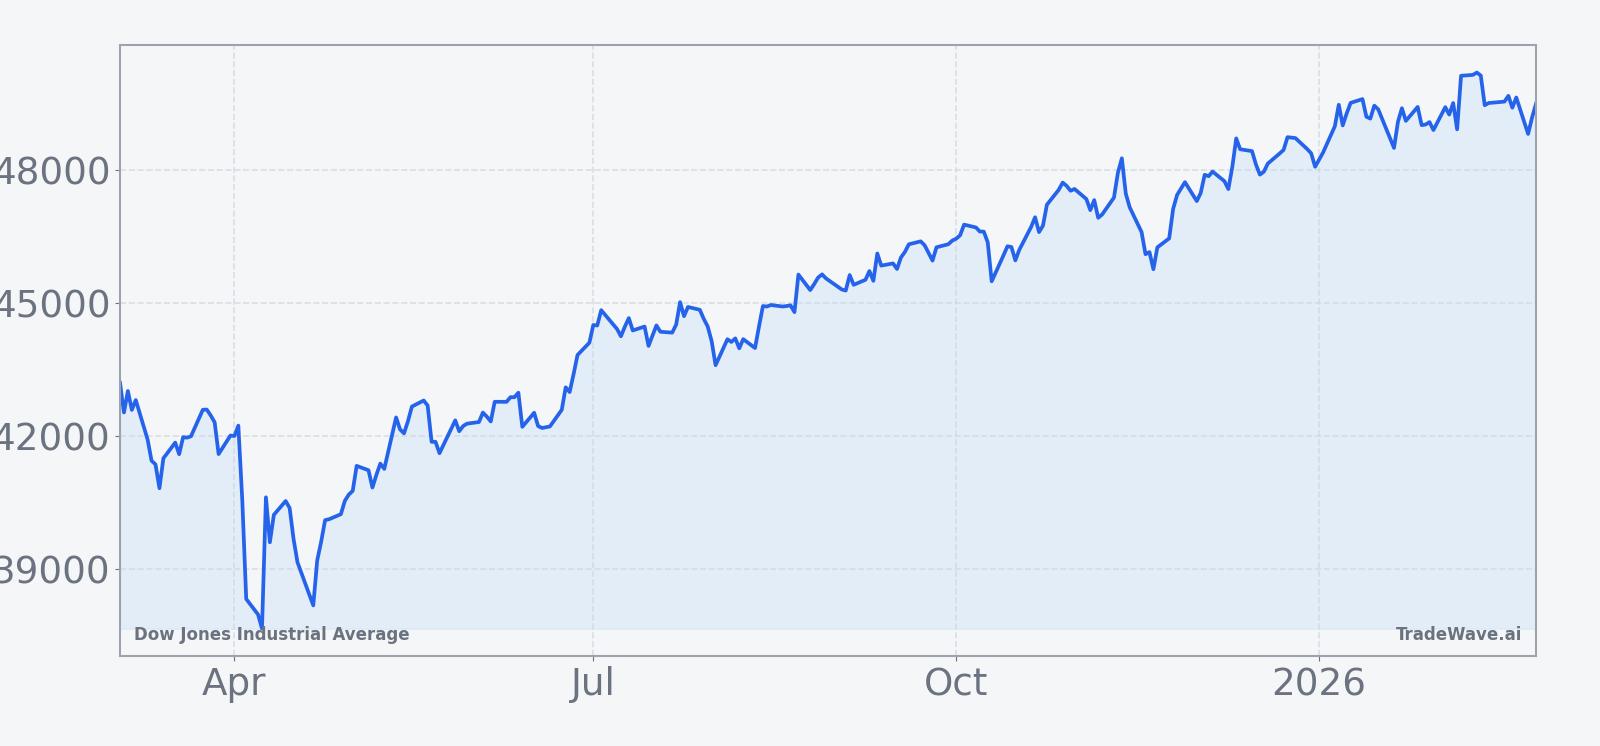
Dow Jones Industrial Average finished Thursday at 49,499.20, edging higher by 0.03% in a session that kept the index within sight of its record close set in early January, when it pushed to a new high despite a major U.S. military operation in Venezuela.[7] That resilience followed a late-2025 stretch in which the Dow repeatedly demonstrated its sensitivity to sector rotation and macro headlines, from technology weakness and rate-cut uncertainty in September to a pivot into healthcare and energy that helped drive a record high in November.[1][4]
In Sep 2025, struggling technology stocks and uncertainty around Federal Reserve rate decisions weighed on major indices, including the Dow, as investors questioned how quickly policymakers would move toward easing.[1] By Nov 11, 2025, the tone had shifted: a “banner day” for the Dow highlighted a rotation away from the narrow group of mega-cap winners in the S&P 500 and toward broader sectors such as healthcare, energy, and consumer staples, which helped lift the price-weighted index to a fresh record.[4] That rotation theme carried into the holiday period, when the Dow gained 0.47% during a holiday-shortened week in late December, supported by seasonal optimism and the traditional Santa Claus rally effect.[5]
Not every late-2025 move was benign. On Dec 9, 2025, a 4.7% slide in JPMorgan Chase shares, driven by higher-than-expected expense forecasts, dragged on the Dow and underscored how single-stock moves in heavyweight constituents can sway the index even when the broader market is more stable.[6] Yet by Jan 5, 2026, the Dow had again closed at a record, shrugging off geopolitical shock as U.S. forces captured Venezuelan President Nicolás Maduro, a reminder that macro and political surprises do not always translate into sustained equity weakness when underlying growth and policy expectations remain supportive.[7]
The chart below situates the latest move in its recent multi-month context.
Sector breadth and macro backdrop
The recent pattern of gains has been closely tied to shifts in sector leadership. When technology shares came under pressure in Sep 2025, the Dow’s performance lagged as investors reassessed the durability of growth and the timing of Federal Reserve rate cuts.[1] As the year progressed, leadership broadened: by November, flows into healthcare, energy, and consumer staples were helping the index outperform more growth-heavy benchmarks, reflecting a preference for cash-generative, dividend-paying names that tend to feature prominently in the Dow’s composition.[4]
Macro uncertainty remains a key variable. Concerns about economic instability and the risk of recession have periodically weighed on sentiment, even as the prospect of eventual rate cuts has been viewed as a longer-term positive for equities.[1] The episode in early January, when the Dow closed at a record despite a high-profile geopolitical operation, suggested that investors are willing to look through isolated shocks when they believe earnings and policy conditions can support higher valuations.[7] Heading into the new seasonal regime, the balance between those supportive forces and lingering macro risks will help determine whether the historical pattern of steady gains can reassert itself.
What to watch as the window opens
For investors tracking this 276-day window, several markers will be important. First, the way the Dow behaves in the early weeks of the regime will offer a test of the historical pattern, which has often featured some initial choppiness before more persistent gains. A shallow pullback followed by renewed strength would be consistent with the average seasonal path, while a deeper and more prolonged drawdown would echo years like 2020 and 2022, when intraperiod downside was significant even though the window ultimately finished higher.
Second, sector breadth and rotation will likely remain central. Continued leadership from healthcare, energy, and other value-oriented groups, alongside stabilization in technology, would support the idea of a broad-based advance similar to the late-2025 pivot that helped drive the Dow’s record high in November.[4] Conversely, a renewed concentration of gains in a narrow set of growth names, or renewed stress in key financial constituents like JPMorgan, could introduce more index-level volatility, as seen during the December 2025 bank-led pullback.[6]
Third, macro catalysts around Federal Reserve policy and growth expectations will shape how comfortable investors feel leaning into any seasonal tailwind. If upcoming data and Fed communications reduce uncertainty around the path of rates, that could reinforce the constructive historical backdrop highlighted by the seasonal statistics.[1] On the other hand, a resurgence of recession fears or a more hawkish policy stance could test the durability of the pattern, particularly given the history of sizable intraperiod drawdowns in some years.
Finally, traders may watch how the Dow responds to any new geopolitical or political shocks after its record-setting reaction to the Venezuela operation in early January.[7] A continued tendency to absorb such events without sustained damage would align with the historically resilient tone of this seasonal window, while a sharper or more persistent reaction would signal that the market’s risk tolerance has shifted. Together, these factors will determine whether the coming 276-day stretch rhymes with the past decade’s strong seasonal record or carves out a different path.
Sources
- Seeking Alpha: U.S. stocks fall as tech sector struggles, rate-cut uncertainties rattle markets (Sep 24, 2025)
- Seeking Alpha: Wall Street moves lower as investors digest retail earnings and Fed minutes (Aug 20, 2025)
- Seeking Alpha: Cantor Fitzgerald doesn’t believe in Wall Street’s reprieve rally (Mar 21, 2025)
- MarketWatch: Dow’s banner day points to investor pivot beyond S&P 500’s top winners (Nov 11, 2025)
- Seeking Alpha: Wall Street finished higher to kick off the holiday shortened trading week (Dec 22, 2025)
- The Wall Street Journal: JPMorgan’s Stock Slide Weighs on Dow Industrials (Dec 9, 2025)
- Barron's: These Stocks Moved the Most Today: Chevron, Valero Energy, Comcast, Tesla, CoreWeave, IBM, Coinbase, and More (Jan 5, 2026)