Gold
COMEX Gold futures are the world's most liquid gold contract. Gold serves as a store of value, inflation hedge, and safe-haven asset during periods of geopolitical uncertainty.
The near-term seasonal picture for gold is mixed, but a striking divergence emerges at the 90-day horizon. Consecutive-year data projects a 9.07% gain to $5,190 with a 60% win rate, while midterm election years tell the opposite story, projecting an 11.98% decline to $4,189 with only a 50% win rate. That gap of roughly 21 percentage points is the sharpest tension in this dataset.
Gold's behavior in midterm years historically reflects political uncertainty driving short-term volatility before longer trends reassert themselves. The 30-day midterm projection actually shows a modest 2.06% gain, suggesting any near-term strength fades quickly. Traders should watch whether gold holds above $4,700 over the next 60 days, as a breakdown there would validate the midterm cycle's more bearish longer-term signal.
Seasonal Price Projections
Select a historical basis and projection horizon to see where seasonal patterns suggest Gold may be headed.
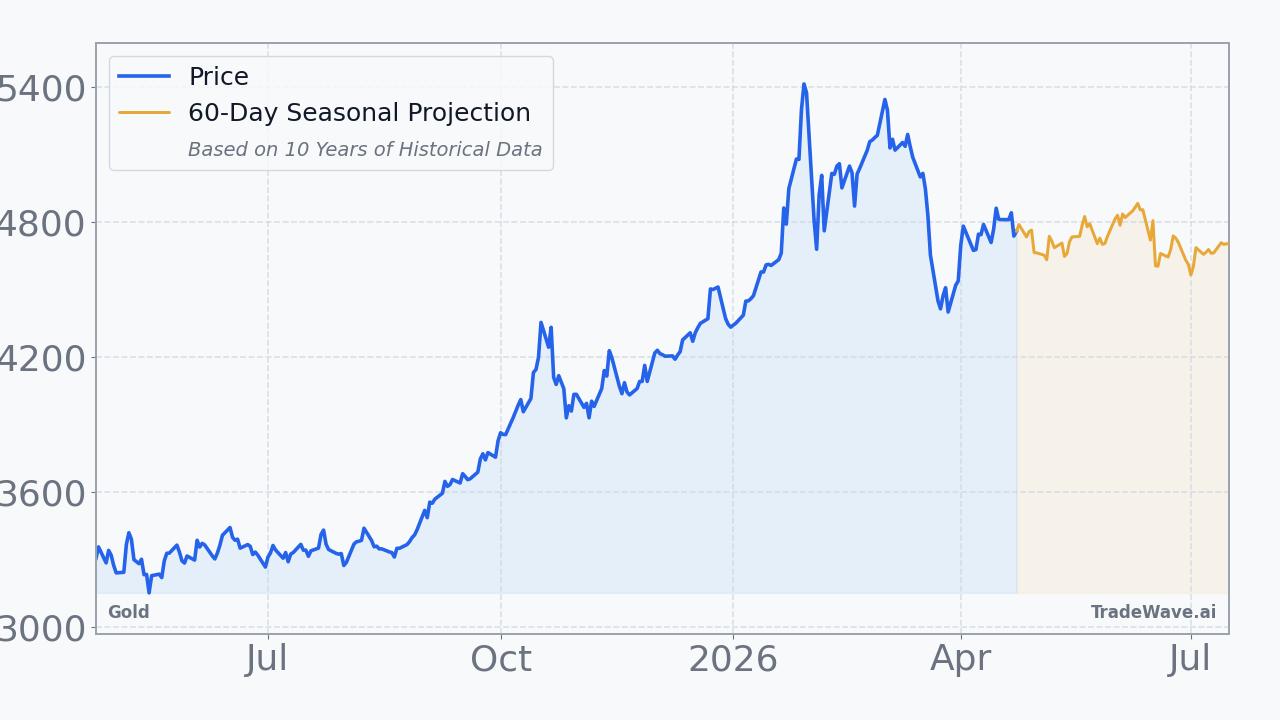
Projection as of Apr 24, 2026 from closing price $4,710.00
How to Use This Data
Seasonal projection data for Gold shows how the commodity has historically performed during this specific calendar window across comparable years. The consecutive pattern reflects a 60.0% win rate, meaning Gold finished higher in 60 out of every 100 similar periods. The midterm election year pattern shows a 50.0% win rate, essentially a coin flip historically.
When both bases point in the same direction, as they do here, the signal carries more consistency than when they diverge. Notably, the median return is often more informative than the average because it is less distorted by outlier years where Gold moved sharply in either direction, as seen in the range between the best return of plus 10.9% and the worst of minus 4.9%.
Seasonal patterns cannot account for sudden geopolitical developments, central bank policy shifts, currency moves, or macroeconomic surprises that frequently drive commodity prices. A 60.0% win rate still implies a 40.0% historical loss rate, and no statistical tendency guarantees an outcome in any individual year.
Market participants often use seasonal data as one layer of context alongside technical analysis, macroeconomic conditions, and portfolio risk parameters. It can help frame expectations about historical tendencies during a given period, but it functions as background information rather than a standalone signal.
This information is provided for educational purposes only and does not constitute financial advice, a recommendation, or a solicitation to buy or sell any security. Seasonal patterns are based on historical data and do not guarantee future performance. All investment decisions carry risk. Consult a qualified financial advisor before making investment decisions.
Understanding Seasonal Projections
Seasonal projections estimate future price movement based on how Gold has historically performed during the same calendar period. These are statistical baselines derived from decades of market data, not predictions.
Consecutive Years (Last 10)
Uses the most recent 10 years of data regardless of market regime. This captures the broadest recent behavior, including all economic and political environments. Over the next 60 trading days, this pattern has been positive 6 of 10 times with an average return of +0.4%.
Midterm Election Years (6 Available)
Uses only years that fall in the same position within the 4-year U.S. presidential election cycle. 2026 is a midterm election year. Markets often exhibit distinct patterns tied to fiscal and monetary policy shifts within this cycle. In 6 historical midterm election years, this 60-day window was positive 3 times with an average return of +0.2%.
Seasonal patterns reflect historical tendencies and do not guarantee future results. All projections are based on past performance and should be used as one input among many in your investment decision-making process. Data provided by TradeWave.ai.
Latest News
Recent headlines related to Gold, sourced from major financial news outlets with AI sentiment analysis.
- A Look At Discovery Silver’s Valuation As Porcupine Output Grows And Kidd Acquisition Progresses
- CIBC Maintains Outperformer Rating on Newmont (NEM)
- CIBC Maintains Outperformer Rating on Agnico Eagle Mines (AEM)
- Newmont tops Q1 estimates as record cash flow drives buyback boost
- Newmont Tops Earnings Expectations for Sixth Consecutive Quarter. What Gold Prices Mean for the Stock.
- Freeport-McMoRan Inc. Q1 2026 Earnings Call Summary
- SLV Is Up 145% in One Year. Is the iShares Silver Trust Still Worth Buying?
- Freeport-McMoRan Stock Falls After Earnings. Why the Miner Is Cutting Forecasts.
- Resolute Mining Q1 Earnings Call Highlights
- A Look At Artemis Gold (TSXV:ARTG) Valuation As Growth At Blackwater Drives Contrasting Signals
Explore More
Other markets with seasonal analysis and recent pattern articles.