Gold Market Correction Deepens as Gold (COMEX) (GC) Extends 8% Slide From Highs
Gold (COMEX) is moving through a historically strong 75-day post-election-year window just months after an autumn correction, putting fresh focus on how inflation, rates and policy risk could shape bullion’s next leg.

Key takeaways
- Gold (COMEX) is currently in a 75-day seasonal window that begins Dec 21 and has historically been a strong stretch in the year after the presidential election.
- The pattern has a long trade direction, with 100% Percent Profitable across 7 winners and 0 losers in the election-cycle lookback.
- Avg Profit in those winning years is 7.31%, with a Cumulative Return of 63% and a Sharpe ratio of 1.44, indicating historically favorable risk-adjusted outcomes.
- The TradeWave Ratio of 1.88 suggests that price has typically traveled meaningfully in the trade direction within the window, even beyond the final closing gain.
- Historical maximum favorable moves have often been sizable, but adverse excursions within the window have still appeared in some years, underscoring the need to respect drawdown risk.
- The window unfolds as markets conclude the year after the presidential election and edge toward the midterm year, when policy debates and fiscal choices can shift the macro backdrop for gold.
According to historical data from TradeWave.ai, this late-year stretch in the election cycle has shown a distinct pattern for Gold (COMEX). The following section looks at how that behavior has played out in prior years and what it implies for the current window.
Seasonal window
Grouping years by where they fall in the presidential election cycle, this seasonal window begins on 2025-12-21 and spans 75 days, and it has historically been a strong period for Gold (COMEX) in the year after the presidential election. That timing matters because the market is concluding the year after the presidential election and will soon transition into the midterm election year, when debates over fiscal policy, regulation and geopolitical risk can alter the demand for perceived safe havens like gold.
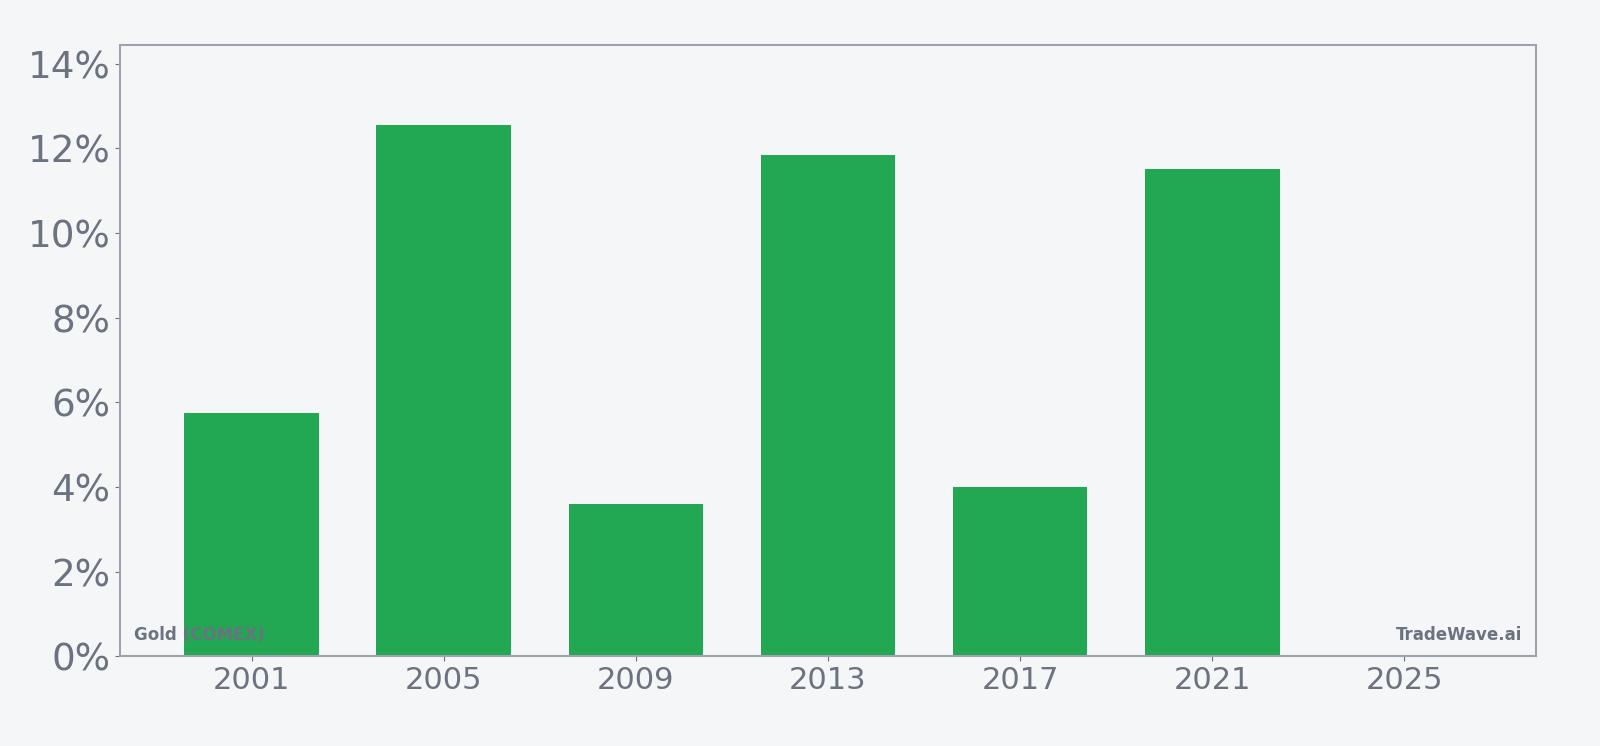
Historically, the trade direction for this pattern is long, and every year in the election-cycle sample has finished the window with a gain, producing 100% Percent Profitable with 7 winners and 0 losers. Average profit across those winning years is 7.31%, with a median outcome of 5.76% and a Cumulative Return of 63%, while the Sharpe ratio of 1.44 points to a relatively strong risk-adjusted profile for this specific stretch.
The per-year breakdown shows that some windows have delivered double-digit gains, such as 2005 with a 12.56% net return and 2013 with 11.83%, while others like 2009 and 2017 were more modest but still positive at 3.6% and 4.01% respectively. Even in the strongest years, the path was not perfectly smooth: for example, 2009 saw a worst intraperiod drawdown of about -4.58% from entry before finishing higher, while 2005 experienced a maximum favorable move of 16.69% with only a small adverse excursion of 0.2%.
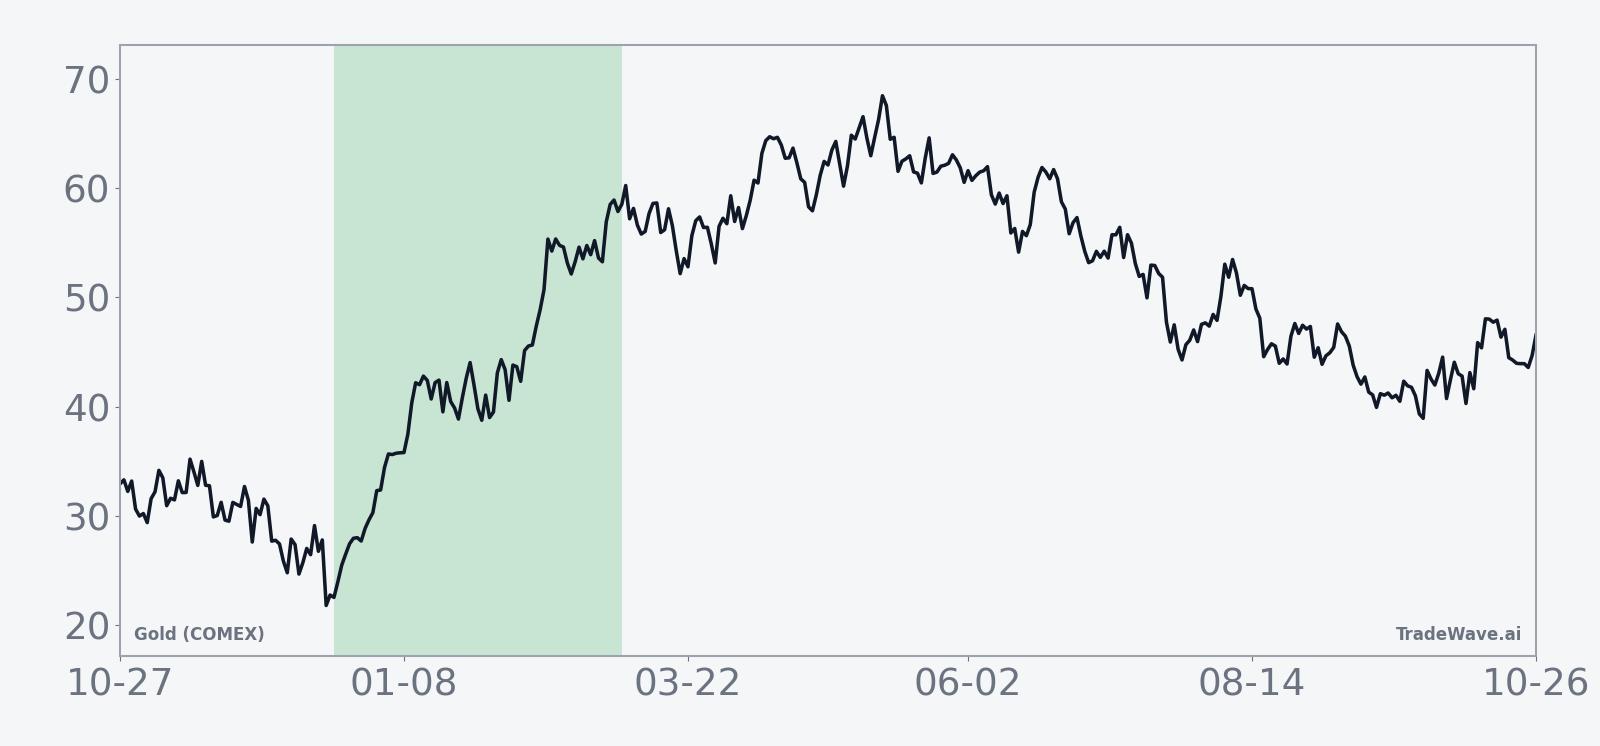
The historical seasonal average trend suggests that gains in this window tend to build steadily rather than arriving in a single burst, with the pattern showing a generally upward-sloping path across the 75 days. That profile aligns with the long trade direction and the 100% winning record in the sample, indicating that in prior post-election years, gold has often benefited from a combination of early-year macro uncertainty and evolving policy expectations.
A closer look at yearly net results alongside peak run-ups and worst drawdowns highlights how upside and downside have interacted within this window.
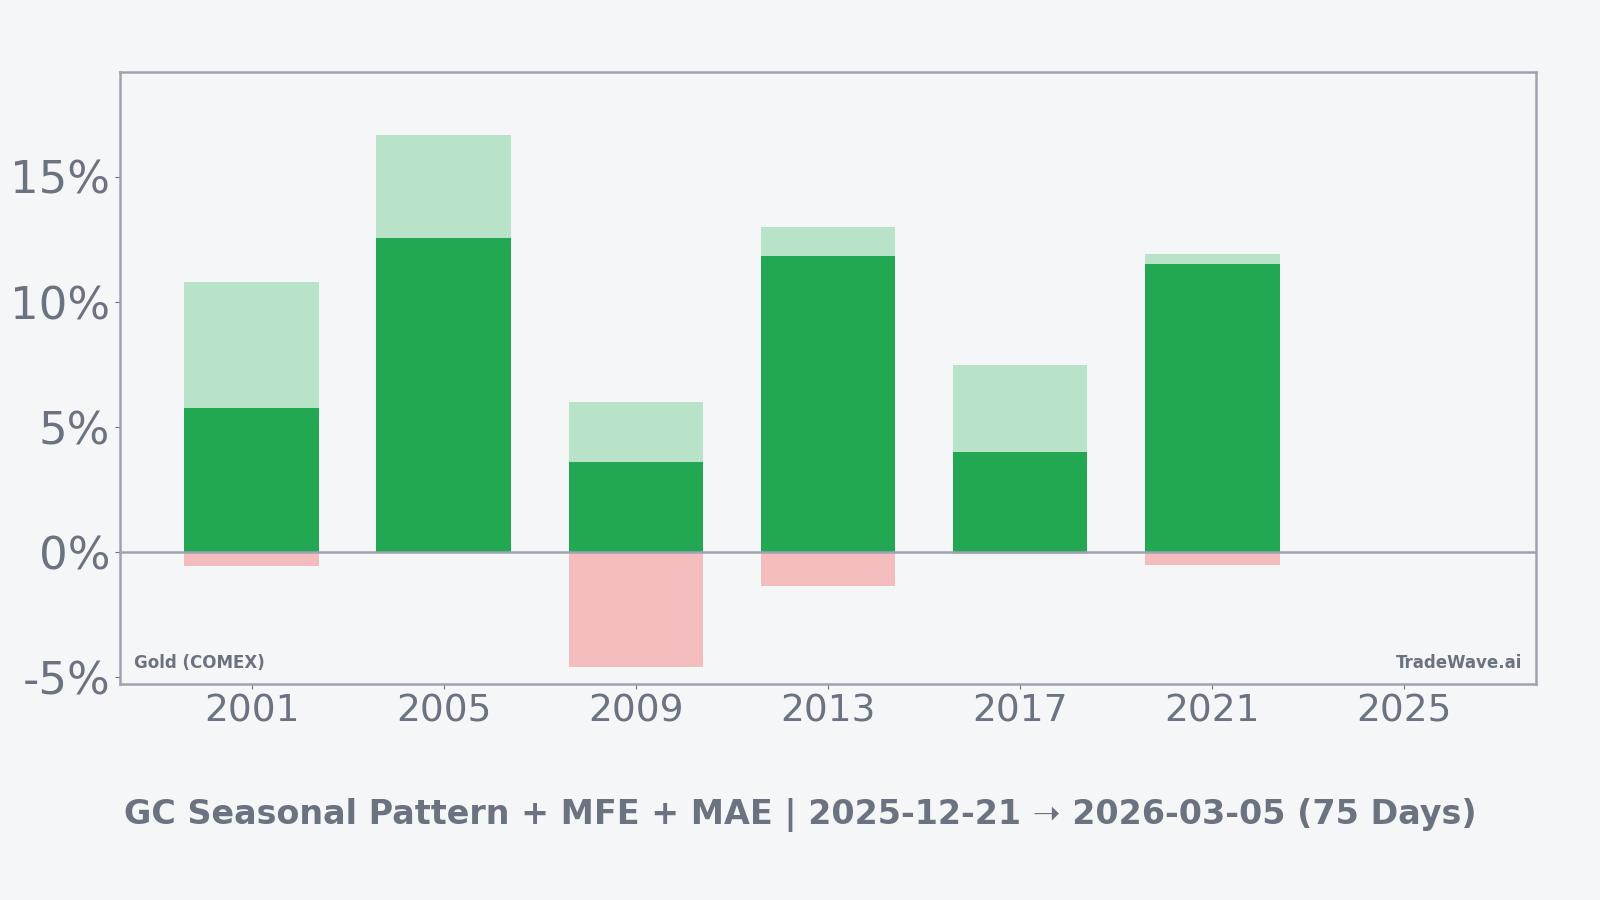
The combined net, maximum favorable move and maximum adverse move bars show that while the typical year has offered meaningful upside, intraperiod swings can still be significant, particularly in years like 2009 where the worst drawdown was several percentage points before the contract recovered. The TradeWave Ratio of 1.88 reinforces that price has usually traveled a substantial distance in the trade direction within the window, which can be attractive for trend followers but also means that volatility around the path has been non-trivial.
History does not guarantee future results; adverse excursions (MAE) can be large even in winning windows.
Price and near-term drivers
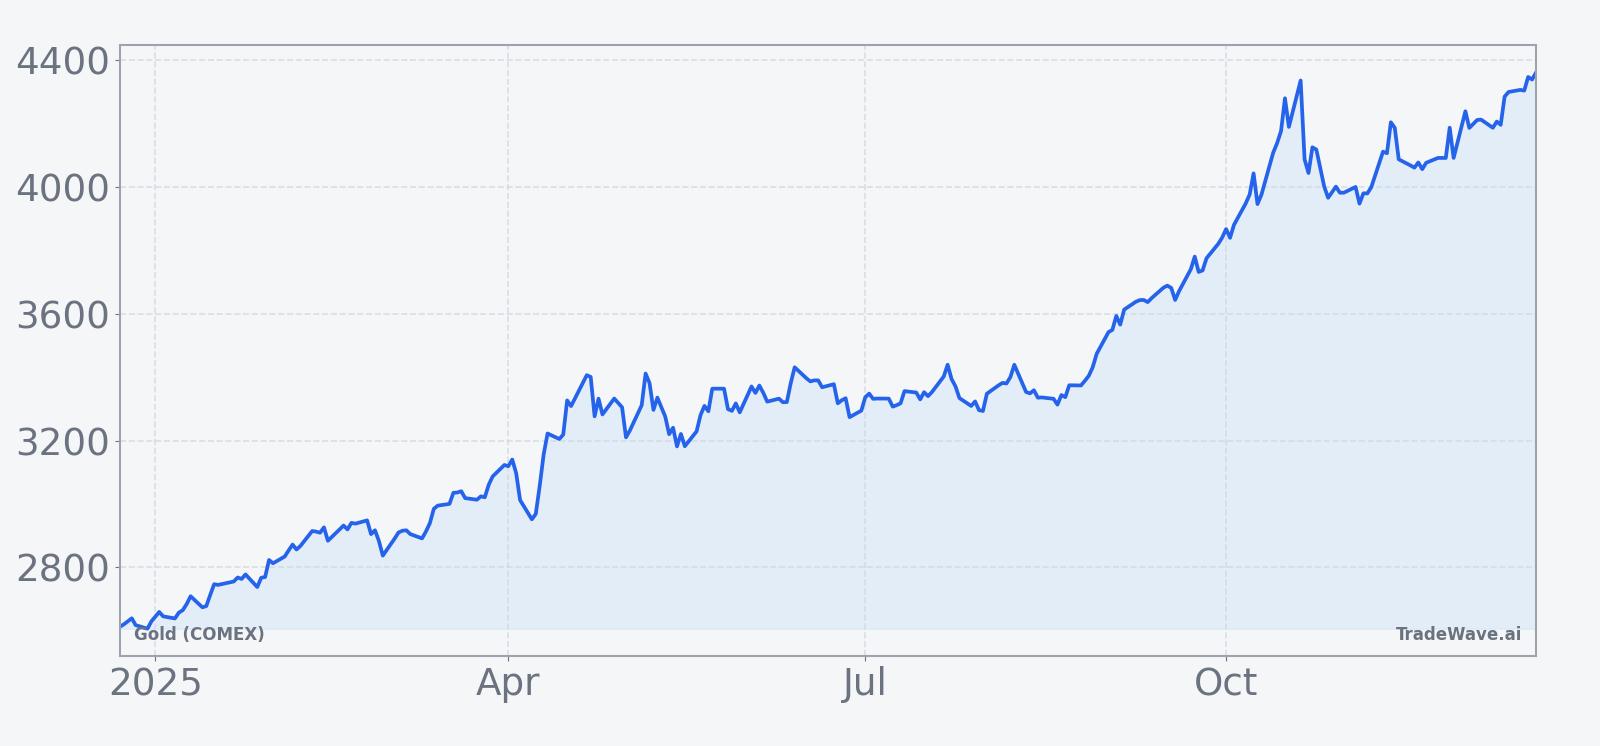
Gold futures spent much of the autumn in correction territory, with prices falling about 8% from recent highs in October as technical selling and profit-taking washed through the market.[6] That pullback came after a powerful run earlier in the year and coincided with a broader reassessment of inflation risks and interest-rate expectations, leaving bullion consolidating below its peak even as some analysts continued to highlight the potential for Comex contracts to eventually test resistance near $4,000 an ounce if bullish momentum resumes.[11]
Part of the October weakness reflected traders locking in gains after a strong advance, with heavy profit-taking also visible in related precious metals such as silver.[7] At the same time, macro narratives have remained supportive in the background, with concerns over political instability, fiscal deficits and the durability of disinflation keeping strategic interest in gold alive even as tactical flows turned more cautious.[6] That mix of long-term demand drivers and short-term position squaring has left the metal in a holding pattern as the new year approaches.
The chart below situates the latest move in its recent multi-month context.
Macro and election-cycle backdrop
The current window unfolds as markets wrap up the year after the presidential election, a phase that often features digestion of the prior year’s policy shifts rather than fresh mandates. For gold, that can translate into a tug-of-war between expectations for future fiscal and regulatory changes and the reality of how quickly new agendas are implemented, with investors weighing whether early promises will translate into concrete legislation or stall in Congress.
In this cycle, that debate is layered on top of questions about the path of real interest rates, the durability of the recent disinflation trend and the potential for renewed geopolitical shocks. Episodes of volatility in October, when gold’s bull run appeared to pause, underscored how quickly sentiment can swing as traders reassess whether the metal is overextended or still offers protection against tail risks such as government shutdowns or policy missteps.[6][13]
Looking ahead to the midterm election year, the policy calendar typically becomes more contentious, with spending priorities, tax debates and regulatory proposals moving to the forefront. For gold, that environment has historically coincided with periods of heightened demand when investors seek hedges against political uncertainty, although the exact timing and magnitude of those flows can vary from cycle to cycle.
What to watch
For this 75-day window, traders and investors will be watching how gold behaves relative to its historical pattern as the market transitions from the year after the presidential election into the midterm year. One focus will be whether prices can build on the seasonal tendency for steady gains, particularly if macro data or central-bank commentary revive concerns about inflation or real-rate trajectories.
Another key item is how the market responds to any renewed bouts of volatility tied to fiscal negotiations, geopolitical headlines or shifts in risk appetite, especially after October’s correction highlighted the impact of concentrated profit-taking.[6][7] Sustained buying on dips and a willingness to hold positions through short-term drawdowns would be more consistent with the historical pattern, while repeated failures at resistance or deeper-than-usual intraperiod declines would suggest that this cycle is diverging from prior post-election-year behavior.
Finally, market participants will monitor positioning and cross-asset signals from related miners and precious-metals ETFs, where flows and options activity can offer early clues about whether institutional investors are leaning into or away from gold’s traditional role as a hedge.[5][10][11] Taken together, these factors will help determine whether the current window continues to resemble the historically strong seasonal backdrop or evolves into a more atypical chapter for the metal.
Sources
- [1] MarketBeat, “Kinross Gold (KGC) Expected to Announce Earnings on Wednesday,” Jul 26, 2025.
- [2] MarketBeat, “Baader Bank Aktiengesellschaft Has $770,000 Position in Kinross Gold Corporation,” Aug 1, 2025.
- [3] MarketBeat, “Deutsche Bank AG Acquires 359,461 Shares of Kinross Gold Corporation,” Aug 13, 2025.
- [4] Yahoo Finance, “AngloGold Ashanti and Halliburton highlighted as Zacks Bull and Bear of the Day,” Feb 3, 2025.
- [5] MarketBeat, “Goldbank Mining (CVE:GLB) Stock Price Down 1.1% - Here's Why,” Nov 9, 2025.
- [6] CNBC, “Gold and related stocks are falling for a second day. The metal is off 8% from high,” Oct 22, 2025.
- [7] Seeking Alpha, “Gold, silver slide on heavy profit-taking after Trump reassures on China,” Oct 17, 2025.
- [8] MarketBeat, “Argent Trust Co Invests $252,000 in Kinross Gold Corporation,” Aug 7, 2025.
- [9] MarketBeat, “Hussman Strategic Advisors Inc. Has $3.86 Million Holdings in Kinross Gold Corporation,” Jul 19, 2025.
- [10] MarketBeat, “Stock Traders Buy High Volume of AngloGold Ashanti Call Options (NYSE:AU),” Nov 27, 2025.
- [11] The Wall Street Journal, “Silver Could Emerge as Outperformer Amid Gold Surge,” Oct 6, 2025.
- [12] MarketBeat, “Modiv Industrial (NYSE:MDV) Posts Earnings Results, Beats Expectations By $0.17 EPS,” Mar 7, 2025.
- [13] CNBC, “Gold is suddenly going through a correction. Is the metal's bull run in danger?,” Oct 22, 2025.
- [14] GuruFocus, “Insider Sell: Bruce Brook Sells Shares of Newmont Corp (NEM),” Dec 4, 2025.