Costco (COST) Rallies After Q4 Earnings Beat Even as Same-Store Sales Growth Cools
Costco is heading into a late-year, historically soft 43-day stretch just as investors digest mixed earnings, inflation and tariff risks, and a supportive analyst backdrop in the year after the presidential election.

Key takeaways
- Costco is about to enter a 43-day seasonal window starting Dec. 28 that has historically favored downside moves for a short trade direction in the year after the presidential election.
- The pattern has been profitable in 89% of historical years, with 8 winners and 1 loser for the short setup, pointing to a consistent tendency for the stock to soften in this stretch.
- Average gains in winning years are 6.35% for the short trade, while the all-years average, including the lone losing year, is still a 5% move in the trade direction.
- Per-year data show that even the weakest outcome for the short pattern involved a sizable upside squeeze in 1989, underscoring that adverse moves can be sharp.
- The historical profile features a TradeWave Ratio of 1.4 and a Sharpe ratio of 0.76, suggesting meaningful travel in the trade direction with moderate risk-adjusted results.
- Investors will be weighing this seasonal backdrop against Costco’s recent mix of earnings beats and misses, ongoing inflation and tariff uncertainty, and a consensus Buy rating from Wall Street.[1][2][4][5][6][12]
According to historical data from TradeWave.ai, this upcoming stretch for Costco has behaved differently from a typical late-year rally phase in prior cycles, with a distinct short-side bias that stands out in the year after the presidential election.
Seasonal window
The seasonal window beginning on Dec 28, 2025 and spanning 43 days has historically been a weak stretch for Costco when grouped by years after a presidential election, with the pattern favoring a short trade direction. With the stock’s latest price sitting between its 52-week extremes and investors focused on how the post-holiday period will shape full-year results, this window arrives at a moment when sentiment can shift quickly. That combination of a late-cycle policy backdrop and a historically soft phase has often coincided with choppier trading conditions for large retailers.
Grouping the data by the presidential election cycle matters here because consumer spending, fiscal policy and tariff decisions often follow a repeatable rhythm across administrations. The year after the presidential election is typically a digestion phase in which new policies begin to bite, and for Costco this late-year window has historically aligned with a period of softer share performance as markets reassess growth and margin assumptions.
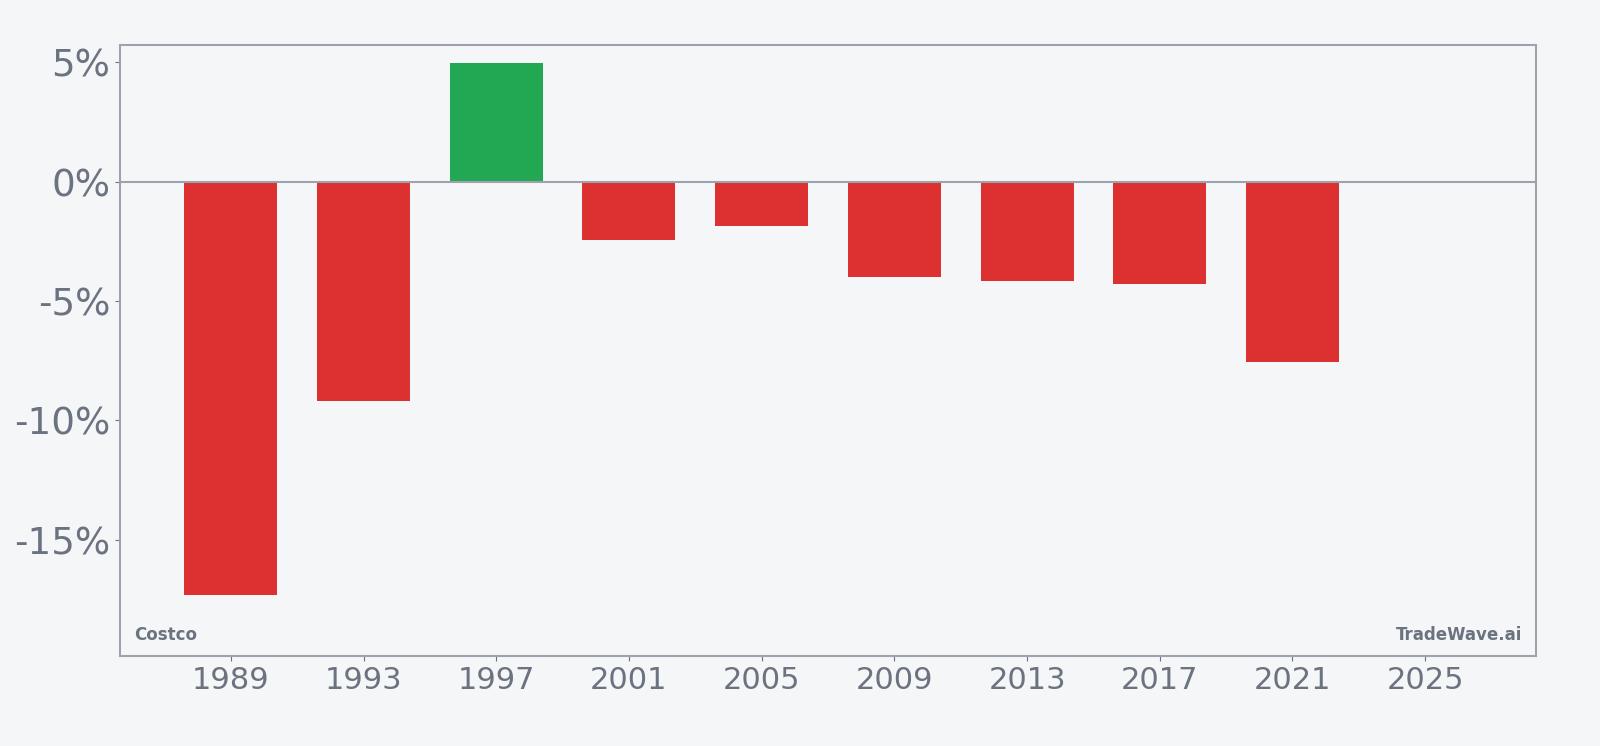
This seasonal window begins on Dec 28, 2025 and spans 43 days. Historically, during this period, Costco has shown a weak directional tendency that aligns with a short trade direction. The pattern has been profitable for the short side in 89% of the sampled years, with 8 winners and just 1 loser, indicating that in most years the stock has drifted lower over this stretch. Average profit in winning years is 6.35% for the short trade, while the average across all years, including the one losing outcome, is still a 5% move in the trade direction, suggesting that down years have not fully offset the typical seasonal softness.
Avg Profit reflects winners only, while Avg Profit - All includes every year in the sample. That distinction is important because it shows that even when the pattern has not worked perfectly, the overall tendency has still leaned in favor of the short direction. The median profit of 4.14% reinforces the idea that the typical outcome has been a moderate but meaningful decline over the 43-day span rather than an extreme outlier-driven result.
The historical volatility profile is captured by the TradeWave Ratio of 1.4 and a Sharpe ratio of 0.76. TradeWave Ratio (TWR) reflects how far price typically travels in the trade direction within the window, independent of the final close, while the Sharpe ratio measures risk-adjusted average return based on end-of-window outcomes. Together they suggest that Costco has often moved a fair distance in the short direction during this period, with risk-adjusted results that are solid but not extraordinary.
Looking at individual years, the strongest outcome for the short pattern came in 1989, when Costco fell 17.3% over the window, with a best intraperiod move of 4.32% in favor of the short and a worst drawdown of 18.38% against it. At the other end of the spectrum, 1997 was the weakest year for the short setup, with the stock rising 4.99% over the window and delivering a maximum favorable move of 10.72% for shorts before reversing into a loss and a relatively modest 1.32% adverse excursion. These examples highlight that even in a seasonally weak phase, sharp countertrend rallies can occur.
The historical trend chart for this pattern shows that weakness has tended to build gradually rather than all at once, with the average path tilting lower as the window progresses. In many years, early trading has been choppy, followed by more persistent downside later in the period as post-holiday data and early-year guidance begin to filter into expectations.
Yearly net and peak moves highlight how far Costco has typically traveled in both favorable and adverse directions within this window.
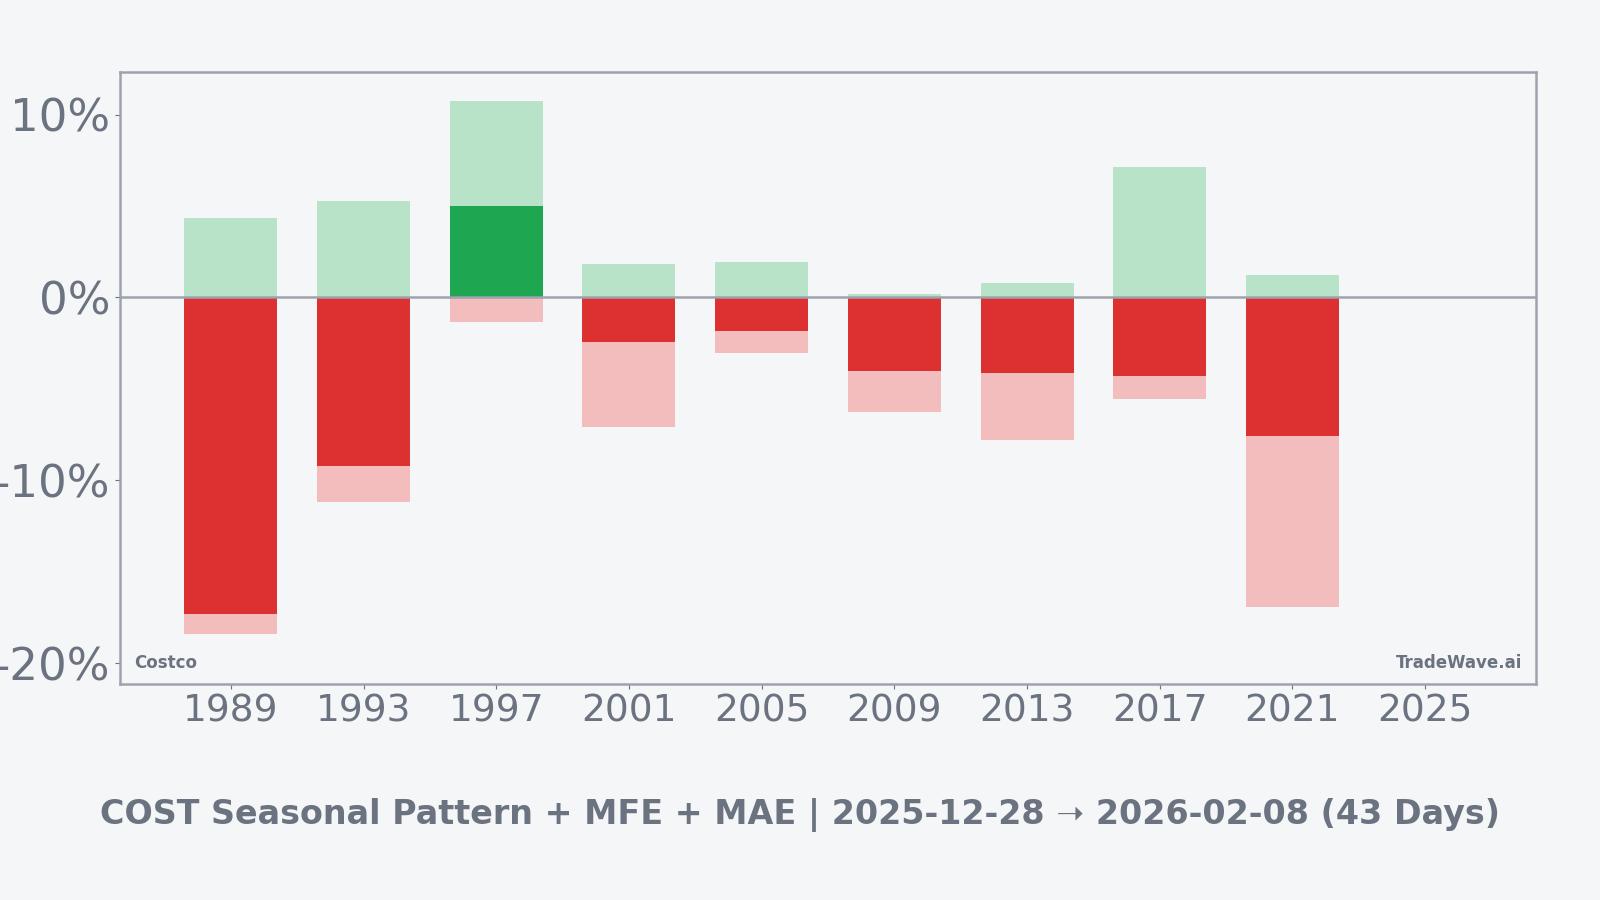
The combined net, maximum favorable excursion and maximum adverse excursion bars show that while many years delivered sizable moves in the short direction, intraperiod drawdowns against the trade could still be large, particularly in episodes like 1989 and 2021 where adverse excursions approached or exceeded mid-teens percentages. This mix of meaningful downside potential and occasional sharp squeezes underscores that the window has historically been directional but not low risk.
History does not guarantee future results, and adverse excursions can be large even in winning windows.
Taken together, the historical pattern defines the quantitative seasonal backdrop for the current period.
Price and near-term drivers
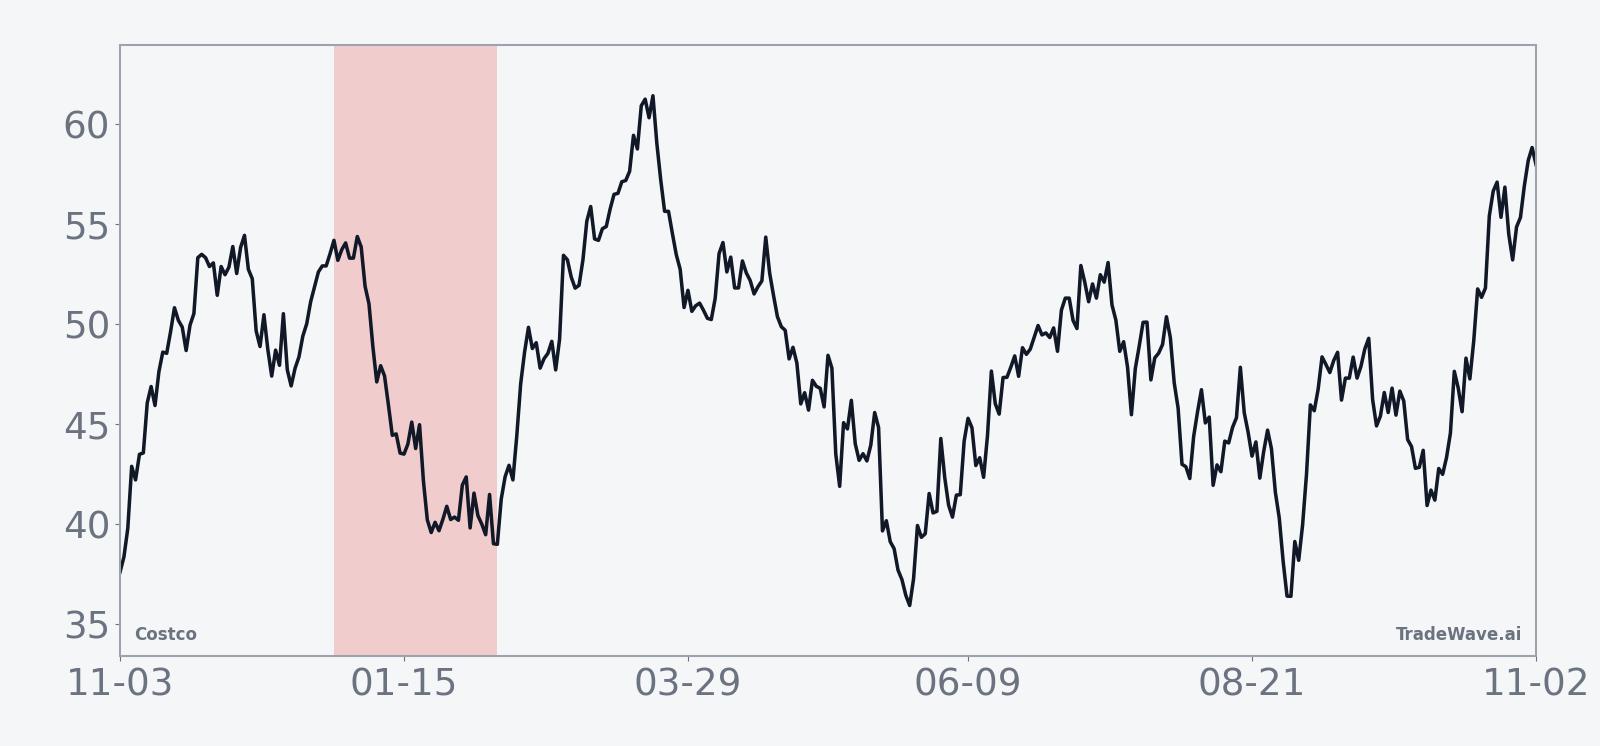
In the run-up to this window, Costco’s stock has been trading without a clear trend signal from price alone, leaving investors to lean more heavily on fundamentals and macro context. The company’s most recent quarter in September delivered a beat on both revenue and earnings, helped by a 14% jump in membership fees, although comparable-store sales growth slowed and left the stock reaction muted.[1][2][4]
Earlier in the year, Costco posted a quarterly profit that missed expectations, which briefly pressured the shares and reminded investors that even high-quality retailers are not immune to margin and demand headwinds.[6] Despite that wobble, the company has continued to outpace big-box rivals such as Walmart and Target in the U.S. market, supported by steady traffic and a loyal membership base.[3]
Macro conditions remain a key swing factor as the market concludes the year after the presidential election and looks ahead to the midterm election year. Inflation concerns and the prospect of new or higher tariffs have raised questions about how much of Costco’s cost pressures can be passed through to consumers without denting traffic, and whether discretionary categories could soften if real incomes come under renewed strain.[5][12] That policy backdrop is one reason election-cycle groupings can matter for retailers, since shifts in fiscal stance and trade policy often cluster in specific years of the cycle.
Analysts, for their part, remain broadly constructive. A consensus Buy rating and a roughly $1,075 price target from multiple firms compiled by CNBC reflect confidence in Costco’s long-term model, even if near-term earnings have occasionally underwhelmed.[1] Some commentators have warned that the stock’s valuation leaves little room for error and that a 30% pullback is not impossible if growth disappoints, which makes the interaction between rich expectations and a historically weak seasonal phase particularly relevant.[12]
The chart below situates the latest move in its recent multi-month context.

What to watch as the window opens
As the 43-day window beginning Dec. 28 gets underway, traders will be watching how Costco trades around key support and resistance levels established during the autumn rally and post-earnings consolidation. A pattern of lower highs and heavier selling on rallies within the window would be more consistent with the historical short-side bias, while a decisive breakout on strong volume would echo outlier years like 1997 when the pattern failed for shorts.
Macro and policy signals will also be in focus. Any concrete developments on tariffs, import costs or consumer-focused fiscal measures could quickly alter expectations for Costco’s traffic and margins, especially as the market transitions from the year after the presidential election into the midterm election year.[5][12] Softer inflation data or a more dovish policy tone could cushion the stock against the usual seasonal weakness, while renewed price pressures or trade frictions might amplify it.
On the company side, investors will monitor monthly sales updates, commentary from management appearances and any hints about membership trends or pricing power. Evidence that Costco is sustaining mid-single-digit same-store sales growth and continued strength in membership fees, similar to the latest reported quarter, would support the longer-term bullish thesis even if the stock experiences a choppy or weaker patch during the seasonal window.[1][2][4]
Ultimately, the upcoming period will test how a historically soft seasonal phase interacts with a still-favored retail leader operating in a complex macro environment. Whether Costco tracks its usual late-year pattern or diverges from it, the behavior of the stock through early February will offer clues about how investors are balancing valuation, policy risk and the company’s durable membership-driven model.
Sources
- [1] CNBC, "Costco's quarter failed to impress. But there was still a lot we liked" (Sep 26, 2025)
- [2] Seeking Alpha, "Costco beats on top- and bottom-line but comparable stores sales slow" (Sep 25, 2025)
- [3] Seeking Alpha, "Costco outpaces Walmart and Target again in the U.S." (May 29, 2025)
- [4] MarketWatch, "Costco’s stock slips despite profit beat, as same-store sales miss estimates again" (Sep 25, 2025)
- [5] Barron's, "Costco Earnings: What to Expect—and What Can Revive the Stock" (Dec 11, 2025)
- [6] Bloomberg, "Costco Posts Quarterly Profit That Misses Market Expectations" (Mar 6, 2025)
- [12] Forbes, "Can Costco Stock Sink 30%?" (Mar 12, 2025)