Construction and Housing Macro Clouds Shape Earnings Expectations for Watsco (WSO) into 2026
Watsco (WSO) is nearing a long seasonal stretch that has often favored the bulls, giving investors another lens to weigh alongside fundamentals and the next round of earnings.

Key takeaways
- Watsco’s upcoming seasonal window begins on Dec 31, 2025 and runs for 197 trading days, covering roughly the first three quarters of 2026.
- The pattern is long-biased, with Watsco posting a profit in 92% of years in this window, including 35 winners and 3 losers across 38 years of history.
- Average gains in winning years have been 21.01%, while the all-years average, including losing seasons, is still a robust 18%.
- Historical paths show sizable upside bursts, but adverse moves within the window have at times been sharp, underscoring the importance of managing drawdowns.
- The TradeWave Ratio of 1.72 and a Sharpe ratio of 1.0 point to a historically strong but not risk-free regime for long positions.
According to historical data from TradeWave.ai, Watsco’s behavior in this late-December through mid-year stretch has shown a distinct pattern over multiple decades. The following section unpacks that seasonal backdrop in detail, separate from any single year’s news flow.
Seasonal window
This seasonal window begins on Dec 31, 2025 and spans 197 trading days, and historically it has been a strong stretch for Watsco with a clear long-side bias. With the stock recently consolidating after a multi-year climb, the setup gives investors a structured way to think about how the next several months could differ from the recent tape.
TradeWave’s statistics classify this as a long pattern, meaning historical gains in this window have tended to come from being positioned on the upside rather than betting against the stock. Across 38 years of data, Watsco finished the window higher in 35 years and lower in only 3, so the 92% Percent Profitable figure reflects a long run of positive outcomes for bulls. Average gains in those winning years were 21.01%, while the Avg Profit - All measure, which blends both winners and losers, still comes in at 18%, indicating that the down years have not fully offset the stronger rallies.
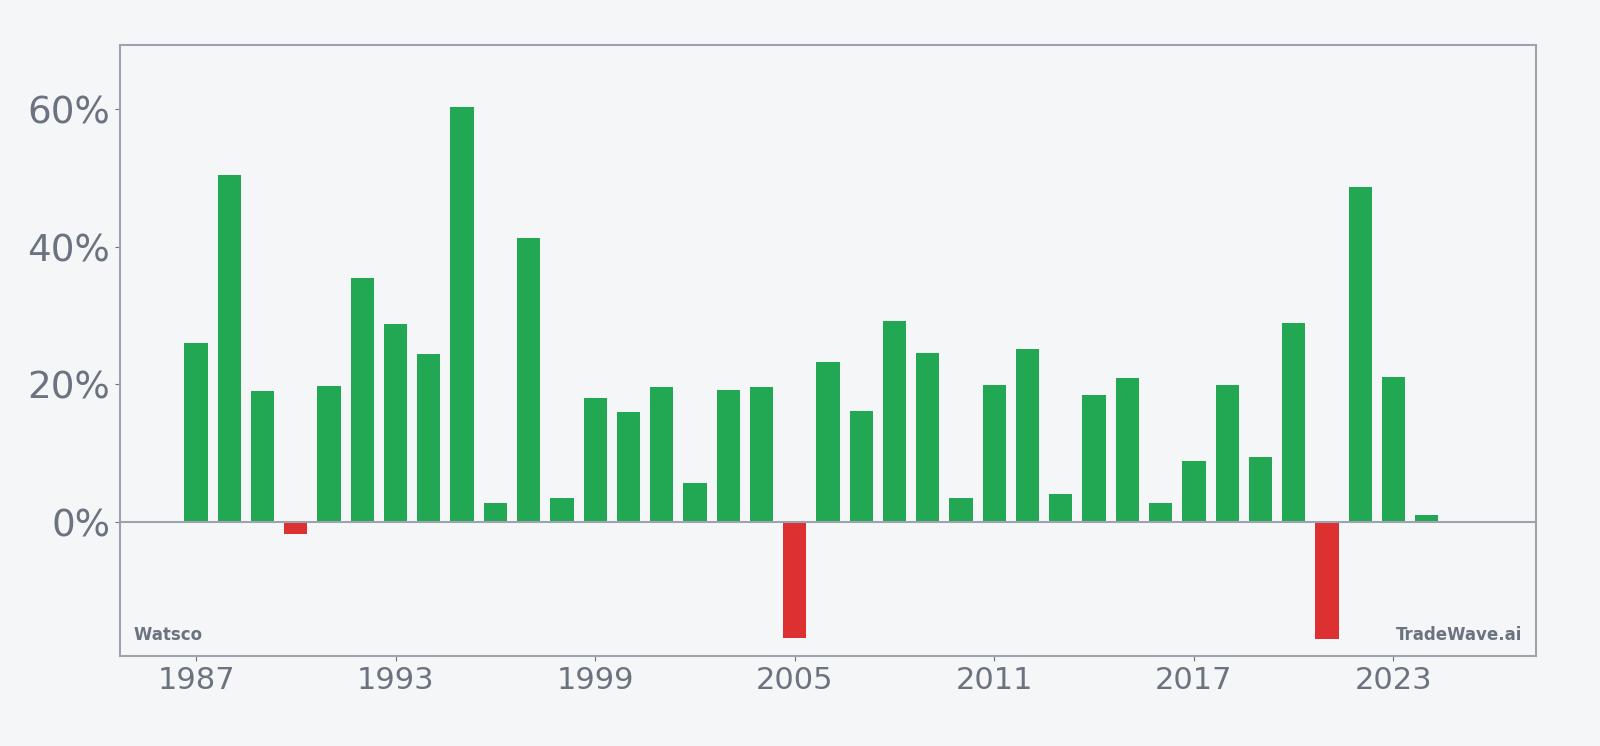
The distribution of individual years shows that not every season is a blockbuster, but the skew has leaned clearly positive. For example, 2022 stands out with a net return of 48.73% and a maximum favorable move of 52.84% from the entry, while 2016 was a much quieter winner with a 2.66% net gain and a 7.83% peak run-up. On the downside, 2021 was one of the rare losing years, with a net decline of 17.04% and a worst intraperiod drawdown of 28.47% from the starting point, underscoring that even in a historically strong window, sharp setbacks have occurred.

A combined view of net results, peak run-ups and worst drawdowns by year helps frame both upside potential and intraperiod risk.
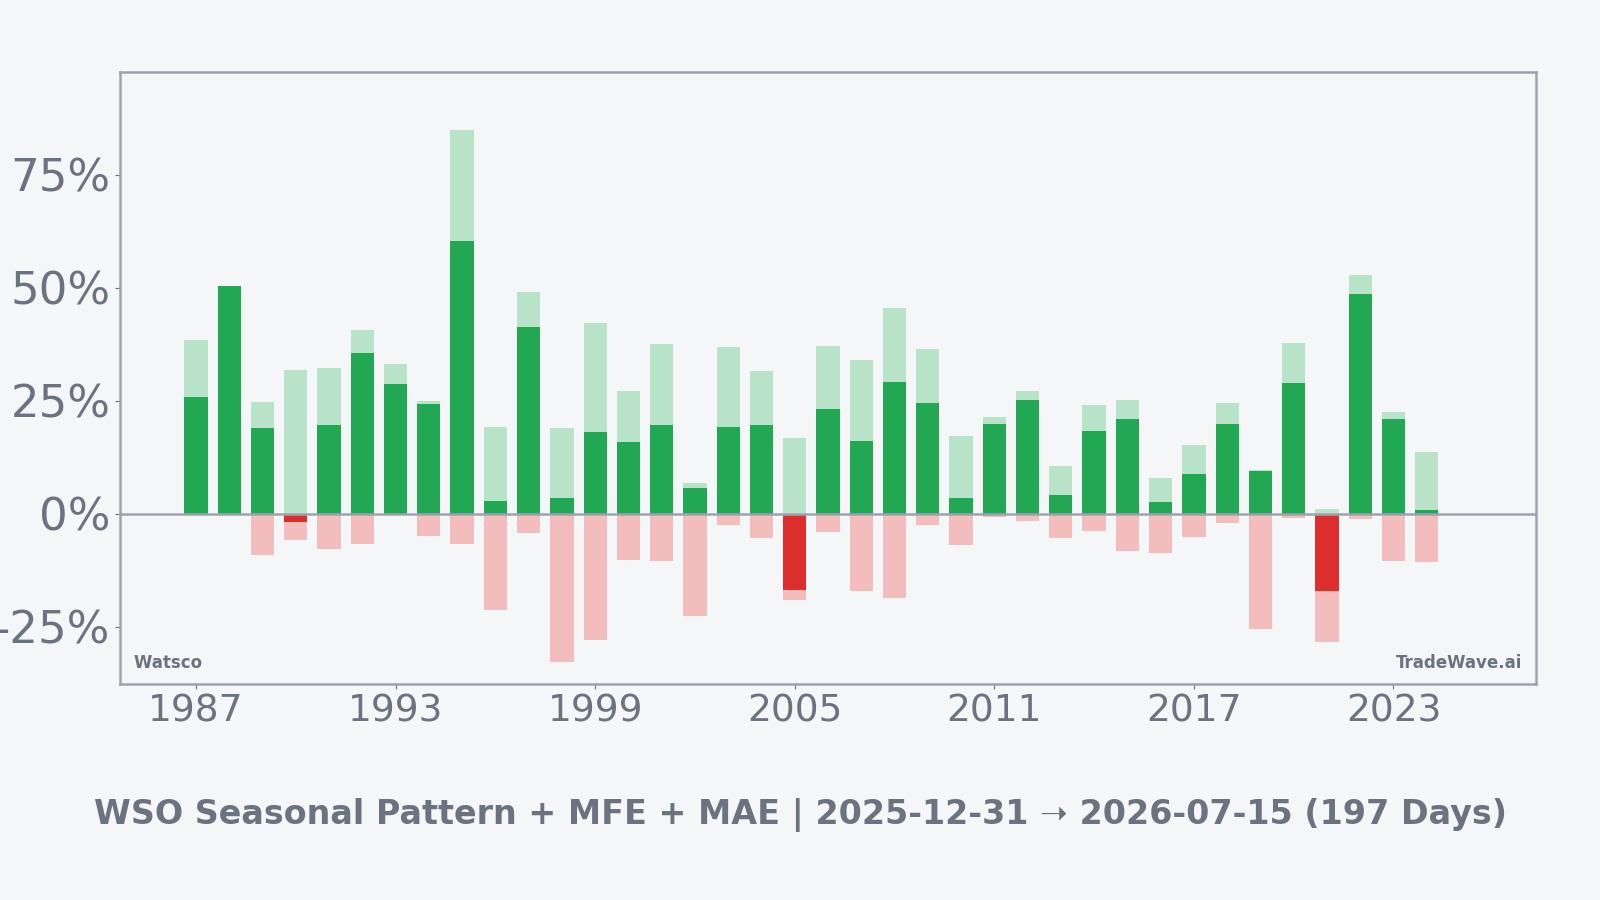
The bar chart that combines net results with maximum favorable and adverse excursions shows that in many years Watsco has traveled significantly in the trade direction before the window closes, consistent with a TradeWave Ratio of 1.72. In strong seasons such as 2020 and 2022, the maximum favorable move exceeded 35%, while the worst intraperiod drawdowns were relatively contained at around 1% to 2%, suggesting that rallies in those years were both powerful and relatively smooth. By contrast, 2019 and 2024 highlight that even some ultimately positive or flat years experienced double-digit adverse moves within the window, with worst drawdowns of 25.51% and 10.72% respectively, reminding investors that the path to a positive finish can still involve uncomfortable volatility.
The 38-year average trend line indicates that gains have tended to accrue gradually rather than in a single burst, with the typical pattern showing steady progress through much of the window. There is no clear bias toward all of the upside arriving early or late, which means that in prior years investors have often had multiple opportunities to participate in the move. Taken together, the historical pattern defines the quantitative seasonal backdrop for the current period.
History does not guarantee future results, and worst-case intraperiod drawdowns (MAE) have at times been large even in years that ultimately finished higher.
Price and near-term drivers
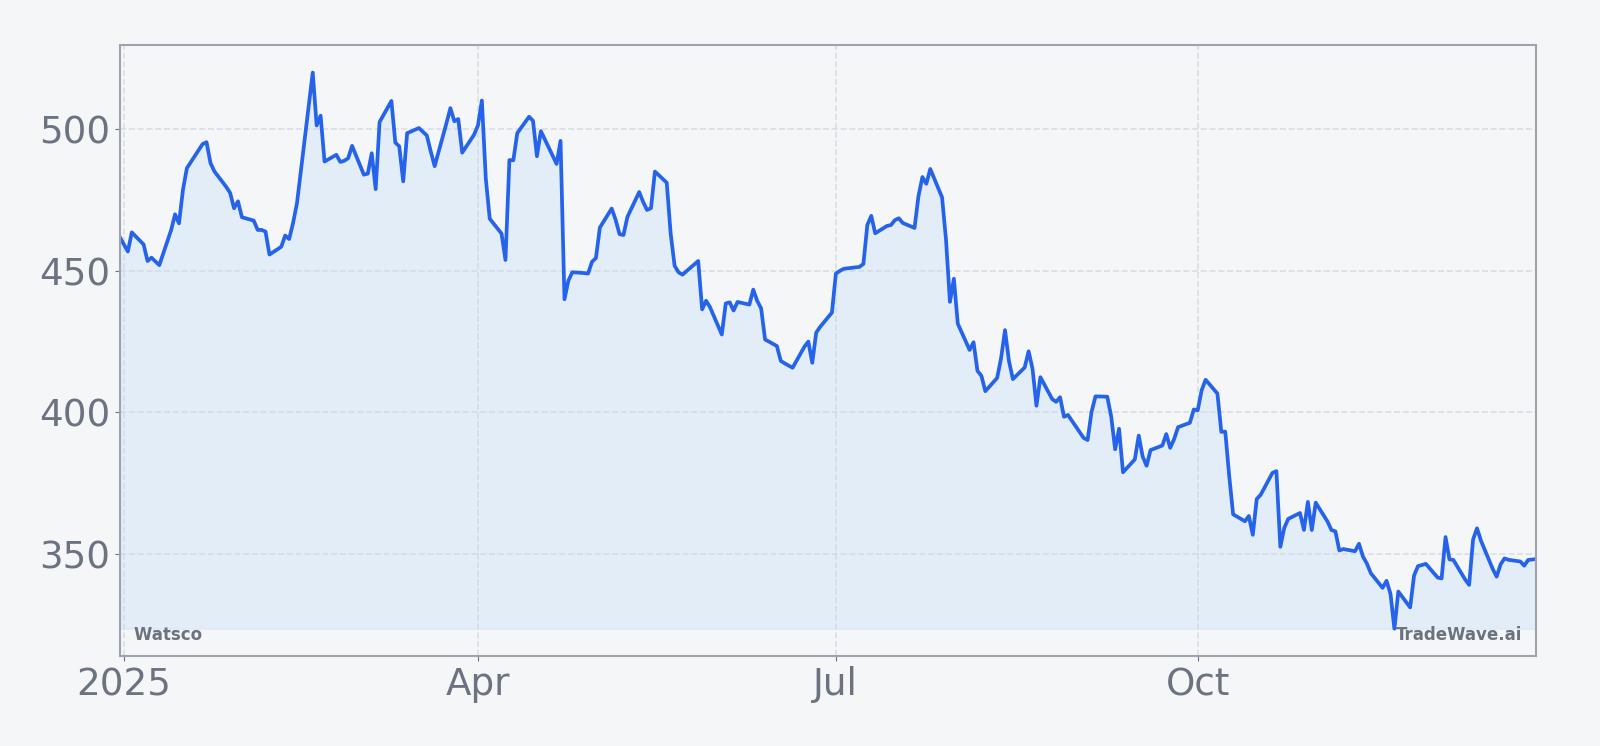
As Watsco approaches the start of this long seasonal window, the stock is coming off a period of consolidation after several strong years, leaving it in a relatively balanced position heading into 2026. With no fresh price data or 52-week range figures available in the latest dataset, investors are focusing instead on how the company’s fundamentals and sector backdrop might interact with the historical pattern.
On the corporate side, Watsco’s next earnings date has not yet been specified in the current research feed, but the company’s recent reporting cadence and sector peers suggest that the upcoming quarterly update will be a key checkpoint for how demand and margins are holding up. For comparison, Simpson Manufacturing, another building-products name, last reported results on Oct 27, 2025, with its update framed as a notable event for investor sentiment in that stock.[2] Analyst commentary around that report, including a positive forecast from Robert W. Baird, underscored how quickly expectations can shift in this part of the market when earnings surprise either way.[1]
Those cross-currents matter for Watsco because the seasonal window that begins on Dec 31 will overlap at least two earnings cycles, along with any macro developments that affect construction activity, interest rates and housing turnover. If sector peers continue to receive constructive analyst commentary and deliver solid results, that could reinforce the historically favorable seasonal backdrop. Conversely, any disappointment on volumes or pricing could test the pattern’s resilience, especially given the history of occasional double-digit drawdowns within otherwise positive years.
The chart below situates Watsco’s recent trading in its latest multi-month context.
What to watch as the window opens
With the 197-day seasonal window set to begin on Dec 31, investors will be watching how Watsco trades around the turn of the year and into its next earnings report. One focal point will be whether the stock can establish a pattern of higher highs and higher lows early in the window, consistent with the historical tendency for steady gains rather than a single, front-loaded spike.
Fundamentally, the next few quarters of earnings will be critical. Street expectations for peers such as Simpson Manufacturing have been shaped by recent results and analyst forecasts, including MarketBeat-tracked commentary that framed the outlook as constructive despite macro uncertainty.[1][2] For Watsco, similar signals around order trends, backlog and pricing power will help determine whether the company is entering this historically strong stretch with momentum or facing a more challenging backdrop.
From a risk perspective, traders may pay close attention to any early drawdowns once the window is underway, given that past seasons have occasionally seen adverse moves of 20% or more before recovering. A deeper-than-usual pullback that fails to attract buying interest would be one sign that the current year is diverging from the long-run pattern, while a contained dip followed by renewed strength would be more in line with the historical profile.
Finally, sector and macro headlines around construction activity, interest rates and housing demand will provide important context for how much weight to place on the seasonal tendency. If the stock responds positively to earnings and macro news while respecting key support levels, that behavior would align with the long-biased seasonal history. If, instead, negative catalysts overwhelm the pattern and Watsco breaks down through prior floors, it would be a reminder that even a strong seasonal backdrop is only one input in a broader investment mosaic.
Sources
- [1] MarketBeat, “Robert W. Baird Issues Positive Forecast for Simpson Manufacturing (NYSE:SSD) Stock Price,” Oct 29, 2025. View article
- [2] MarketBeat, “Simpson Manufacturing (NYSE:SSD) Issues Earnings Results,” Oct 28, 2025. View article