AI Data-Center Power Boom Lifts Outlook for Caterpillar (CAT) Energy Equipment
Caterpillar is closing out a robust year for the stock as it approaches a historically favorable post-election seasonal stretch that has often rewarded long positions, even as tariffs, AI-driven demand and softer guidance pull the outlook in different directions.
Key takeaways
- Caterpillar’s upcoming 106-day window starting Dec 31 has historically been a strong period for long positions in the year after the presidential election, with more winning years than losing ones.
- Across the sample, 82% of years in this window were profitable, with 9 winners and 2 losers, and winning years showed an average gain of 16.79% versus a 12% average when all years are included.
- The pattern’s Trade Direction is long, supported by a TradeWave Ratio of 1.48 and a Sharpe ratio of 0.8, pointing to a favorable but not risk-free risk‑reward profile.
- Historical maximum favorable moves inside the window have often been sizable, but adverse excursions have also been meaningful in weaker years, underscoring the need to respect drawdown risk.
- The window sits at the end of the year after the presidential election, a phase that often features policy digestion and shifting expectations for tariffs, infrastructure and industrial demand.
According to historical data from TradeWave.ai, this late-year stretch for Caterpillar has shown a distinct post-election pattern that differs from typical calendar-based seasonality. The following section looks at how that behavior has played out in prior cycles and what it implies for the backdrop as the new year begins.
Seasonal window
The upcoming seasonal window for Caterpillar begins on Dec 31, 2025 and spans 106 trading days, and in years after a presidential election it has historically been a strong stretch for long positions. The stock is heading into that regime after a powerful run in 2025, with shares up about 52% year to date, leaving investors weighing whether momentum can persist into the new policy phase.[1]
Grouping the data by the presidential election cycle rather than by simple calendar years matters for a company like Caterpillar because policy timing often drives its order book. Shifts in tariffs, infrastructure spending, energy regulation and tax policy tend to cluster around election and post-election years, so looking at “the year after the presidential election” as a distinct phase can capture recurring demand and cost patterns that a standard January-to-December view might miss.
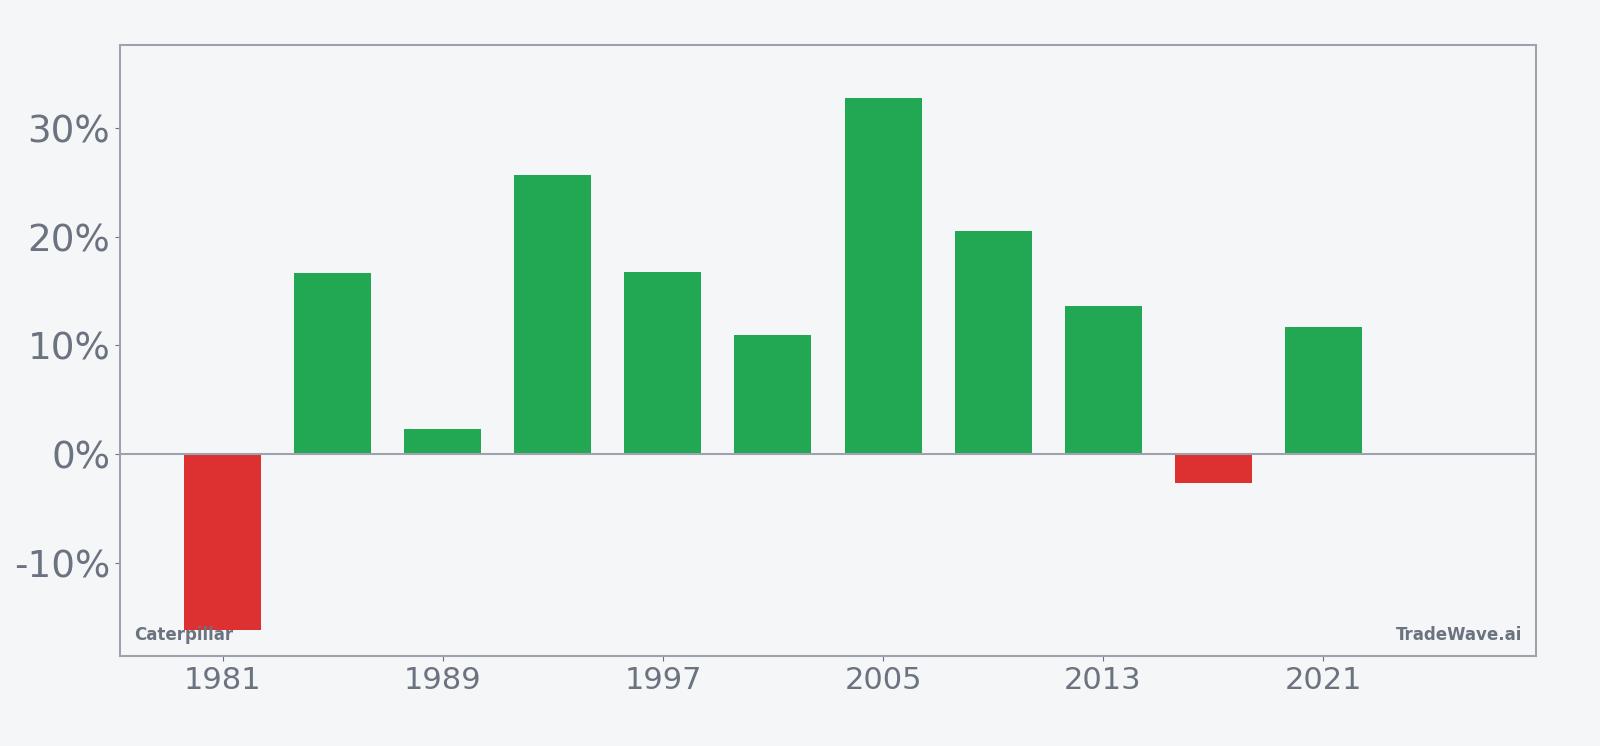
Historically, this 106-day window has favored the long side, with 82% of years ending profitably and 9 winners versus 2 losers. In winning years, Caterpillar has gained an average of 16.79% over the window, while including all years, the average outcome moderates to a still-solid 12%, reflecting the drag from the two losing instances. The median profit of 13.61% suggests that results have not been skewed by just one or two outlier years.
The per-year breakdown shows that some of the strongest performances came in 2005, with a net return of 32.79%, and 1993, with a 25.7% gain, both periods when industrial demand and global growth were supportive. On the weaker side, 2017 stands out as a losing year with a net decline of 2.67%, despite a maximum favorable move of 10.74% during the window, underscoring that even in a generally positive regime, rallies can reverse before the period ends.
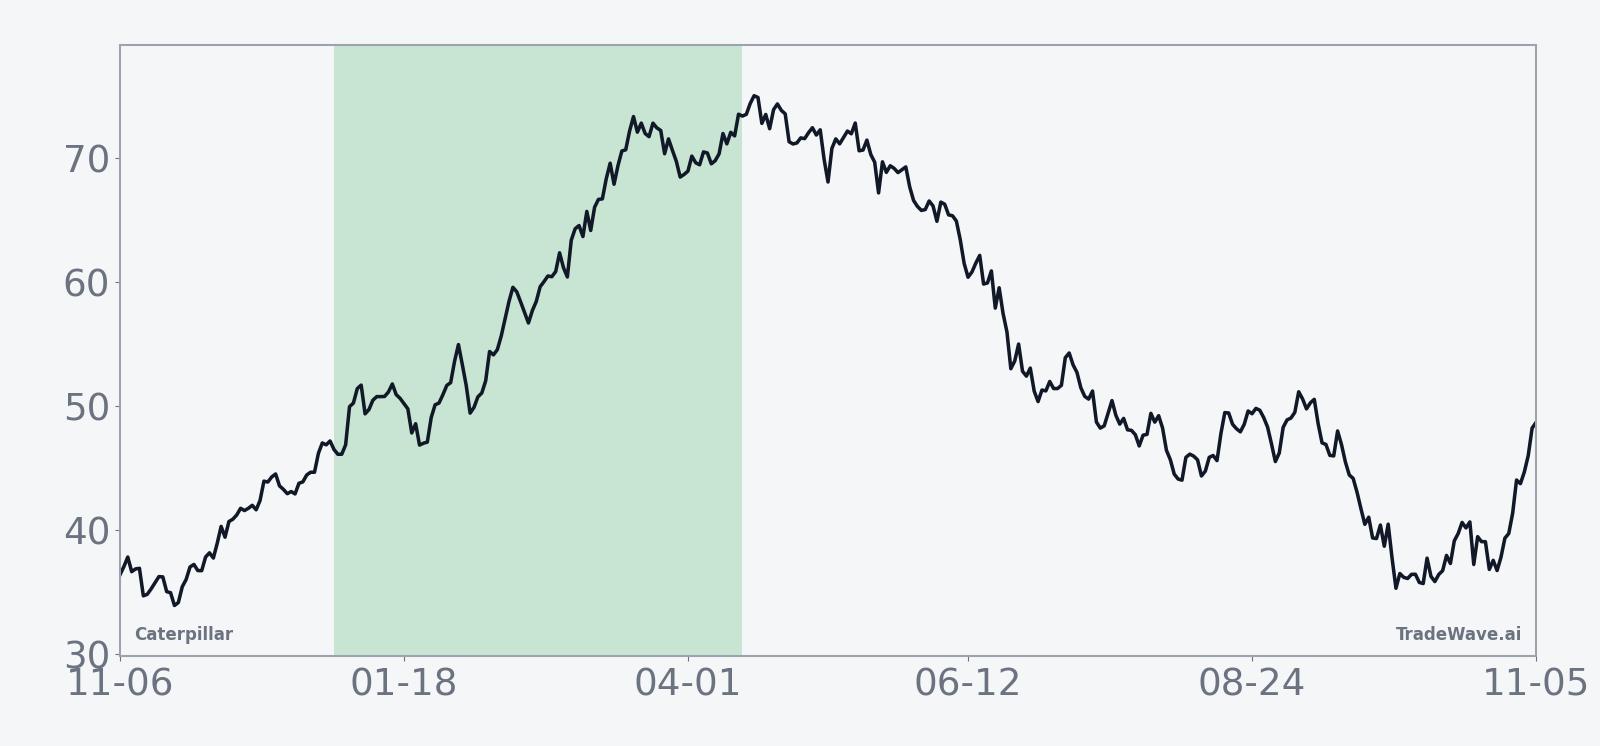
The historical seasonal trend chart indicates that gains in this window have often accrued steadily rather than in a single burst. In many years, the pattern shows an early advance that consolidates mid-window before pushing higher into the later stages, consistent with a backdrop where policy clarity improves and capital spending plans firm up as the year after the election concludes.
Yearly net and peak moves highlight upside persistence amid typical drawdowns.
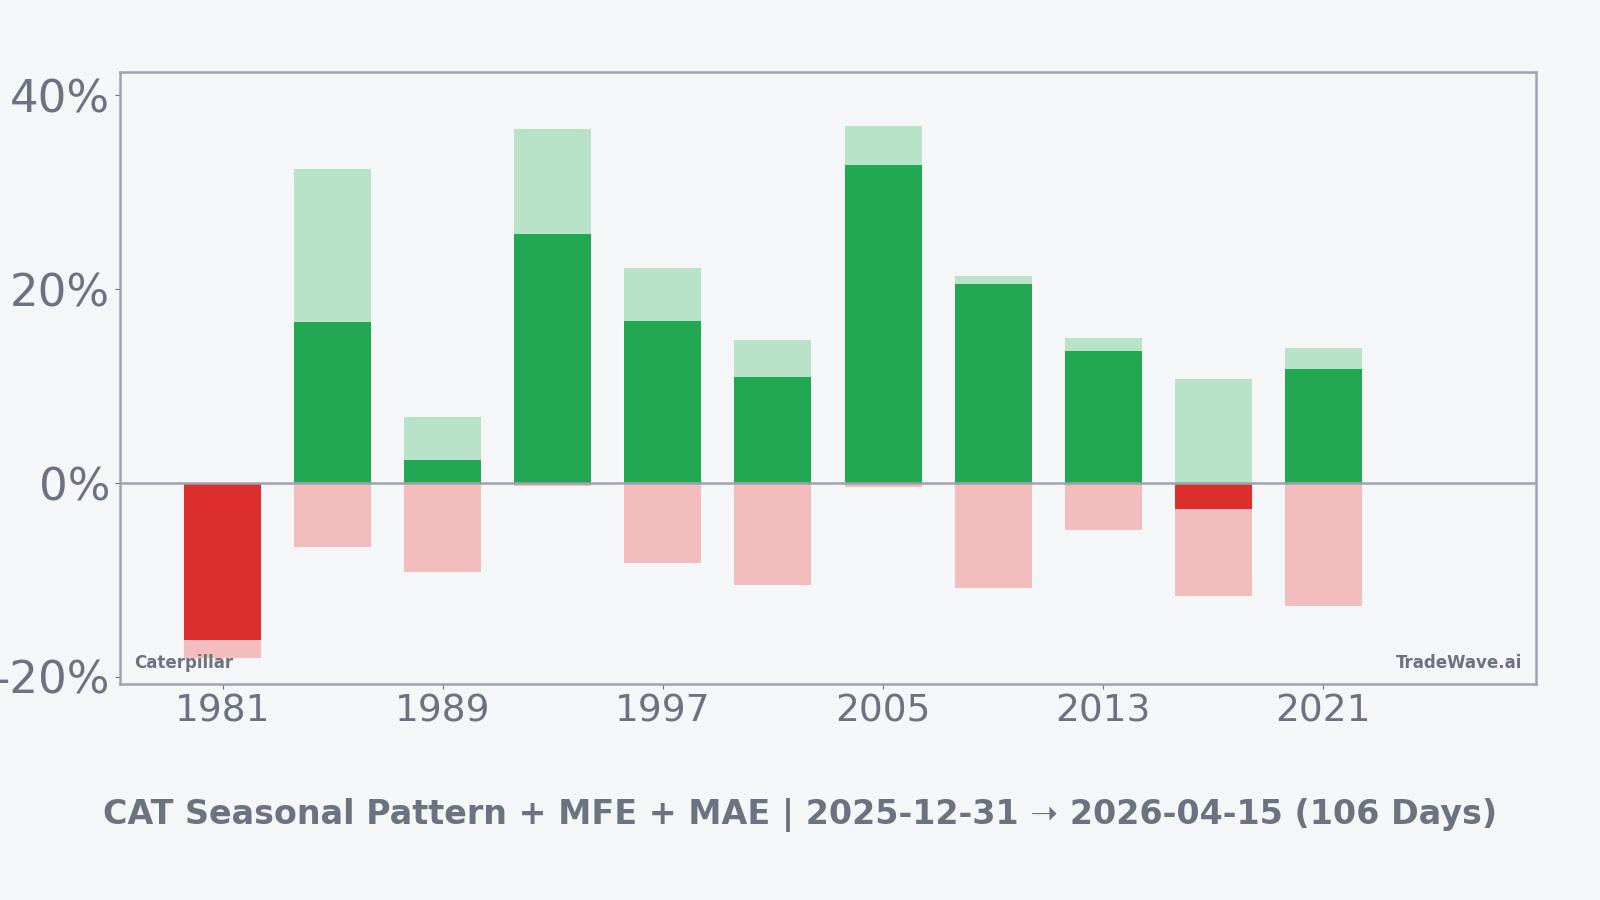
The combined net, maximum favorable excursion and maximum adverse excursion bars show that in strong years such as 2005 and 1993, Caterpillar not only finished the window with large gains but also experienced peak run-ups above 30%, while downside from entry remained relatively contained. In contrast, years like 2001 and 2009 still ended positive but saw adverse moves of around 10% during the window, highlighting that even historically favorable regimes have included meaningful drawdowns before recovering.
History does not guarantee future results; adverse excursions (MAE) can be large even in winning windows.
Price and near-term drivers
Caterpillar enters this seasonal setup after a year of strong share-price performance, with the stock up about 52% in 2025 as investors have leaned into its leverage to industrial demand and AI-related energy infrastructure.[1][2] That rally has unfolded despite a mixed fundamental tape, including a Q1 revenue miss tied to lower dealer inventories and cautious commentary about softer 2025 sales and profitability.[1]
The chart below situates the latest move in its recent multi-month context.
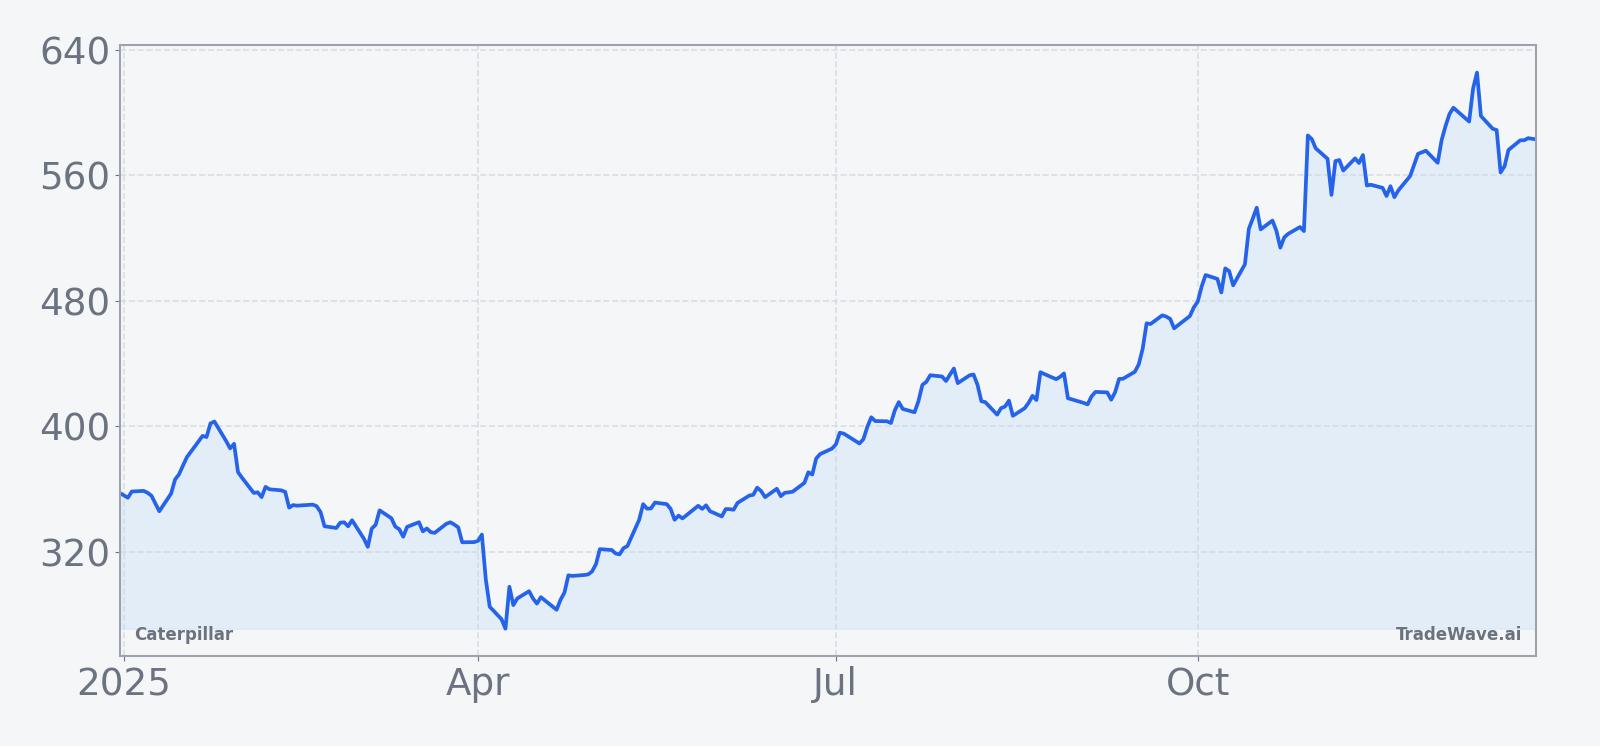
On the earnings front, Caterpillar’s 2025 results have reflected that tension between cyclical cooling and new growth drivers. First-quarter revenue of $14.2 billion and earnings per share of $4.25 both came in below Wall Street estimates, as dealers reduced inventory and management flagged macro uncertainty.[1] The company reiterated that sales and profitability are expected to trend lower in 2025, reinforcing the idea that the current upcycle is maturing.
Subsequent quarters have been more resilient. Second-quarter revenue of $16.57 billion modestly topped expectations, even as EPS of $4.72 missed consensus, suggesting some margin pressure as pricing power normalizes.[1] By the third quarter, Caterpillar delivered revenue of $17.6 billion and EPS of $4.95, beating estimates on both lines, helped by strong demand for energy equipment tied to the boom in AI data centers and backup power generation.[5]
That AI-linked demand has become a key part of the bull case. Analysts at Wells Fargo, cited by CNBC, have highlighted Caterpillar as an emerging AI play as hyperscale cloud providers look to diversify their power sources with turbines and other heavy equipment, supporting both pricing and cost structures in the energy and power segment.[2] The stock’s strong year-to-date performance has tracked that narrative, even as traditional construction and mining end markets have been more mixed.
Macro and policy factors have cut the other way. In August, Caterpillar warned that shifting U.S. trade policies under President Trump would increase tariff-related expenses in 2025, triggering a 3% pre-market drop as investors recalibrated cost assumptions.[7] Higher tariffs can weigh on margins and complicate global supply chains, particularly for a company that sources and sells equipment across multiple regions.
Against that backdrop, the election-cycle framing becomes more relevant. The year after the presidential election is often a digestion phase in Washington, with early policy moves on trade, regulation and spending starting to filter through to corporate budgets. For Caterpillar, that can mean a period where tariff headlines, infrastructure negotiations and energy policy shifts all intersect with its order pipeline, amplifying the importance of how the stock behaves in this historically strong seasonal window.
What to watch as the window unfolds
As the 106-day post-election seasonal window begins on Dec 31, investors will be watching whether Caterpillar’s price action aligns with its historically favorable pattern for long positions. One focus will be how the stock trades around upcoming macro data and policy headlines on tariffs and infrastructure, given the company’s sensitivity to trade costs and public spending.[7]
Another key area is the durability of AI-related energy demand that helped power the strong third-quarter beat. Continued evidence that data center and backup power orders remain firm would support the historical tendency for gains to build through the middle and later parts of the window, while any sign of slowing could make the pattern more volatile than usual.[2][5]
From a levels perspective, traders will be monitoring whether pullbacks inside the window resemble the roughly 10% adverse moves seen in some past winning years or whether downside pressure deepens beyond that historical profile. A path where dips are bought and the stock grinds higher would be consistent with the long-biased seasonal backdrop, while a failure to recover from early drawdowns would look more like the rare losing years in the sample.
Finally, the broader policy calendar matters as the market transitions from the year after the presidential election toward the midterm election year. Any acceleration in tariff actions, shifts in infrastructure priorities or changes in energy regulation could either reinforce or challenge the historical pattern, making it important to track not just Caterpillar’s fundamentals but also how Washington’s agenda evolves during this window.[1][2][5][7] Taken together, these factors will determine whether the upcoming period once again behaves like a historically strong stretch for the stock or breaks from its usual post-election script.
Sources
- [1] Forbes, “What’s Next For CAT Stock?”, Apr 30, 2025.
- [2] CNBC, “This industrial giant is emerging as a big AI play, says Wells Fargo”, Nov 14, 2025.
- [3] Forbes, “What's Next For CAT Stock After A Bleak Outlook?”, Feb 3, 2025.
- [4] Nasdaq, “CAT to Boost Mining Technology Solutions With RPMGlobal Holdings Deal”, Oct 13, 2025.
- [5] Reuters, “Caterpillar beats estimates as AI boom drives energy equipment demand; shares surge”, Oct 29, 2025.
- [6] Forbes, “CAT Stock vs. Peers”, Oct 2, 2025.
- [7] Reuters, “Caterpillar falls after raising annual tariff hit forecast”, Aug 29, 2025.