Earnings Beats and Higher 2025 Guidance Support Marriott International (MAR) Into Year-End
Marriott International is nearing a post-election-year seasonal stretch that has delivered steady gains in past cycles, as the hotel group benefits from resilient luxury travel and recent earnings beats.

Key takeaways
- Marriott International’s upcoming seasonal window begins Dec 29 and runs for 112 trading days in the year after the presidential election.
- Historically this has been a bullish, long-direction window, with 100% of the seven prior years in the sample finishing profitable and no losing years.
- Average profit across those years is 11.42%, with a cumulative gain of 111% and a Sharpe ratio of 1.68, indicating strong risk-adjusted outcomes.
- The TradeWave Ratio of 2.49 suggests price has typically traveled meaningfully in the long direction within the window, beyond just the final closing result.
- Intraperiod swings have been material, with past years showing double-digit peak run-ups and adverse drawdowns before ultimately closing higher.
- The window sits at the end of the year after the presidential election and leads into the midterm year, a transition that often coincides with shifting policy expectations and travel demand narratives.
According to historical data from TradeWave.ai, this late-year stretch for Marriott has shown a distinct pattern in prior post-election cycles. The next section looks at how that seasonal backdrop lines up with today’s fundamental and policy environment.
Seasonal window
Grouping Marriott International’s performance by the presidential election cycle shows that the year after the presidential election has often been a digestion phase for policy and growth expectations, and this upcoming window captures the final part of that phase before markets pivot into the midterm year. This seasonal window begins on 2025-12-29 and spans 112 days, and historically during this period Marriott International has shown a strong upside tendency in years after the election.
In this framework, both the pattern phase and the current calendar phase are the year after the presidential election, and the market is now concluding that phase as December draws to a close. The historical sample aggregates all prior years that matched this same point in the cycle, rather than consecutive calendar years, which helps isolate how hotel demand and policy expectations have tended to interact when a new administration’s agenda is moving from rollout to implementation.
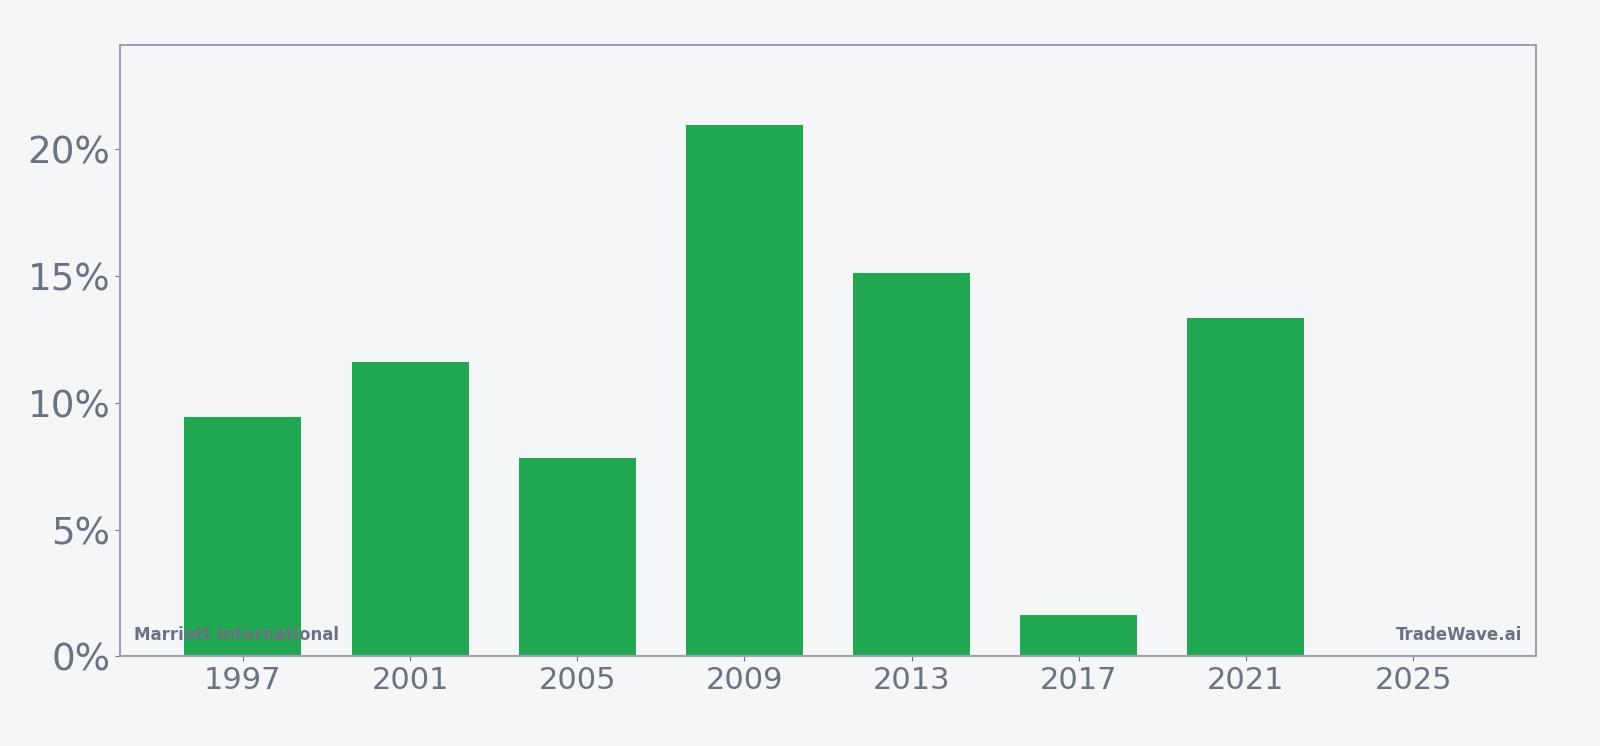
Across seven prior post-election-year instances, the trade direction for this pattern is long, and every one of those years finished the window with a gain. Percent Profitable stands at 100%, with 7 winners and 0 losers, and the average profit across all years is 11.42%, compared with a median outcome of 11.59%. That consistency is notable for a single stock, particularly in a sector that is sensitive to both discretionary travel budgets and interest-rate conditions.
Average profit in the winning years is the same 11.42%, since there were no losing outcomes in the sample, and the cumulative return across all windows totals 111%. The Sharpe ratio for the pattern is 1.68, indicating that the historical gains have come with a relatively favorable balance of return to volatility when measured on an end-of-window basis. For context, a Sharpe ratio above 1 is often viewed as a sign that returns have more than compensated for the variability experienced along the way.
The TradeWave Ratio for this pattern is 2.49. TradeWave Ratio (TWR) reflects how far price typically travels in the trade direction within the window regardless of the final close. A value above 2 suggests that, in prior years, Marriott’s stock often made substantial moves in the long direction during the window, even beyond what the final net gain might imply, which can matter for investors who manage risk or rebalance positions inside the period rather than only at the end.
Looking at individual years helps illustrate the range of paths that have still ended in gains. The strongest year in the sample was 2009, when the stock returned 20.96% over the window, with a best point-to-peak move of 22.71% and a worst intraperiod drawdown of 8.5% from the entry level. The softest outcome was 2017, which still finished up 1.63% but saw a maximum favorable move of 9.93% and a maximum adverse move of 4.76%, underscoring that even the least impressive year in the set involved meaningful swings before settling near flat.
Across the full sample, the profile of best and worst intraperiod excursions, often referred to as maximum favorable excursion and maximum adverse excursion, shows that Marriott has tended to experience double-digit upside bursts alongside occasional double-digit drawdowns within this window. For example, in 2001 the stock’s best run-up inside the period reached 13.04%, while the deepest drawdown from entry was 14.88%, yet the window still closed with an 11.59% gain. That combination points to a regime where volatility has been present but ultimately resolved in favor of the long direction in these post-election-year instances.
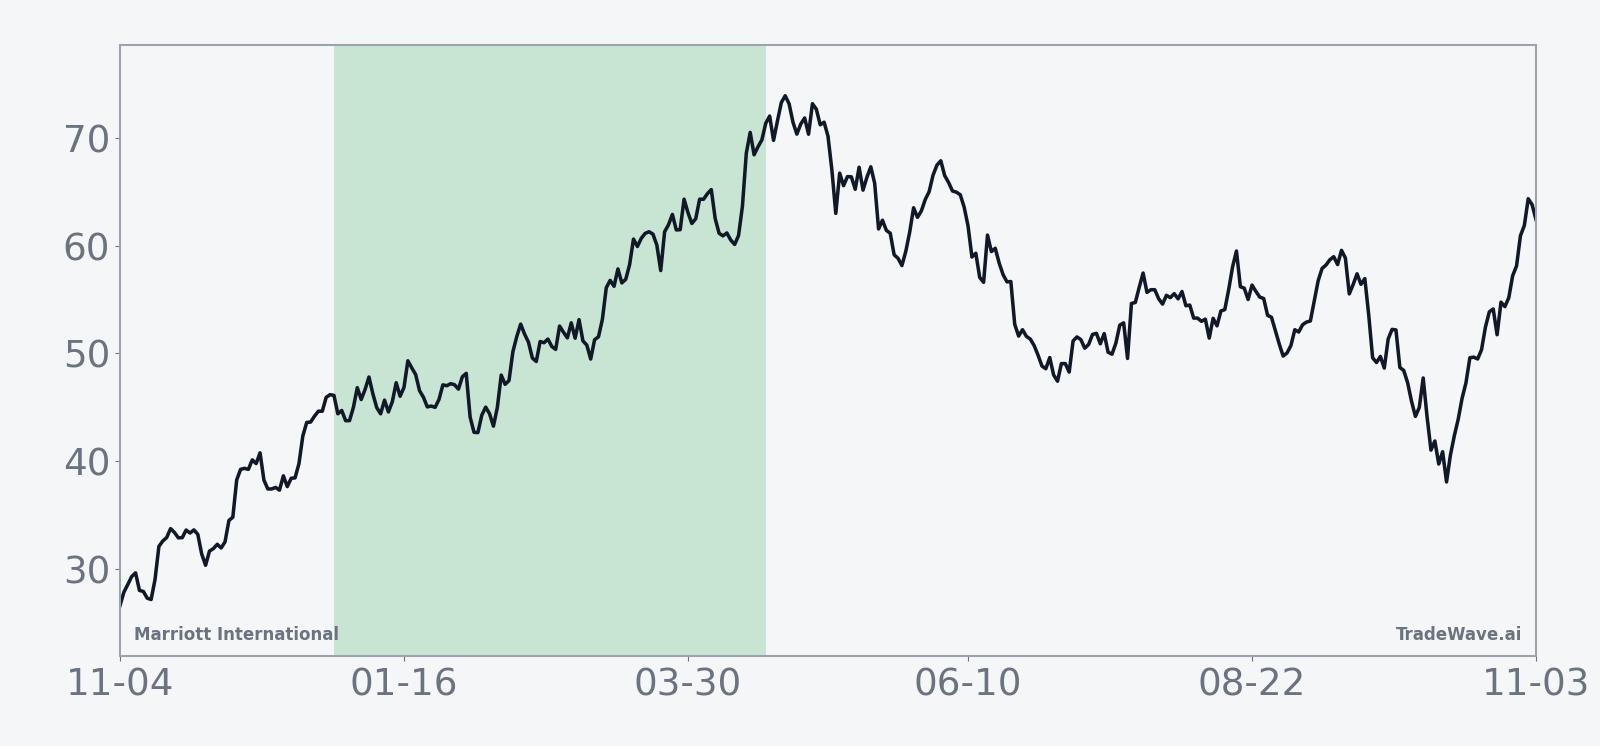
The historical seasonal trend chart for this pattern, which averages performance across all seven years, suggests that gains have typically accrued over the full 112-day span rather than being confined to a single short burst. The curve slopes upward with only modest mid-window pauses, indicating that in many years the stock has added to early advances instead of giving them back, a behavior that can be important for investors who scale into positions over time.
The cumulative return view for the window reinforces that picture, with the average path climbing steadily toward the 11% area by the end of the period. There is some choppiness early on, but the clustering of outcomes near the positive side of the ledger by the final days of the window highlights how few historical instances have finished near zero, let alone negative, in this specific election-cycle phase.
From a policy and macro perspective, the relevance of the presidential election cycle here is that this window bridges the end of the year after the election and the start of the midterm year, when markets often reassess fiscal priorities, regulatory tone and travel-related demand as the administration’s agenda meets congressional realities. For a global hotel operator like Marriott, that has historically coincided with investors refining views on corporate travel budgets, consumer confidence and cross-border tourism, all of which can feed into how the stock trades during this stretch.
Taken together, the historical pattern defines the quantitative seasonal backdrop for the current period, framing a window that has repeatedly rewarded long exposure in past post-election-year cycles while still featuring sizable intraperiod swings.
Year-by-year bars that combine net results with peak run-ups and worst drawdowns highlight how upside has historically outweighed intraperiod volatility.
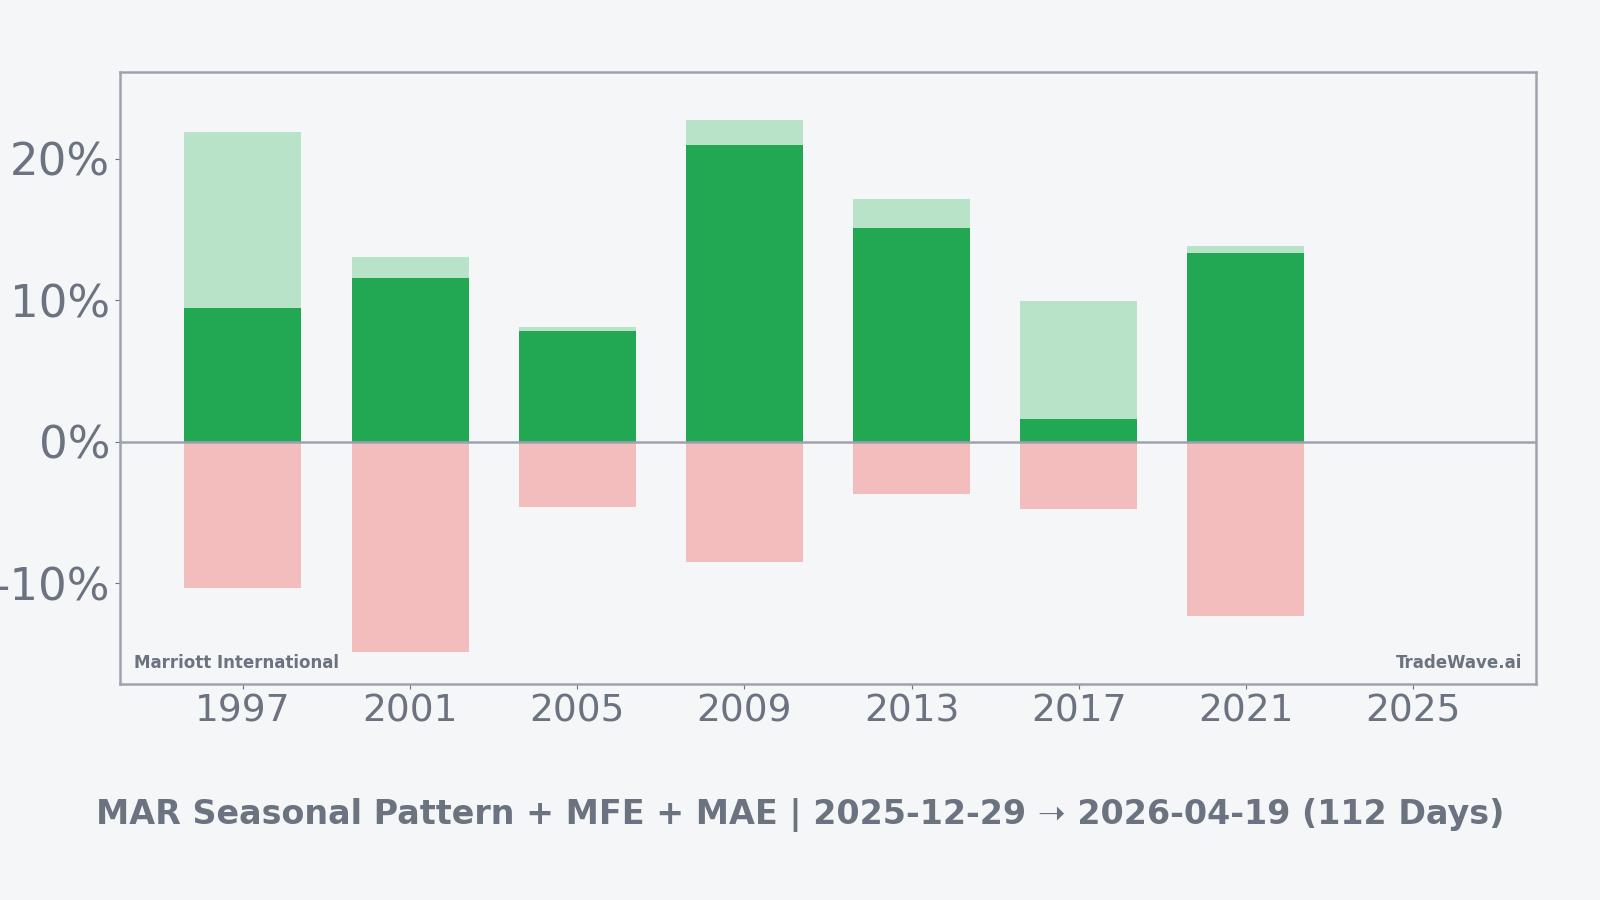
History does not guarantee future results, and adverse excursions can be large even in winning windows.
Price and near-term drivers
Marriott International’s stock has been trading without a clear near-term catalyst in the final days of December, but the broader backdrop remains shaped by a strong run of earnings and resilient demand for higher-end travel. In its most recent reported quarter, the company delivered adjusted earnings per share of $2.47 versus a $2.39 estimate on revenue of $6.49 billion, helped by robust performance in its luxury portfolio even as budget-oriented properties lagged.[2]
The chart below situates the latest move in its recent multi-month context.
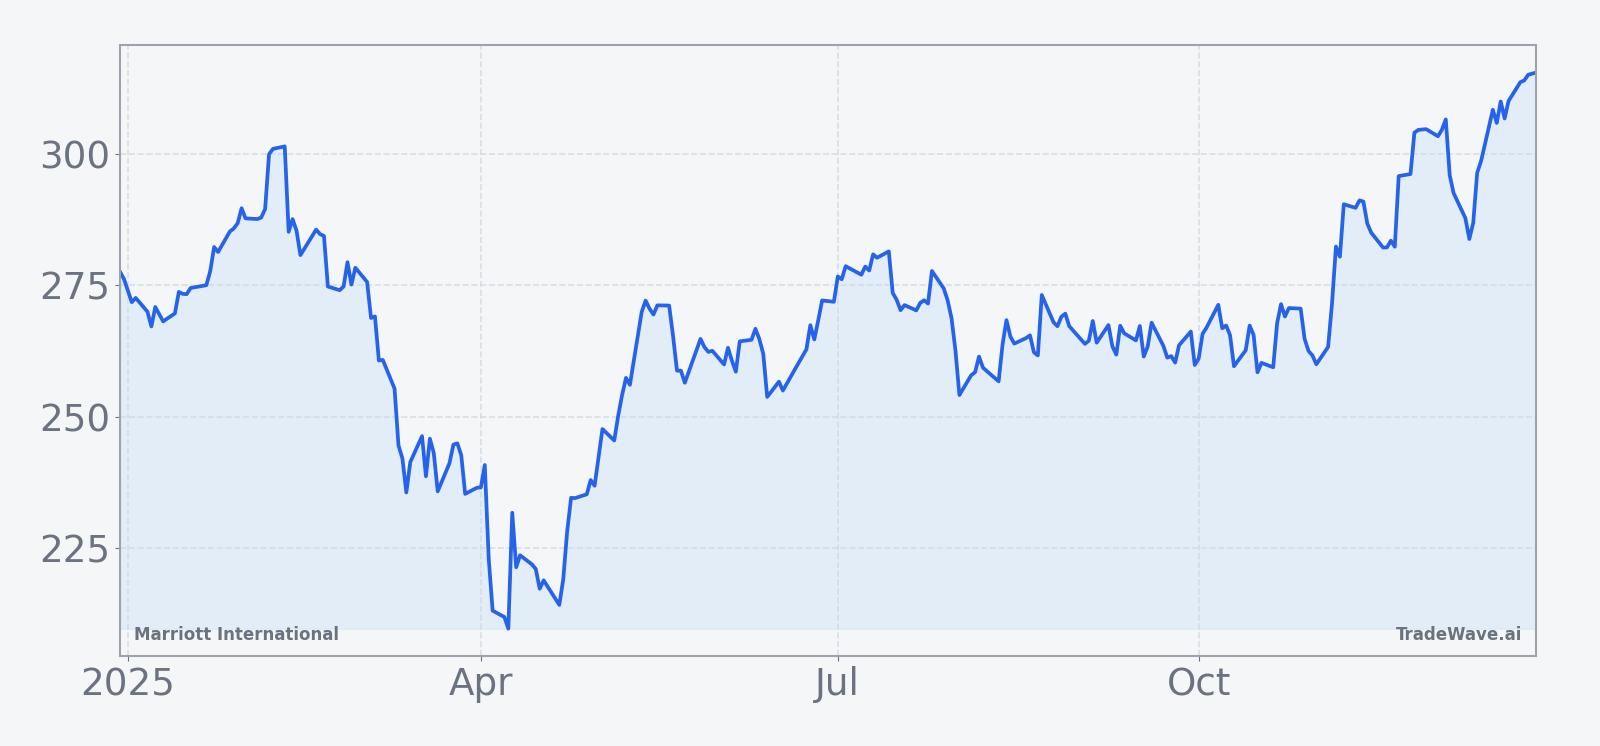
Earlier in the year, Marriott also reported that 2024 marked a record period for adding rooms to its global network, contributing to a full-year profit beat and underpinning management’s decision to raise its 2025 adjusted profit forecast to a range of $9.98 to $10.06 per share, with the midpoint above prior guidance.[1] That expansion has been concentrated in upscale and luxury brands, a segment that has held up better than budget offerings as higher-income travelers continue to spend on experiences despite a mixed macro backdrop.[2]
Sector-wide, the story has been similar: strong demand for luxury accommodations has helped offset softer trends in lower-priced hotels, supporting revenue per available room and pricing power at the top end of the market.[2] For Marriott, which has leaned into that premium positioning, the combination of network growth and resilient high-end demand has given investors a fundamental cushion heading into the new year, even as questions linger about how long the travel upcycle can persist.
Against that backdrop, the upcoming seasonal window takes on added interest. The company is moving from a year defined by post-pandemic normalization and policy bedding-in toward a midterm election year that could bring fresh debates over regulation, taxation and corporate travel budgets. How the stock behaves inside a historically strong post-election-year window may influence how investors frame those risks and opportunities as the political and macro calendar evolves.