Natural Gas
Henry Hub Natural Gas futures represent the benchmark price for natural gas in North America, heavily influenced by weather patterns and seasonal demand.
The seasonal picture for natural gas splits sharply depending on which lens you use. The last 10 consecutive years show an 80% win rate over 30 days with a projected gain of 8.75% toward $2.96, a genuinely strong setup. But midterm election years tell a starkly different story: just a 25% win rate over 30 days and a projected decline of 1.94% toward $2.67, deteriorating further to a 22.23% loss over 90 days.
Natural gas is notoriously cycle-sensitive, and midterm years have historically punished bulls hard. The 90-day midterm target of $2.11 versus the consecutive-year target of $3.05 represents a $0.94 gap worth respecting. Watch storage reports and heating demand closely as the primary catalysts that could resolve this divergence.
Seasonal Price Projections
Select a historical basis and projection horizon to see where seasonal patterns suggest Natural Gas may be headed.
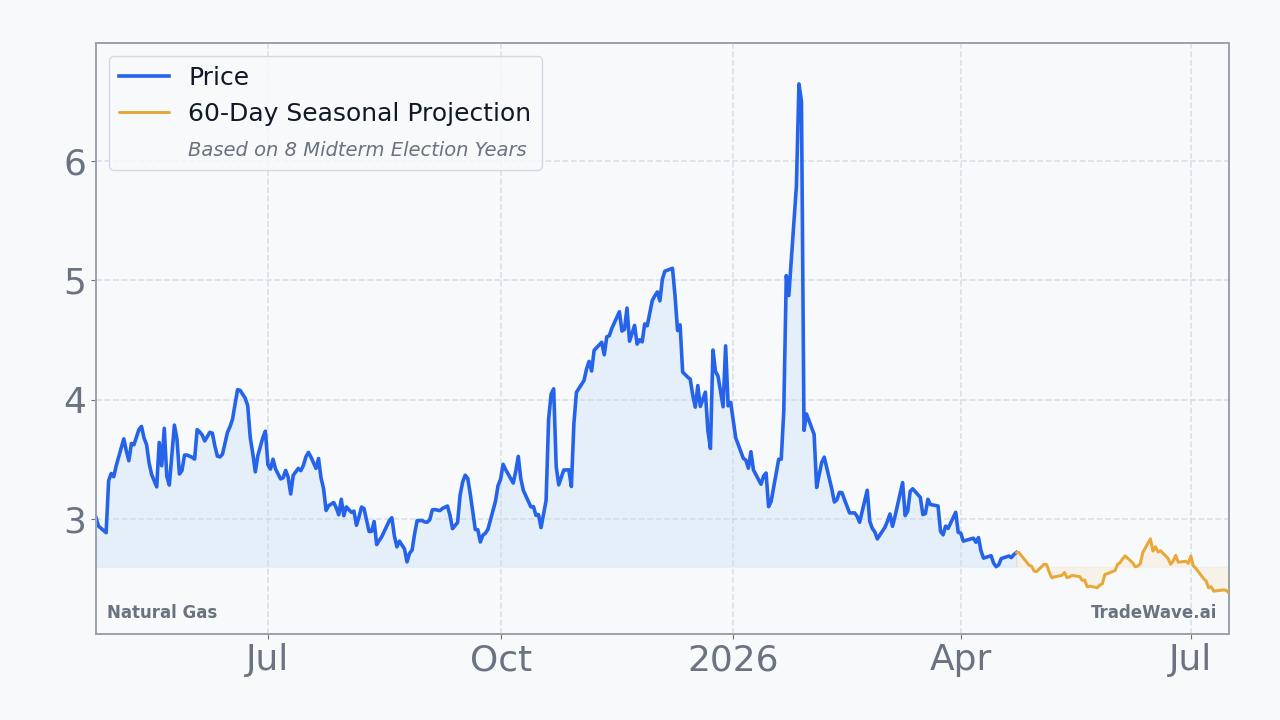
Projection as of Apr 24, 2026 from closing price $2.7150
How to Use This Data
Seasonal projection data for Natural Gas shows how the commodity has historically performed during this same calendar period across prior years. The consecutive pattern reflects a 60.0% win rate, meaning Natural Gas closed higher than its starting price in 60 out of every 100 comparable historical periods. The midterm election year pattern carries a 50.0% win rate over that same window.
When the two bases point in opposite directions, as they do here, it signals that election cycle years have produced meaningfully different outcomes than the broader historical record. The median return is often more reliable than the average in these cases, since extreme years like the historical best of +49.0% can pull averages away from typical experience.
Seasonal patterns are built entirely from past price behavior and cannot account for supply disruptions, weather events, regulatory changes, or geopolitical developments that may be unfolding in real time. A 60.0% win rate still implies a 40.0% historical loss rate, and no statistical tendency guarantees any specific outcome in a given year.
Market participants often use seasonal data as one layer of context alongside fundamental supply and demand analysis, technical price levels, and broader macroeconomic conditions. It can help frame expectations about historical tendencies during a given period, but it functions as background information rather than a standalone signal.
This information is provided for educational purposes only and does not constitute financial advice, a recommendation, or a solicitation to buy or sell any security. Seasonal patterns are based on historical data and do not guarantee future performance. All investment decisions carry risk. Consult a qualified financial advisor before making investment decisions.
Understanding Seasonal Projections
Seasonal projections estimate future price movement based on how Natural Gas has historically performed during the same calendar period. These are statistical baselines derived from decades of market data, not predictions.
Consecutive Years (Last 10)
Uses the most recent 10 years of data regardless of market regime. This captures the broadest recent behavior, including all economic and political environments. Over the next 60 trading days, this pattern has been positive 6 of 10 times with an average return of +11.1%.
Midterm Election Years (8 Available)
Uses only years that fall in the same position within the 4-year U.S. presidential election cycle. 2026 is a midterm election year. Markets often exhibit distinct patterns tied to fiscal and monetary policy shifts within this cycle. In 8 historical midterm election years, this 60-day window was positive 4 times with an average return of -2.6%.
Seasonal patterns reflect historical tendencies and do not guarantee future results. All projections are based on past performance and should be used as one input among many in your investment decision-making process. Data provided by TradeWave.ai.
Latest News
Recent headlines related to Natural Gas, sourced from major financial news outlets with AI sentiment analysis.
- Enbridge (ENB) Advances While Market Declines: Some Information for Investors
- Delek Logistics Partners, LP Increases Quarterly Cash Distribution to $1.13 per Common Limited Partner Unit
- Dorchester Minerals, L.P. Announces Its First Quarter Distribution
- Ecopetrol enters into an Agreement to acquire an equity stake in Brava Energia S.A. a company domiciled in Brazil
- Is Baker Hughes Company (BKR) A Good Stock To Buy Now?
- Union Pacific Affirms Full-Year Earnings Guidance Following First-Quarter EPS Beat
- Repsol’s Perla Gas Deal With Venezuela Reshapes Risk And Growth Story
- Union Pacific Corporation Q1 2026 Earnings Call Summary
- Eni Makes Giant Natural Gas Discovery Offshore Indonesia
- VG vs. EQT: Which Natural Gas Stock Is the Better Buy Now?
Explore More
Other markets with seasonal analysis and recent pattern articles.