Natural Gas (CME) (NG) Has Rallied in All 8 Midterm Spring Windows After Winter Slides
Natural Gas (CME) is heading toward a short midterm-year spring window that has never been negative in the data, just as prices rebound from deep winter losses.

Key takeaways
- A 12-day seasonal window for Natural Gas (CME) starting Mar 22 has been positive in all 8 midterm election years in the dataset, with a long trade direction.
- Average gain across those eight cycles is 5.67%, with a cumulative return of 54% and a Sharpe ratio of 1.51 for the window.
- Today NG trades at 3.182, up 0.4% on the session and far below last year’s 7.827 high, after a roughly 34.9% slide over the past month.
- Intraperiod swings have been meaningful: the strongest year in the sample saw a 13.41% peak run-up, while the weakest still finished positive after a drawdown of almost 7.93%.
- The TradeWave Ratio of 2.19 signals that price has typically traveled substantially in the trade direction within the window, even when final closes were more modest.
- History shows a clear bullish bias for this short spring stretch, but adverse excursions have been large enough that risk management has mattered as much as direction.
According to historical data from TradeWave.ai, this upcoming midterm-year spring stretch has behaved very differently from an average month on the natural-gas calendar. The next section walks through what that pattern has looked like in prior cycles and how it frames the backdrop for 2026.
Seasonal window
Natural Gas (CME) has risen in all 8 midterm election years during this 12-day spring window, averaging gains of 5.67%. Today the front-month contract trades at 3.182, up 0.4% on the day, after a roughly 34.86% drop over the past month and a slide from a 52-week high of 7.827 that leaves it about 59.3% below that peak.[5]
The pattern groups the last eight midterm election years, a phase when U.S. policy often shifts from early-cycle stimulus toward mid-cycle adjustment. For a contract as policy-sensitive as natural gas, that election-cycle lens matters because regulatory signals, export approvals and infrastructure debates can all influence how weather-driven demand shocks translate into price.
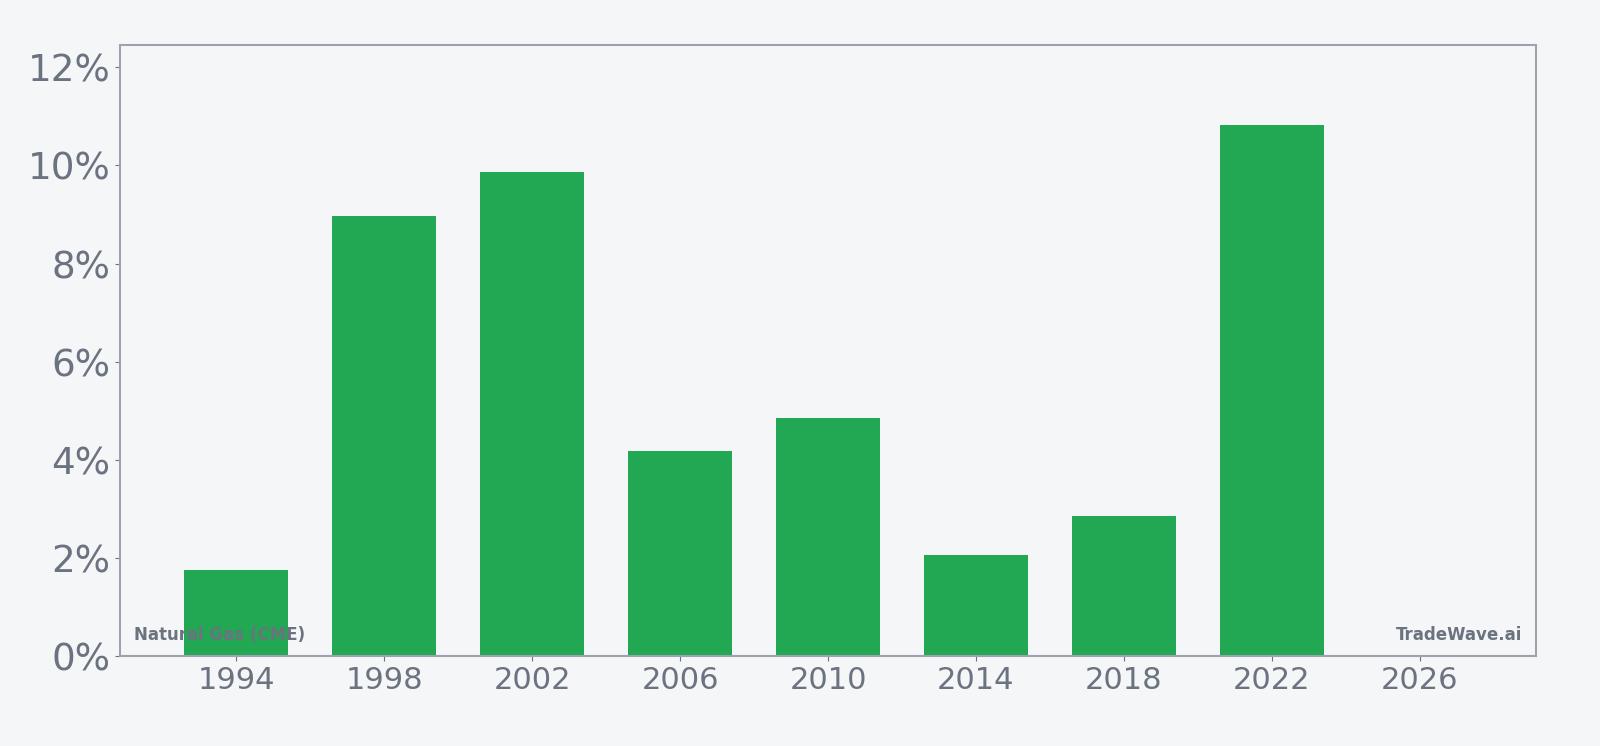
Across those eight midterm years, the trade direction for this window is firmly long. Percent Profitable is 100%, with 8 winners and 0 losers, and the cumulative return across all cycles is 54%. The average gain of 5.67% sits slightly above the 4.52% median profit, which tells you that a couple of stronger years, such as 2022’s 10.83% rise, pulled the mean higher while even the softer years still finished green.
Looking at individual cycles, 2022 stands out as the strongest, with a 10.83% net return and a maximum favorable move of 13.41% from entry before the window closed. On the other side of the spectrum, 1994 delivered the smallest net gain at 1.76%, yet it also carried the deepest intraperiod drawdown, with a maximum adverse move of 7.93% before recovering into the close. That combination shows how a window can finish positive while still testing long positions along the way.
The maximum favorable excursion, or MFE, captures the best point-to-peak move within each window, and those numbers have been consistently larger than the final closes. Years like 1998 and 2002 saw MFE readings of 10.8% and 11.24% respectively, compared with final gains of 8.97% and 9.86%. On the downside, maximum adverse excursion, or MAE, has ranged from relatively shallow pullbacks of around 0.33% in 2006 to deeper dips of 6.59% in 2010, underscoring that even “all green” windows have not been straight lines higher.
The historical seasonal trend chart for this window shows a pattern of early hesitation followed by a stronger push later in the 12-day stretch. On average, returns tend to grind sideways or modestly higher in the first few sessions, then accelerate into the back half of the window, which is where much of the average 5.67% gain has historically accrued.
A combined view of net returns with peak run-ups and worst drawdowns shows how much the contract has typically moved inside the window.
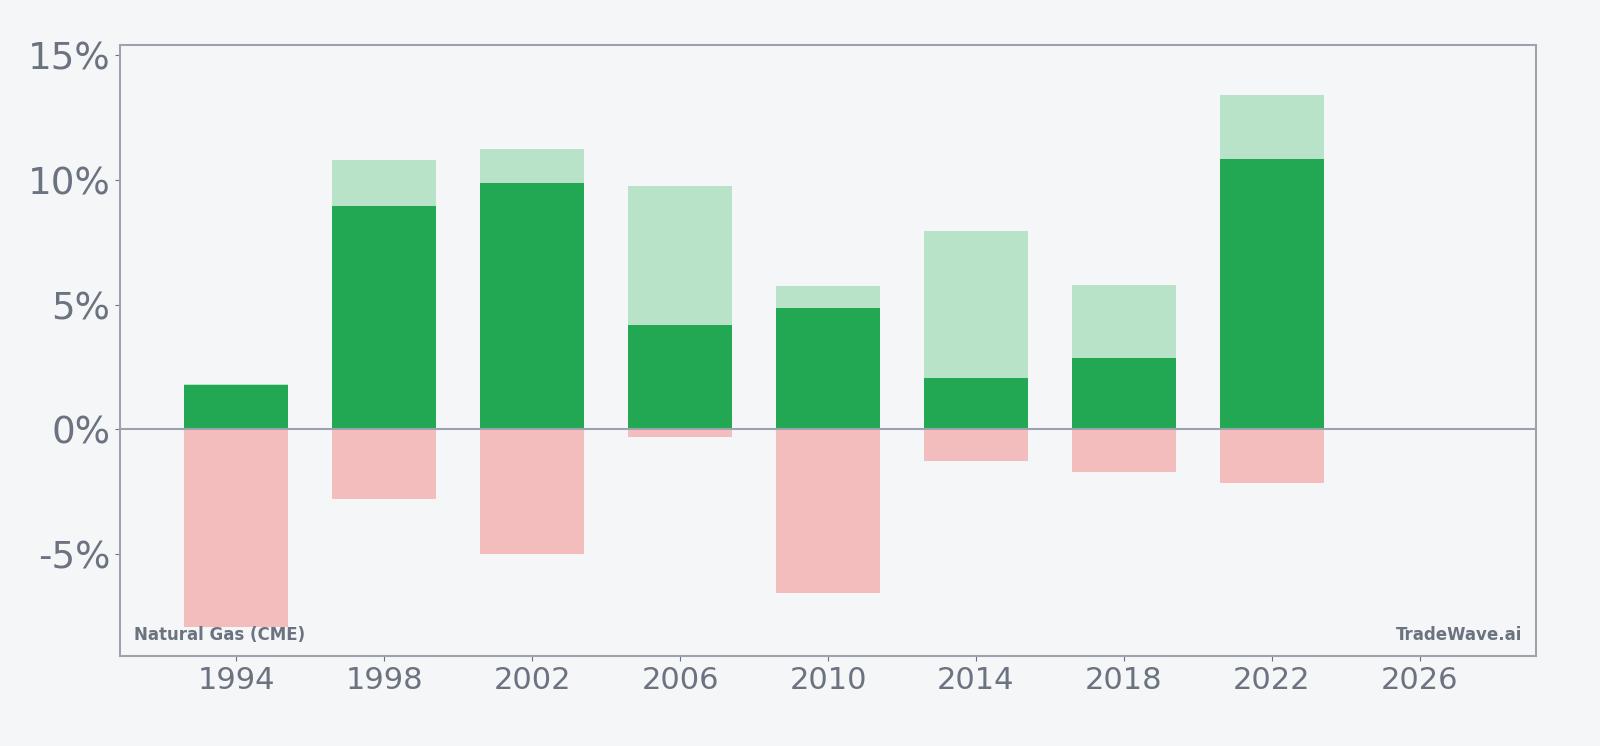
The stacked view of net results, MFE and MAE highlights a key feature of this pattern: upside potential has historically been meaningful, but so have the swings along the way. In several years, the contract rallied more than 7% at some point during the window while also enduring drawdowns of 2% to 7% before finishing higher. For traders, that combination of a strong directional bias and sizable intraperiod volatility is what makes this short spring stretch stand out.
History does not guarantee future results, and even in windows where every past year finished higher, adverse excursions within the period have at times been large.
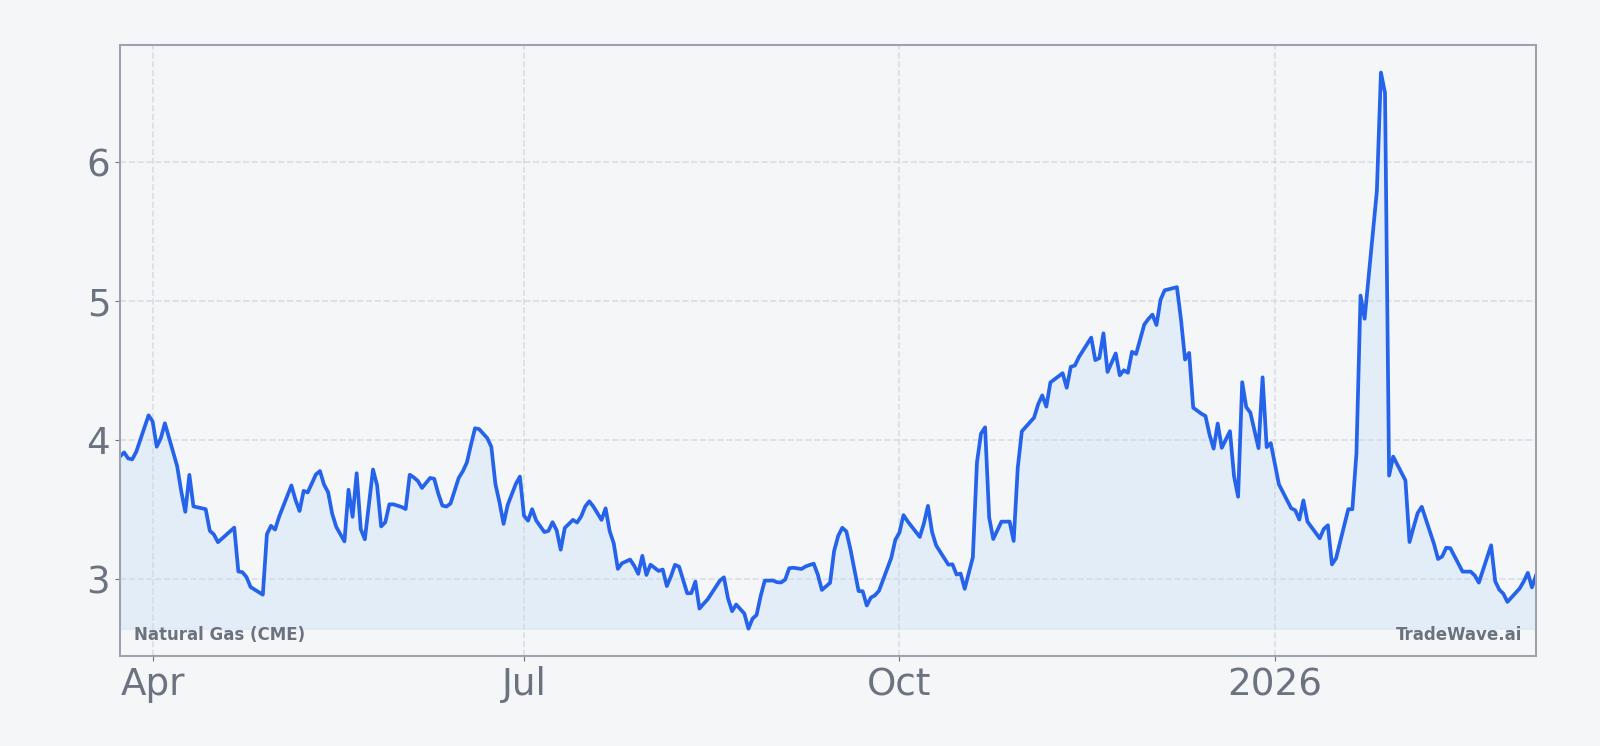
Price and near-term drivers
Front-month Natural Gas (CME) futures closed at 3.182, up 0.013 on the day for a 0.4102% gain, with intraday trade spanning 2.951 to 3.28 on volume of about 186,000 contracts. That bounce comes after a steep one-month slide of roughly 34.86% and leaves the contract well below its 50-day moving average of 3.7623 and far off the 52-week high of 7.827, even as it holds above the 52-week low of 2.622.[11]
Weather remains the dominant near-term driver. On Jan 20, 2026, MarketWatch reported that natural-gas prices surged as a sharp temperature drop boosted heating demand and “sent natural gas futures soaring,” a reminder of how quickly cold snaps can tighten balances and shock prices higher.[5] More recently, The Wall Street Journal noted on Feb 19, 2026 that U.S. natural gas futures slipped in choppy trade as traders weighed a coming cold spell against broader supply and demand dynamics, underscoring how quickly sentiment can swing when forecasts and storage expectations shift.[11]
Storage and inventory expectations also sit in the background. In late 2025, The Wall Street Journal highlighted how anticipated storage withdrawals, even against milder weather, could flip a surplus into a deficit and support prices, while other December coverage pointed to futures extending declines when forecasts turned warmer and demand expectations eased.[3][6][7][12] Those episodes show how the same contract can react very differently to similar calendar dates depending on the interplay between weather, storage and positioning.
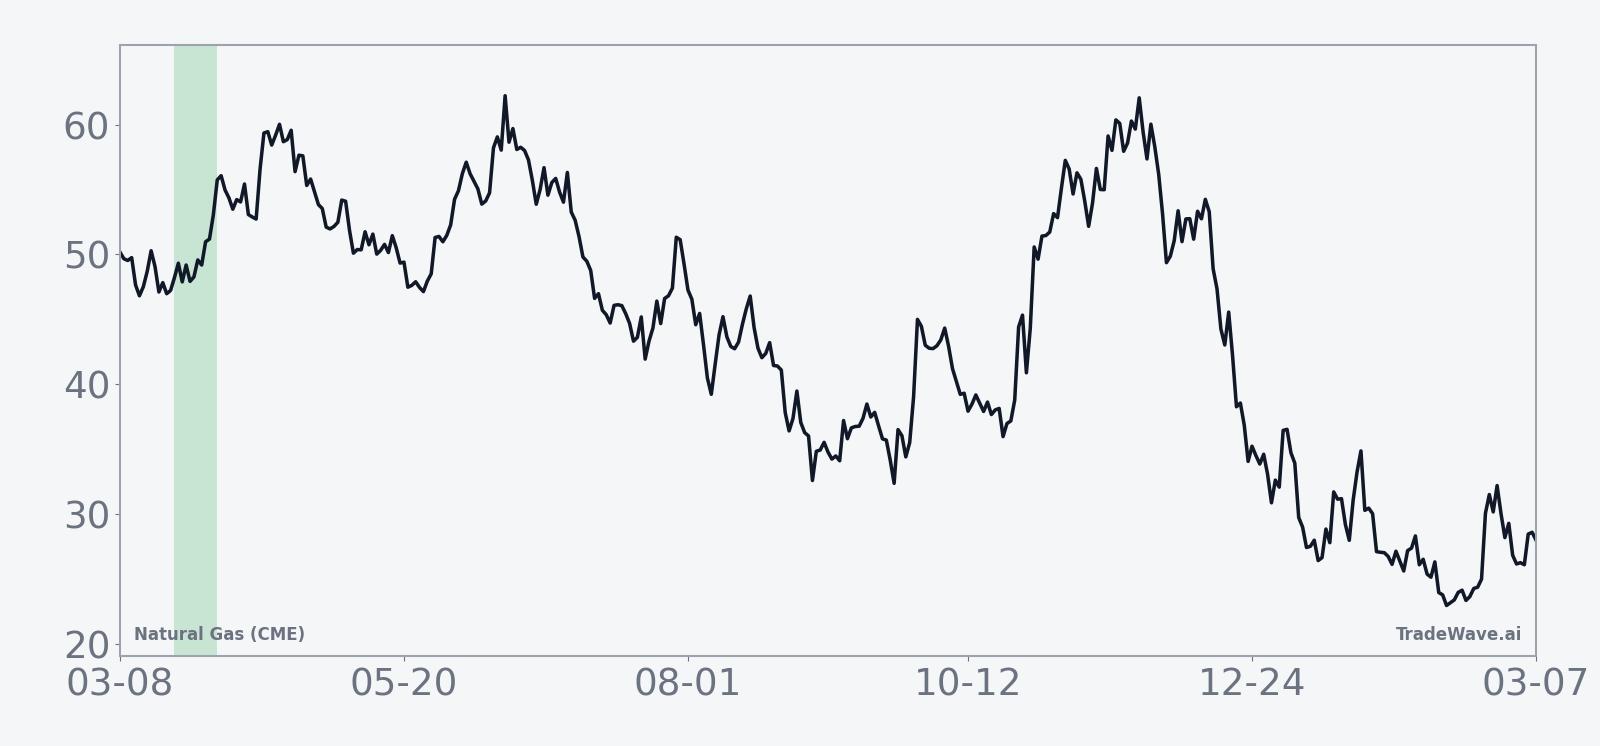
The chart below situates the latest move in its recent multi-month context.
Election-cycle context and what to watch
Calendar-wise, 2026 is the midterm election year in the current U.S. presidential cycle, and this 12-day window beginning Mar 22 sits in the early part of that year. The historical sample covers the last eight midterm election years, so the upcoming iteration lines up directly with the same phase of the political and policy calendar that produced those prior results.
Midterm years often bring a mix of policy uncertainty and legislative gridlock, which can blunt big new energy initiatives but still leave room for regulatory tweaks, export decisions and infrastructure approvals that matter for gas flows. For natural gas, that means the macro backdrop can be noisy while the contract remains highly sensitive to weather and storage, a combination that has historically produced sharp but tradable bursts of volatility in short windows like this one.
For this specific window, the historical pattern is clear: eight for eight on the upside, with average gains north of 5% and several years posting double-digit peak moves inside the period. At the same time, the MAE profile shows that even in winning years, the contract has often dipped several percent before recovering, which is consistent with a market that reacts quickly to shifting weather models and storage headlines rather than trending smoothly.
Heading into the 2026 iteration, traders will be watching a few things. First, whether the current rebound from multi-month lows can stabilize above the 3.00 area and start to close the gap toward the 50-day moving average, or whether further weakness keeps NG pinned near the bottom of its recent range.[11] Second, how late-March weather forecasts evolve for key U.S. demand centers, since a swing toward colder or hotter-than-normal conditions could quickly tighten or loosen balances. Third, weekly storage data and any signs that withdrawals or injections are diverging from expectations, which has repeatedly been a catalyst for sharp intraday moves in prior winters and shoulder seasons.[3][6][12]
Finally, the behavior of price inside the Mar 22 to early-April window will offer a real-time test of the historical pattern. A tape that sees early chop followed by a stronger push higher, with intraperiod swings that mirror past MFE and MAE ranges, would be consistent with the last eight midterm-year cycles. A flat or sharply negative outcome would mark a clear break from that history and signal that the current mix of weather, storage and policy drivers is overpowering the usual seasonal rhythm.
Sources
- [2] Reuters, “US natgas prices gain over 2% on mid-July heat forecasts, more cooling demand,” Jul 2, 2025. Link
- [3] The Wall Street Journal, “U.S. Natural Gas Picks Up Ahead of Storage Data,” Dec 10, 2025. Link
- [5] MarketWatch, “Natural-gas prices soar as temperatures drop,” Jan 20, 2026. Link
- [6] The Wall Street Journal, “U.S. Natural Gas Futures Gain Ahead of Delayed Storage Data,” Dec 29, 2025. Link
- [7] The Wall Street Journal, “U.S. Natural Gas Futures Extend Decline,” Dec 12, 2025. Link
- [11] The Wall Street Journal, “U.S. Natural Gas Futures Slip in Choppy Trade,” Feb 19, 2026. Link
- [12] The Wall Street Journal, “U.S. Natural Gas Futures Post Daily Gain, Weekly Loss,” Dec 19, 2025. Link