Mild Late-December Weather Forecasts Pressure Natural Gas (CME) (NG) Futures
Natural Gas (CME) is stabilizing after sharp winter swings as it approaches a historically strong late‑March seasonal window that could intersect with shifting weather, storage and policy dynamics.

Key takeaways
- Natural Gas (CME) is set to enter a historically strong 12-day seasonal window starting Mar 22, based on the last 8 midterm election years.
- The pattern has been long-biased, with a 100% Percent Profitable record across 8 winners and 0 losers in the sample.
- Average profit in winning years has been 5.67%, with a cumulative gain of 54% and an annualized return of 5.62% over the grouped midterm cycles.
- The TradeWave Ratio of 2.19 and Sharpe ratio of 1.51 point to historically favorable risk-adjusted upside during this window.
- Intraperiod swings have still been meaningful, with past years showing notable worst-case drawdowns even when the window ultimately finished higher.
- The setup arrives as NG trades around $2.84 per mmBtu, with traders watching how storage data and evolving weather forecasts interact with this election-cycle seasonal tendency.
According to historical data from TradeWave.ai, this upcoming stretch has shown a distinct pattern in prior midterm election years. The next section looks at how that election-cycle seasonality has lined up with price behavior in Natural Gas (CME).
Seasonal window
This seasonal window begins on Mar 22, 2026 and spans 12 trading days. Historically, during this period, Natural Gas (CME) has shown a strong upside tendency in the last 8 midterm election years, with every instance finishing higher. Today the front-month NG contract settled at $2.844 per mmBtu, up about 0.6% on the session, leaving prices in the lower half of the past year’s trading range as the market transitions from peak winter demand toward the shoulder season.[4]
Grouping the data by the presidential election cycle focuses this analysis on the last 8 midterm election years, a phase that often features shifting policy debates on energy, regulation and infrastructure. For a contract as policy-sensitive as natural gas, that lens can matter: midterm years frequently bring renewed attention to supply security, export approvals and environmental rules, all of which can influence both fundamentals and positioning around key seasonal inflection points.
The trade direction for this pattern is long, and in the sample of the last 8 midterm election years every instance produced a positive net return over the 12-day span. Percent Profitable stands at 100%, with 8 winners and 0 losers, and the average profit across those winners is 5.67%, contributing to a cumulative gain of 54% and an annualized return of 5.62% for this grouped window. The median outcome of 4.52% suggests that while there have been a few outsized years, typical gains have still been meaningfully positive.
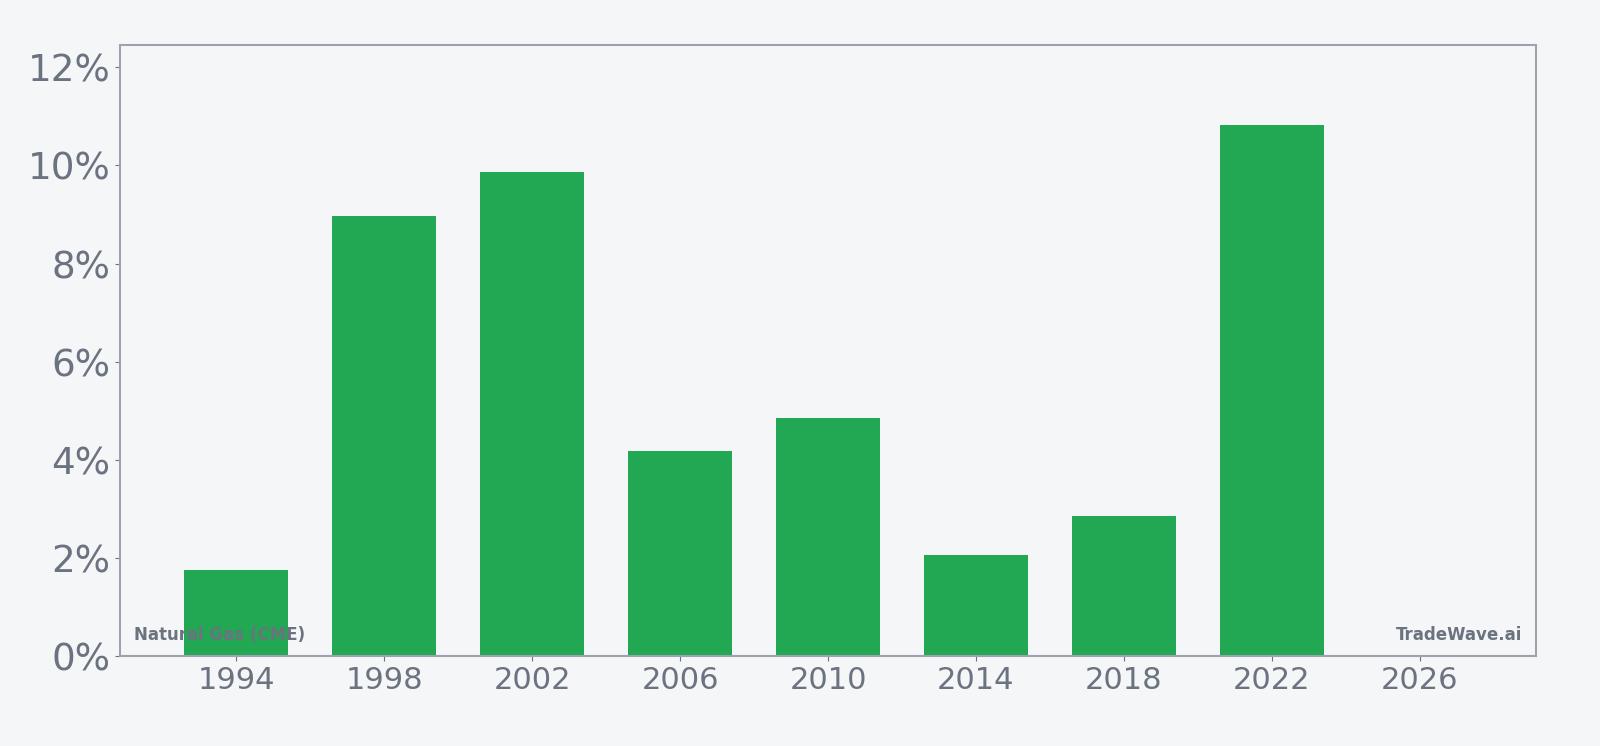
Looking at individual years highlights both the strength and the variability of the pattern. The strongest year in the sample was 2022, when the contract gained 10.83% over the window, with a best intraperiod move of 13.41% from the entry level before any pullback. At the other end of the spectrum, 1994 delivered the smallest gain at 1.76%, and that year also saw one of the deeper temporary drawdowns, with a worst intraperiod move of -7.93% from the starting price before the contract recovered to finish higher.
The historical seasonal trend chart shows a pattern of gains that tend to build steadily through the middle of the window, with some years front-loading strength and others seeing more of the move occur in the back half. The TradeWave Ratio of 2.19 and Sharpe ratio of 1.51 indicate that, on average, the contract has moved a meaningful distance in the trade direction with risk-adjusted returns that compare favorably to many short-term commodity patterns.
Year-by-year net results and intraperiod swings underline how upside and downside have historically coexisted in this window.
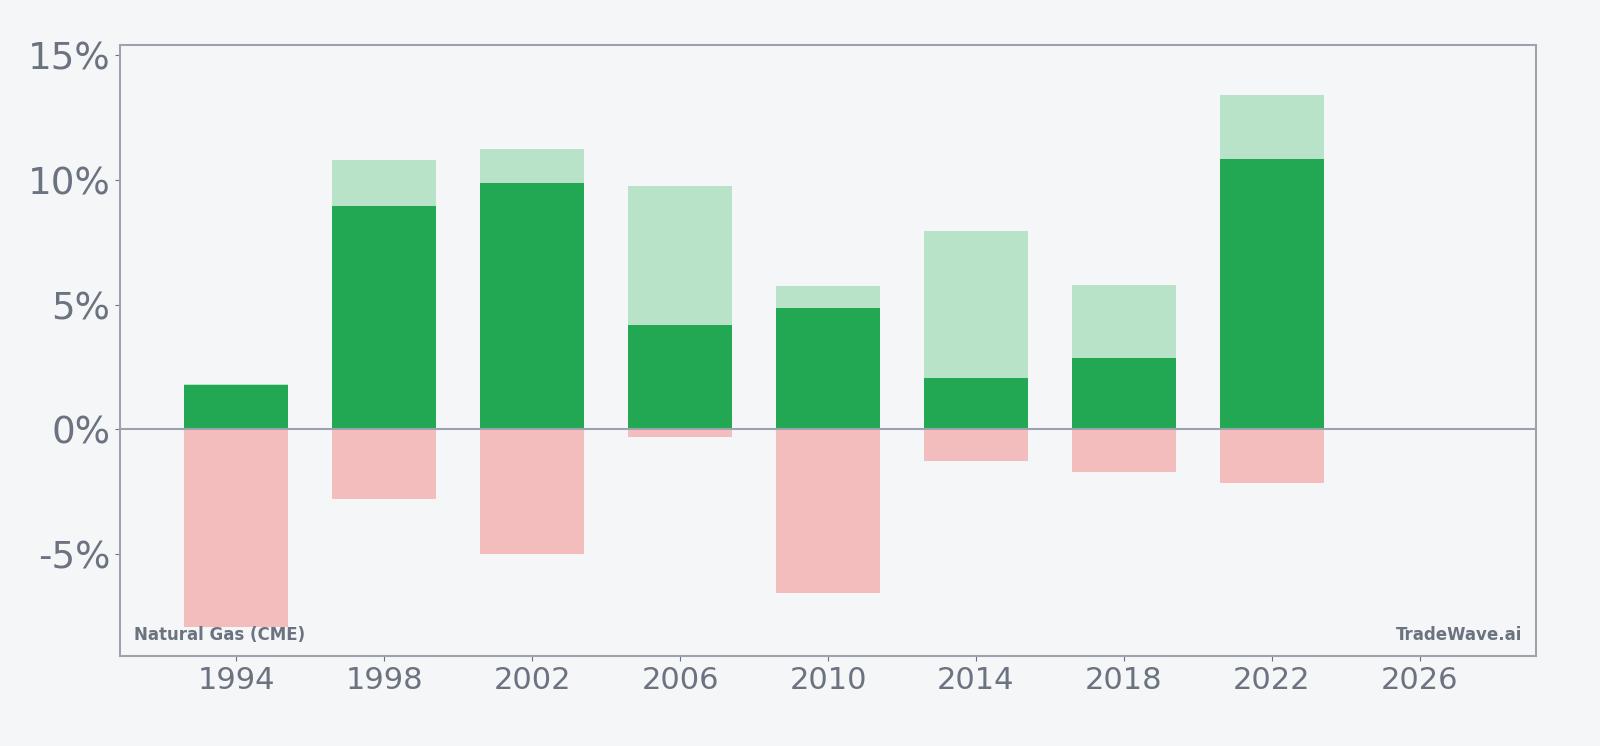
The combined net, best-case and worst-case bar chart shows that even in years with strong final gains, the contract has often experienced notable downside excursions within the window. Maximum favorable moves have reached into double digits in several years, while maximum adverse moves have at times approached mid-single to high-single digits, underscoring that the path to a positive close has not always been smooth. Taken together, the historical pattern defines the quantitative seasonal backdrop for the upcoming period.
History does not guarantee future results, and worst-case intraperiod drawdowns can be large even in windows that ultimately finish higher.
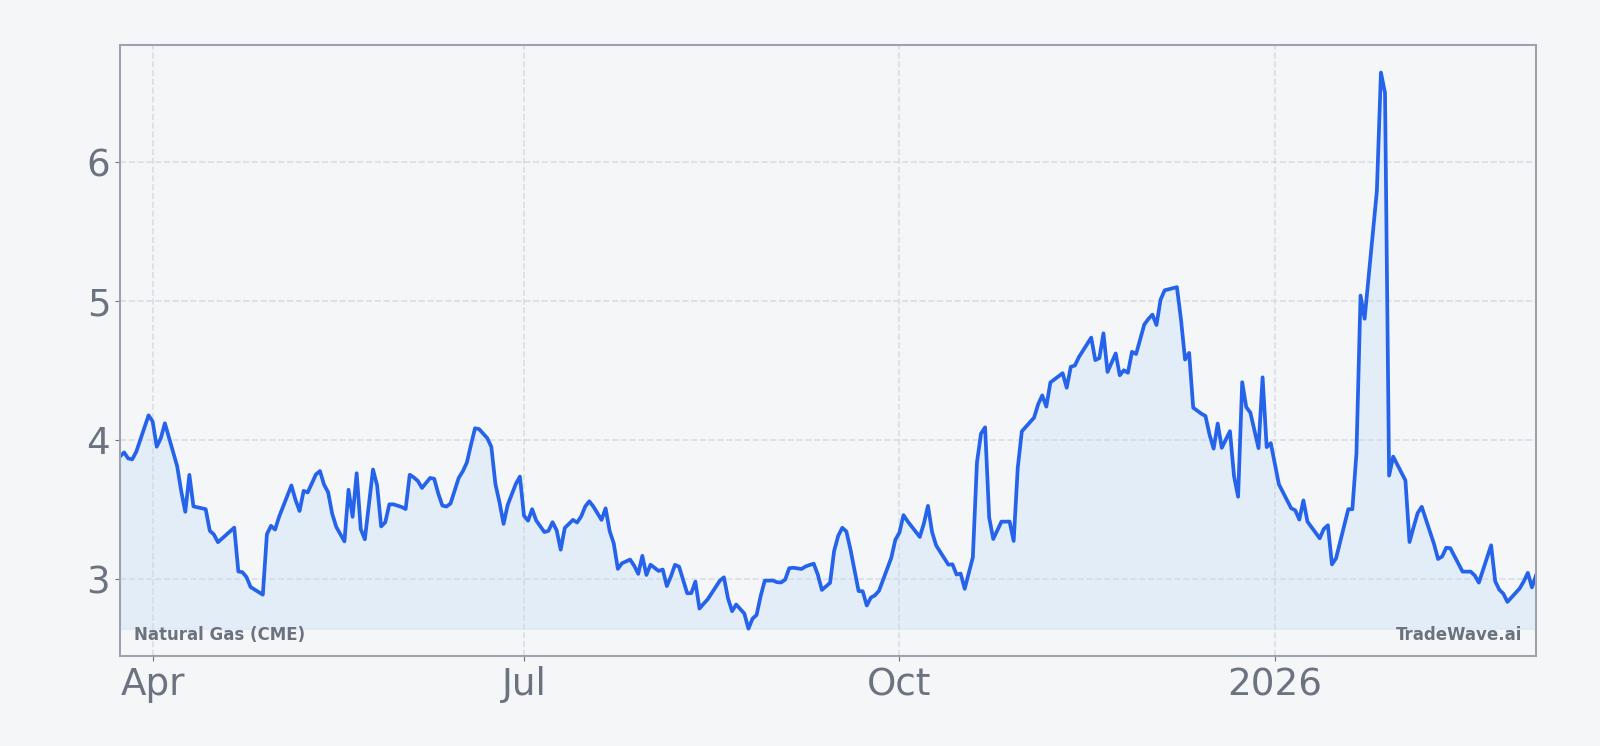
Price and near-term drivers
Natural gas futures ended Friday at $2.844 per mmBtu, up 0.6% on the day, as the market continued to digest a volatile winter marked by sharp weather-driven spikes and subsequent pullbacks.[4] In January, prices surged when bitter cold in the Northeastern U.S. triggered a significant demand increase and tested the market’s resilience, before milder stretches and shifting forecasts later in the season helped cool the rally.[4]
Storage dynamics remain a central focus heading into spring. In late December, expectations for sizable inventory withdrawals, amplified by seasonal demand, helped support U.S. natural gas futures as traders weighed delayed federal storage data and its implications for the supply-demand balance.[5] That backdrop is evolving as winter heating needs fade and attention turns to how quickly injections resume, how robust industrial and power-sector demand proves to be, and whether export flows remain strong enough to absorb any surplus.
Weather remains the dominant short-term catalyst. Forecasts for milder conditions in late December contributed to price declines as heating demand eased, while earlier in the year both cold snaps and heat waves had driven notable moves in the contract.[7][10] The approach of the shoulder season typically brings more uncertainty around demand, with traders watching whether lingering cold fronts or early heat waves emerge to disrupt the usual pattern.
Broader energy-market dynamics are also in play. Natural gas prices have been influenced by supply surpluses, shifting weather outlooks and cross-currents in global gas markets, including European benchmarks and liquefied natural gas flows.[6] In February, U.S. natural gas futures traded in choppy fashion as European prices reacted to a mix of geopolitical tensions and comfortable storage levels, leaving traders cautious about the durability of any single directional move.[11]
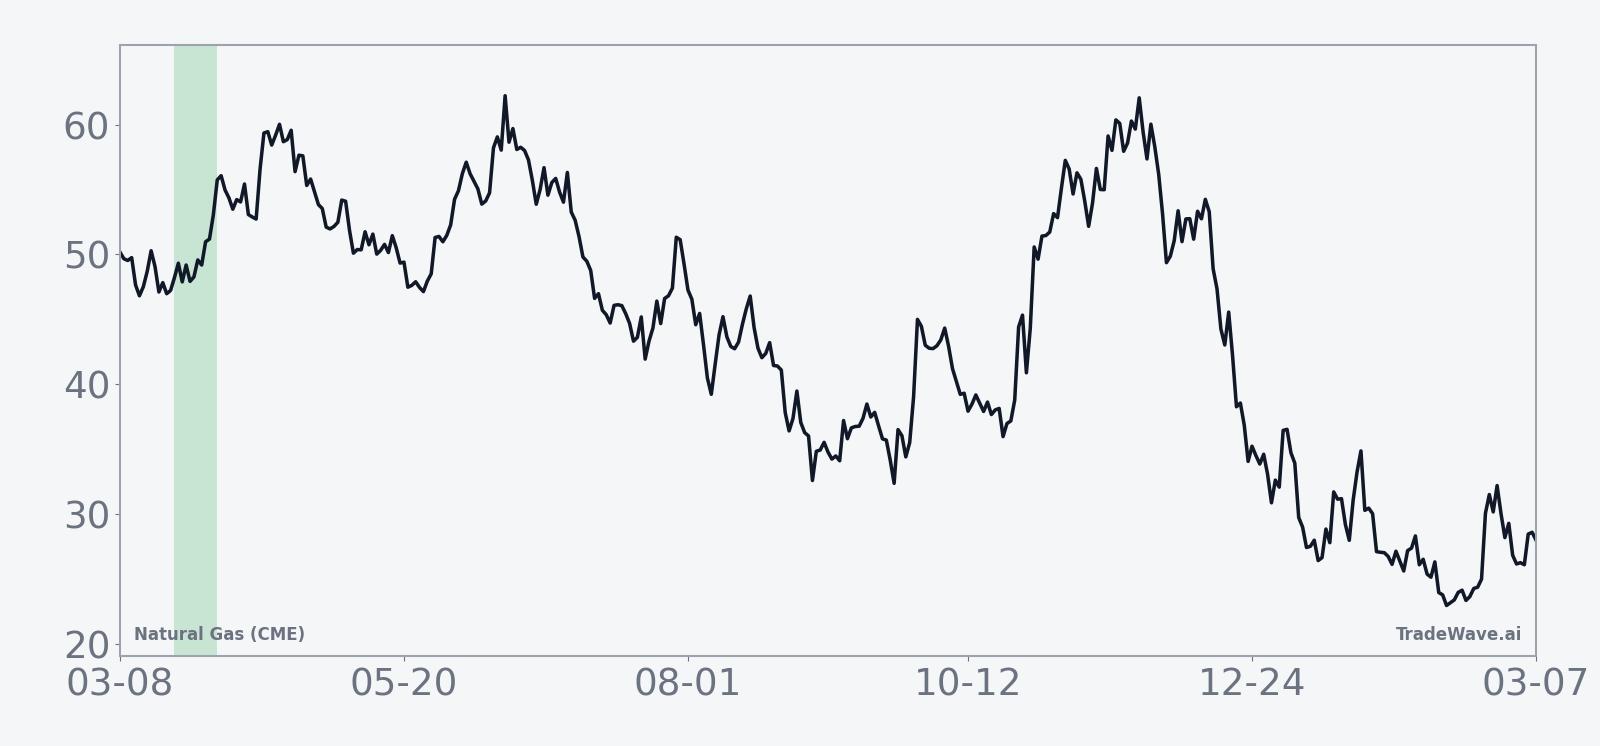
The chart below situates the latest move in its recent multi-month context.
Macro and election-cycle backdrop
The upcoming seasonal window sits within the midterm election year of the U.S. presidential cycle, a phase that often brings heightened debate over energy policy, infrastructure spending and environmental regulation. While natural gas is a global market, U.S. policy decisions on drilling permits, pipeline approvals and export capacity can influence expectations for future supply and demand, particularly around periods when seasonal patterns have historically been strong.
In prior midterm election years, early-year trading in energy markets has sometimes been choppy as investors weigh the economic outlook, central-bank policy and the potential for new legislation. For natural gas, that has overlapped with the transition from winter heating demand to spring and summer power-generation needs, a handoff that can amplify the impact of any policy or macro surprises on price volatility.
What to watch as the window approaches
As the 12-day window beginning Mar 22 approaches, traders will be watching several key factors. First, the evolution of weather forecasts into late March will be critical, particularly any signs of lingering cold or an early onset of heat that could alter demand expectations. Second, weekly storage reports and guidance on injection trends will help clarify whether the market is heading into the shoulder season with a comfortable buffer or a tighter-than-expected balance.[5]
Third, policy and macro headlines tied to the midterm election year could influence sentiment around energy infrastructure, export capacity and environmental rules, all of which can affect how aggressively market participants position into a historically strong seasonal stretch. Finally, behavior inside the window itself will be closely watched: a pattern of early strength that aligns with the historical tendency would reinforce the seasonal backdrop, while a failure to hold gains or an unusually deep intraperiod drawdown would signal that other forces are overpowering the election-cycle pattern.
Sources
- [1] The Wall Street Journal, “Natural-Gas Futures Face Mild Temperatures,” Oct 03, 2025, wsj.com.
- [2] Forbes, “Energy Stock Could Rally Back Toward Record Highs,” Jul 02, 2025, forbes.com.
- [3] The Wall Street Journal, “U.S. Natural Gas Picks Up Ahead of Storage Data,” Dec 10, 2025, wsj.com.
- [4] MarketWatch, “Natural-gas prices soar as temperatures drop,” Jan 20, 2026, marketwatch.com.
- [5] The Wall Street Journal, “U.S. Natural Gas Futures Gain Ahead of Delayed Storage Data,” Dec 29, 2025, wsj.com.
- [6] The Wall Street Journal, “U.S. Natural Gas Extends Pullback on Shifting Weather Outlook,” Dec 09, 2025, wsj.com.
- [7] The Wall Street Journal, “U.S. Natural Gas Futures Extend Decline,” Dec 12, 2025, wsj.com.
- [8] CNBC, “This commodity has re-entered an upward trend,” Nov 10, 2025, cnbc.com.
- [9] Reuters, “US natgas prices gain over 2% on mid-July heat forecasts,” Jul 02, 2025, reuters.com.
- [10] The Wall Street Journal, “U.S. Natural Gas Futures Extend Losing Streak,” Dec 15, 2025, wsj.com.
- [11] The Wall Street Journal, “U.S. Natural Gas Futures Slip in Choppy Trade,” Feb 19, 2026, wsj.com.
- [12] The Wall Street Journal, “U.S. Natural Gas Futures Post Daily Gain, Weekly Loss,” Dec 19, 2025, wsj.com.