Fed September Cut Bets Anchor Valuations as S&P 500 (SPX) Hovers Near Record Highs
The S&P 500 is hovering near record territory as it approaches a 166-day seasonal window that has delivered consistent gains over the past decade, sharpening focus on whether breadth and sector leadership can sustain the rally.

Key takeaways
- A 166-day seasonal window for the S&P 500 begins on Mar 5, 2026 and has historically been a strong period for the index.
- Across the past 10 years, this window has been profitable in 100% of cases, with 10 winners and 0 losers.
- The average gain in this stretch has been 7.9%, with a median outcome of 8.48% and a cumulative return of 112% over the decade.
- Intraperiod swings have been meaningful, with some years showing double-digit peak run-ups and double-digit drawdowns before finishing higher.
- The pattern aligns with a long trade direction, but the history of sharp adverse moves means risk management has mattered even in winning years.
- With the index recently setting fresh highs and showing signs of fatigue, the upcoming window could interact with stretched valuations and shifting sector leadership in complex ways.[6][13]
According to historical data from TradeWave.ai, this approaching stretch for the S&P 500 has displayed a distinct seasonal character over the past decade. The next section looks at how that pattern has behaved and how it fits with today’s market backdrop.
Seasonal window
This seasonal window begins on Mar 5, 2026 and spans 166 days. Historically, during this period, S&P 500 has shown a strong upside tendency, with the index advancing in every year of the past decade. With the benchmark last quoted around 6,836, not far from the all-time high set at the end of January, the seasonal backdrop is coming into focus as investors weigh how much further the cycle can run.[6]
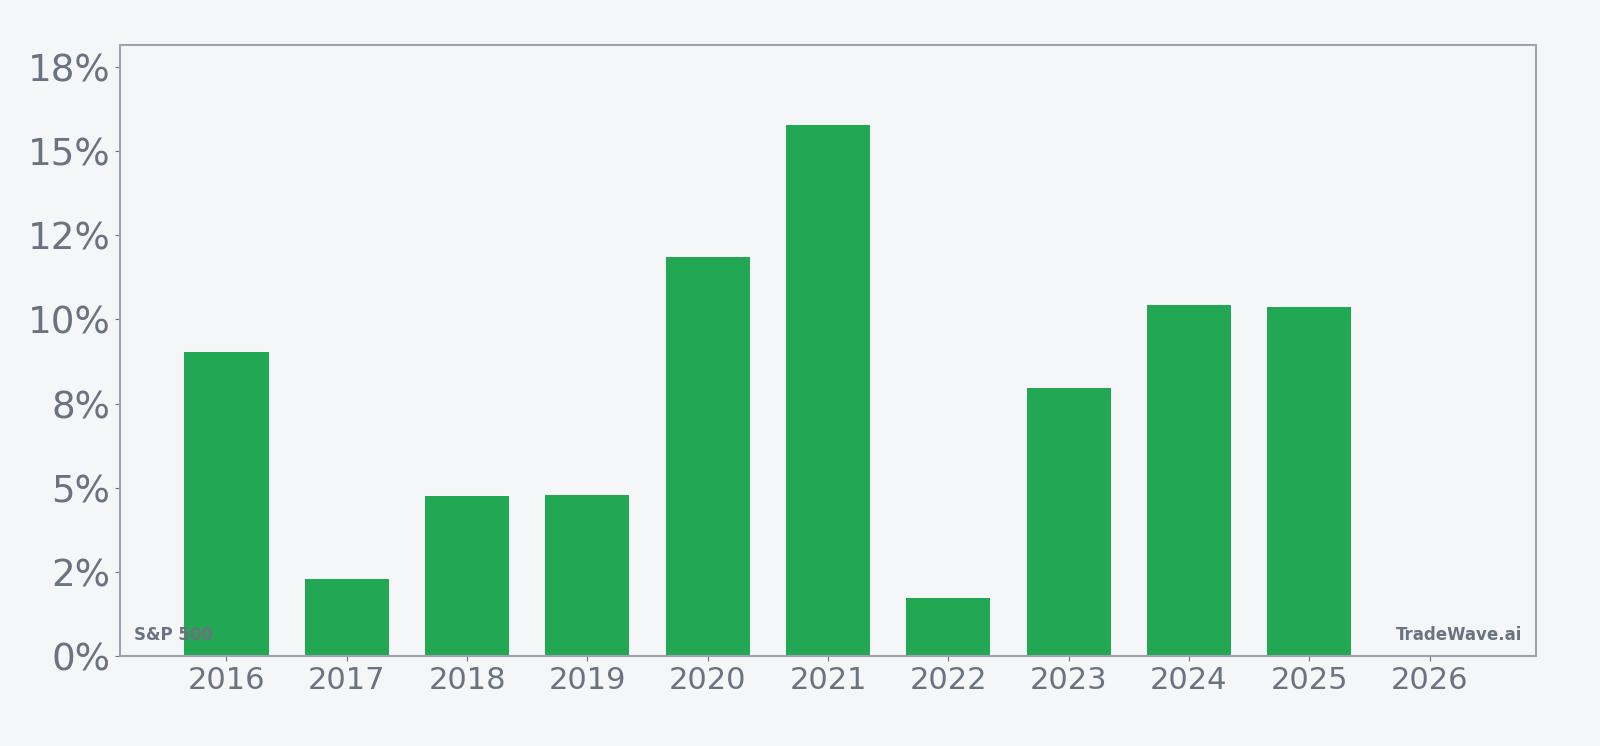
Across the 10-year sample, the long trade direction has aligned with outcomes: the S&P 500 finished higher in this window in every year, with an average gain of 7.9% and a median gain of 8.48%. The cumulative return across all windows totals 112%, and the risk-adjusted profile, as summarized by a Sharpe ratio of 1.36, points to a historically favorable balance between return and volatility for this specific stretch.
The per-year breakdown shows that the strongest outcome came in 2021, when the index gained 15.78% during the window, while the softest year was 2017 with a 2.3% advance. Even in more turbulent periods such as 2020 and 2022, when markets grappled with pandemic shocks and tightening financial conditions, the window ultimately closed in positive territory, though the path was far from smooth.
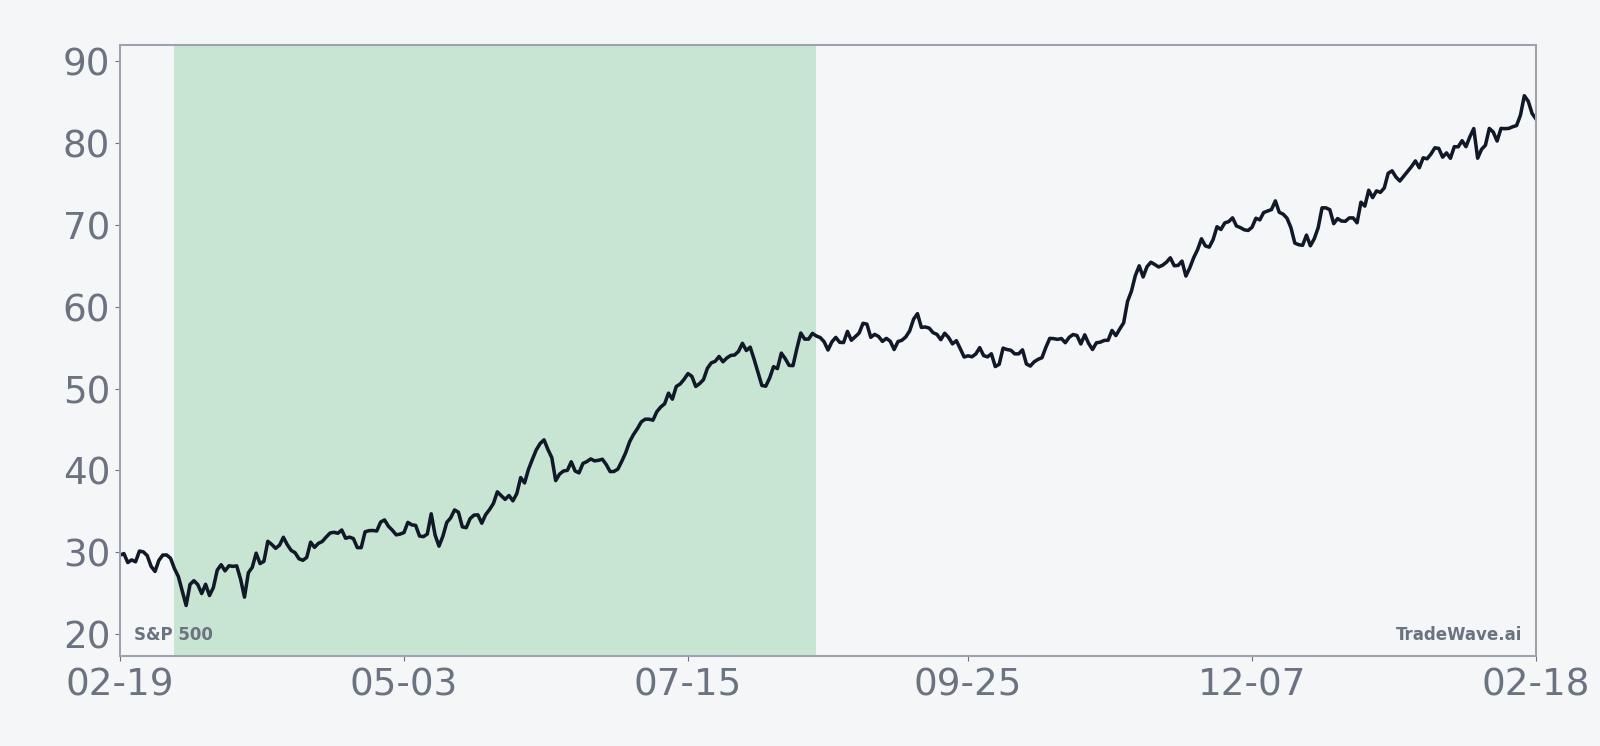
The historical seasonal trend chart suggests that gains in this window have tended to build gradually rather than in a single burst. The average path shows a constructive bias early on, with returns generally accumulating through the middle of the window and consolidating toward the end, a pattern consistent with a steady grind higher rather than a one-way surge.
A closer look at yearly net results alongside peak run-ups and worst drawdowns highlights how upside and downside have interacted within the window.
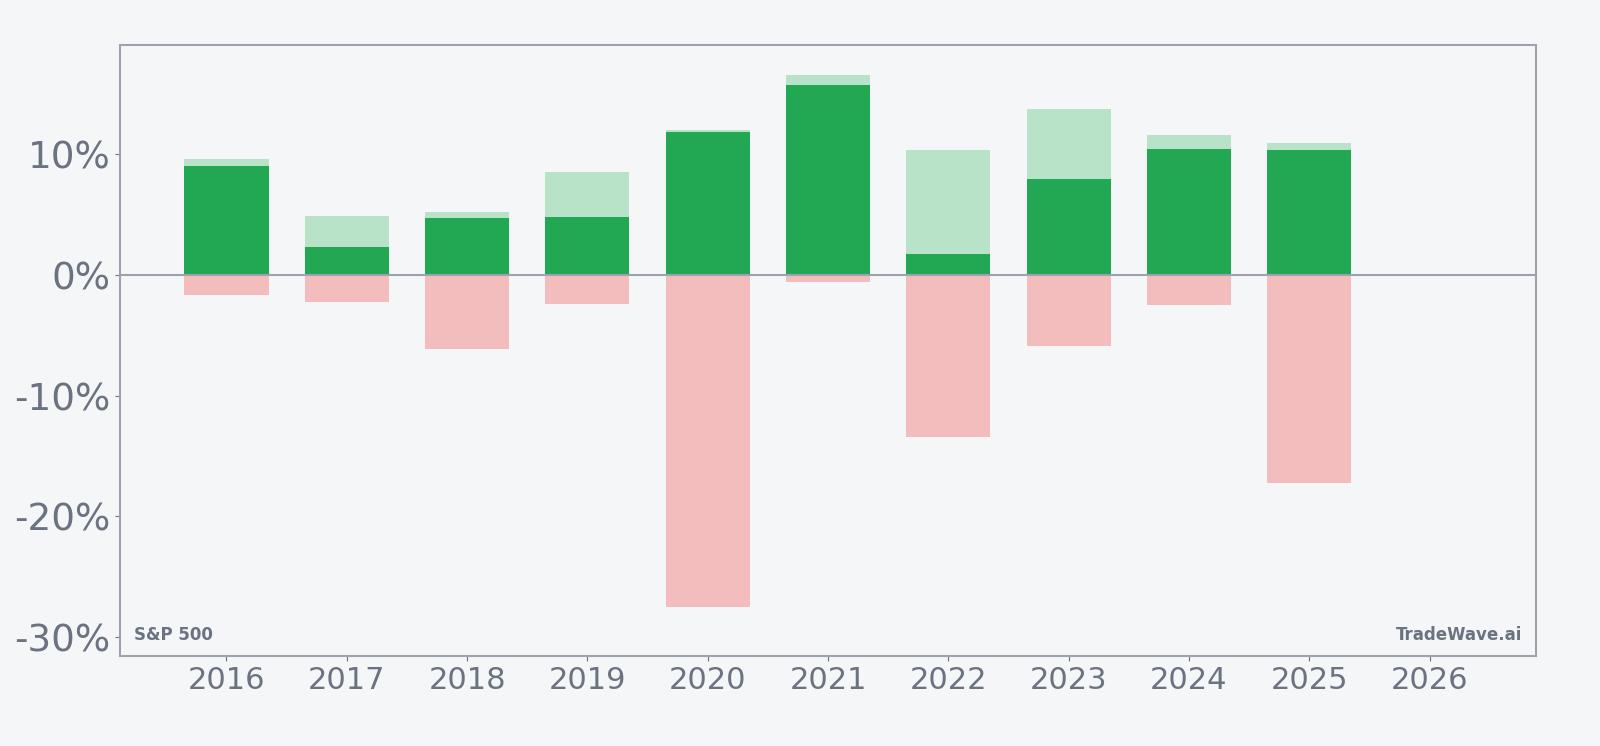
The combined net, MFE and MAE profile underlines that even a consistently profitable window has carried meaningful risk. In 2020, for example, the index ultimately gained 11.84% during the window, but at one point it was down 27.52% from the entry level before recovering, while 2022 saw a modest 1.74% gain despite a worst drawdown of 13.43%. By contrast, 2021 paired a 15.78% net gain with a relatively shallow 0.59% worst drawdown, illustrating how some years have delivered smoother upside than others.
History does not guarantee future results, and the record shows that adverse excursions can be large even in windows that ultimately finish higher.
Taken together, the historical pattern defines the quantitative seasonal backdrop for the upcoming period.
Price and near-term drivers
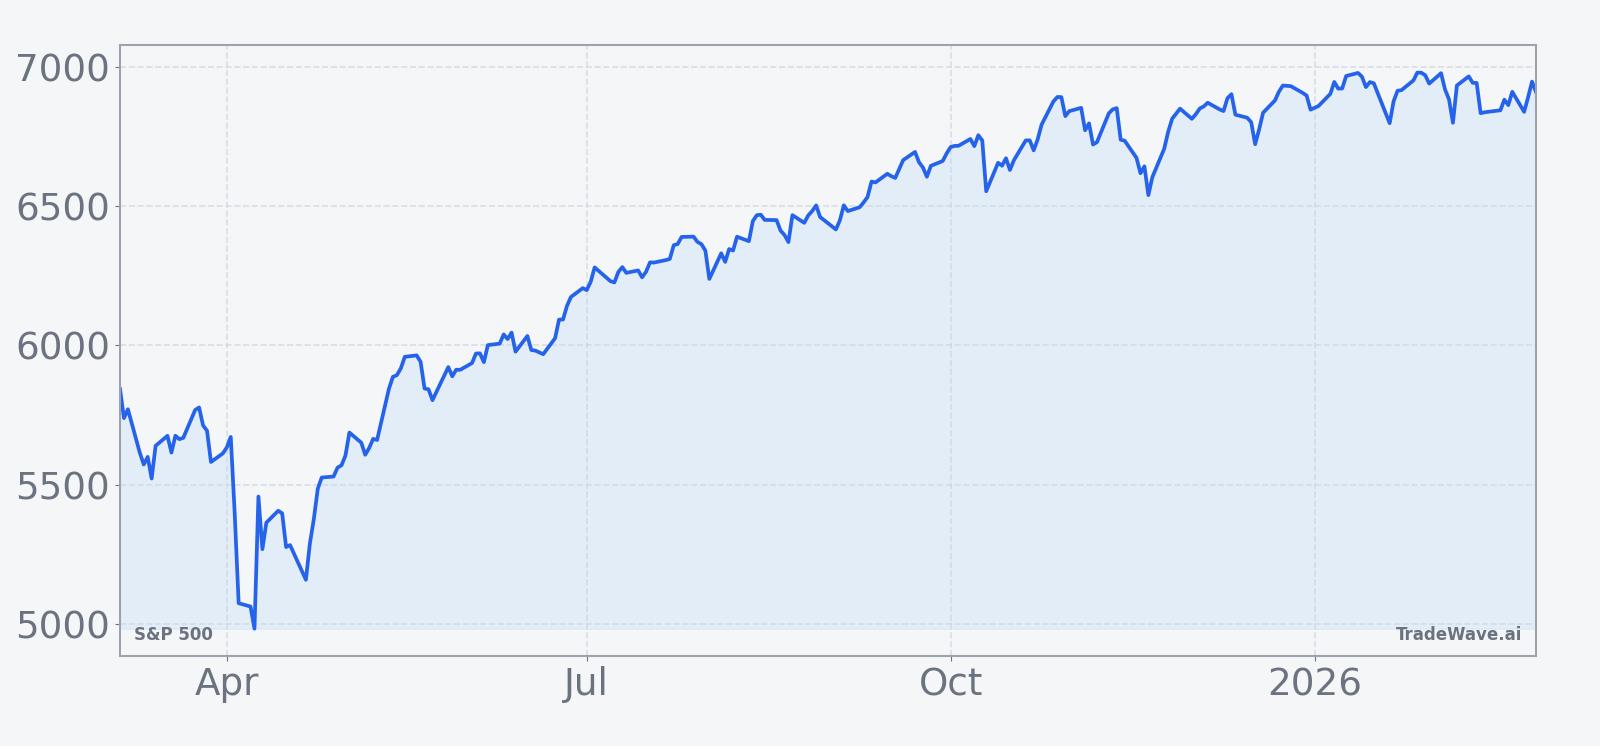
The S&P 500 last closed around 6,836 after a marginal 0.05% gain, extending a powerful run that recently carried the index to a fresh all-time high at the end of January.[6] That move capped a stretch of strength that has left valuations elevated and some technical indicators flashing signs of fatigue, even as the broader trend remains firmly upward.[6][13]
In early February, analysis of the market’s advance highlighted that the new high came with “waning momentum and technical cracks,” including narrower leadership and pockets of weakness beneath the surface.[6] More recent commentary has focused on the concentration of gains in large technology and artificial intelligence beneficiaries, with debate building over whether the current phase represents a durable earnings-driven expansion or a more fragile sentiment-driven surge.[13]
Macro conditions have so far been supportive of risk assets. Expectations for a Federal Reserve interest rate cut in September have remained intact following in-line inflation readings, helping to anchor discount-rate assumptions even as growth data has cooled from earlier peaks.[2] At the same time, strategists have pointed to easing trade uncertainty and tariff pressures as a tailwind for earnings normalization into 2026, a backdrop that has underpinned higher index-level profit forecasts.[3]
Sector performance has been more uneven beneath the headline index. In mid-2025, semiconductor weakness weighed on the broader market and contributed to a marginal weekly loss for major indices, underscoring how sensitive the S&P 500 remains to swings in a handful of mega-cap technology names.[2] Energy, by contrast, has periodically outperformed, particularly around the turn of the year, even as other cyclical pockets such as metals and mining have seen sharp pullbacks.[6] That rotation has left investors watching whether leadership broadens beyond a narrow group of growth stocks as the year progresses.
Market breadth metrics have echoed that tension. While the index has pushed to records, commentary through late 2025 and early 2026 has repeatedly flagged that not all constituents are participating equally, with some analyses describing a divergence between the strongest AI-linked names and more traditional sectors.[8][9][13] For a seasonal window that has historically rewarded long exposure, the durability of the pattern may depend in part on whether participation widens or remains concentrated in a small cluster of winners.
The chart below situates the latest move in its recent multi-month context.
What to watch as the window opens
As the 166-day seasonal window begins in early March, investors will be watching whether the index can translate a historically favorable pattern into further gains against a backdrop of stretched levels and mixed breadth. The long-only bias of the window and its 10-for-10 winning record highlight that, in prior years, pullbacks within this stretch have tended to be opportunities rather than the start of lasting downtrends, but the history of deep intraperiod drawdowns in 2020 and 2022 is a reminder that the path has not always been smooth.
Several concrete markers stand out. First, the behavior of mega-cap technology and AI-related stocks will be critical for gauging whether leadership remains narrow or begins to broaden, particularly given their outsized influence on the index and the debate over whether the current phase represents an “AI bubble” or a more durable investment cycle.[13] Second, upcoming macro data and Federal Reserve communications around the expected September rate-cut path will shape how much support valuations receive from the policy side, especially if inflation or growth data surprise in either direction.[2]
Third, sector rotation and breadth trends will offer an important cross-check on the seasonal script. Historically, the window has tolerated bouts of volatility and still finished higher, but a pattern of repeated failed rallies in lagging sectors or a sustained deterioration in advance/decline measures would argue that the current cycle is diverging from the prior decade’s template.[2][6] Conversely, a broadening of participation beyond the current leaders would be more consistent with the steady, cumulative gains that have characterized many past iterations of this window.
Finally, traders will be monitoring how intraperiod swings evolve relative to the historical profile of large peak run-ups and occasional sharp drawdowns. If volatility spikes early in the window but is followed by a recovery that restores the uptrend, it would echo the pattern seen in years like 2020 and 2022; a break from that behavior, particularly if accompanied by weakening macro support or a reversal in sector leadership, would signal that this cycle may be rewriting the seasonal playbook.[6][13]
Sources
- [1] Yahoo Finance, "PayPal shares drop despite earnings beat and raised guidance" (Jul 29, 2025).
- [2] Seeking Alpha, "Nasdaq slides 1% as chip stocks weigh, with Wall Street posting a marginal weekly loss (SP500)" (Aug 29, 2025).
- [3] Reuters, "Barclays lifts S&P 500 year-end target to 6,050" (Jun 4, 2025).
- [4] Seeking Alpha, "The Most Dangerous Era In History" (Oct 27, 2025).
- [5] Yahoo Finance, "Lucid CEO: 'Not where we want to be' with Gravity SUV ramp" (Aug 6, 2025).
- [6] Seeking Alpha, "The 1-Minute Market Report, January 31, 2026 (NYSEARCA:IVV)" (Feb 1, 2026).
- [7] MarketWatch, "Stock Market News, Nov. 25, 2025: Dow jumps 1.4% as the S&P 500 and Nasdaq clock in three days of gains in a row" (Nov 25, 2025).
- [8] Seeking Alpha, "S&P 500: This Is Unusual, Week Starting 7th July (Technical Analysis) (SP500)" (Jul 6, 2025).
- [9] Seeking Alpha, "S&P 500: The Signals Are Clear (Technical Analysis) (SP500)" (Oct 26, 2025).
- [10] Barchart.com, "Should You Buy The Post-Earnings Plunge In Intel Stock?" (Jul 25, 2025).
- [11] Barchart.com, "UnitedHealth Stock Spirals Lower Again. Don’t Buy The Dip." (Jul 24, 2025).
- [12] Seeking Alpha, "Stocks struggle for direction amid caution ahead of $4.5T options test (SP500)" (Mar 20, 2025).
- [13] Seeking Alpha, "AI Bubble, Tech Funeral? Who Will Fail And Who Will Double Down? (SPX)" (Feb 13, 2026).