Steep Gold Selloff Tests Vaneck Gold Miners ETF (GDX) After 9.89% October Hit
Vaneck Gold Miners ETF is nearing a spring stretch that has delivered consistent gains over the past decade, offering a notable seasonal backdrop after a volatile year for gold and mining shares.

Key takeaways
- Vaneck Gold Miners ETF (GDX) enters a 44-day seasonal window starting Mar 2 that has historically been strongly positive for long positions.
- Across the past 10 years, this window was profitable in 100% of cases, with 10 winners and 0 losers.
- Average profit in winning years was 13.52%, with a cumulative gain of 248% over the sample.
- The pattern shows a TradeWave Ratio of 2.07, indicating substantial typical travel in the trade direction within the window.
- Intraperiod swings have been meaningful, including a year with a sharp adverse move before recovering, underscoring the need to respect drawdown risk.
- The window arrives after a year in which gold miners outpaced bullion but also absorbed abrupt pullbacks tied to bullion’s volatility.[1][2][3]
According to historical data from TradeWave.ai, this upcoming stretch for Vaneck Gold Miners ETF has shown a distinct seasonal tendency over the past decade, providing a quantitative backdrop for investors watching gold-miner exposure.
Seasonal window
This seasonal window begins on Mar 2, 2026 and spans 44 trading days. Historically, during this period, Vaneck Gold Miners ETF has shown a strong upside tendency for long positions, with gains in every year of the past decade.
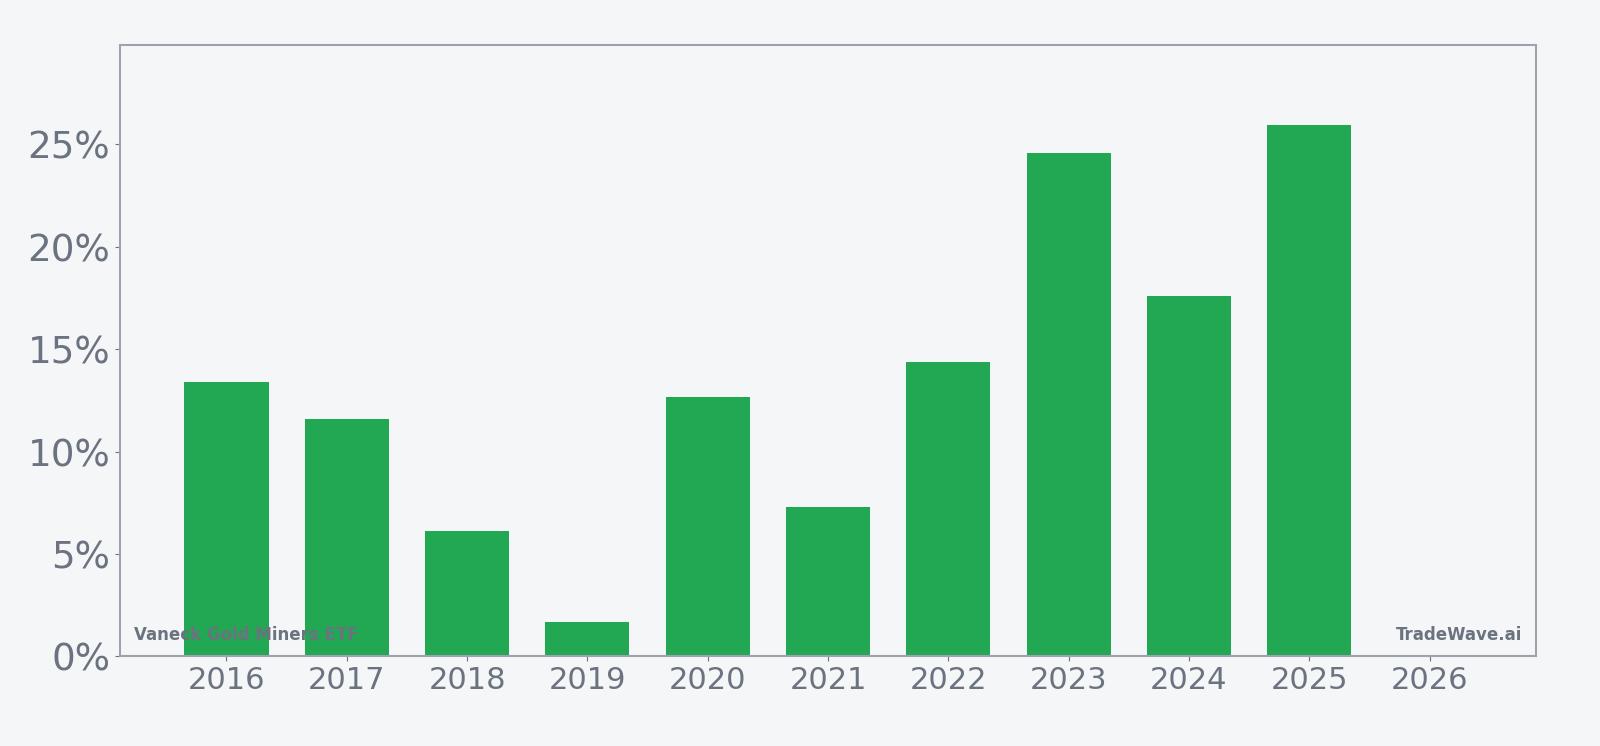
Across the 10-year sample, the pattern’s long trade direction is clear: every instance produced a positive net return, with an average gain of 13.52% and a cumulative return of 248%. The median outcome, at 13.03%, sits close to the average, suggesting that results have clustered around a solid double-digit advance rather than being driven solely by a single outlier year.
The strongest year in the sample was 2025, when the window produced a net return of 25.96% from an entry price of 39.4237 to an exit price of 49.6593. At the other end of the spectrum, 2019 delivered the weakest gain at 1.69%, with GDX moving from 20.1381 to 20.4791 over the same 44-day span. Even in that softer year, the pattern still finished in positive territory, which helps explain the 100% win rate for this window.
Intraperiod behavior has been more volatile than the smooth end-of-window results might suggest. Maximum favorable excursions, or peak run-ups within the window, have often exceeded the final net gains, with several years showing rallies in the mid- to high-teens before consolidating. At the same time, maximum adverse excursions, or worst drawdowns from the entry, have varied widely, including a notable case in 2020 when GDX experienced a drawdown of -40.71% within the window before ultimately closing the period with a 12.68% gain.
The historical seasonal trend profile indicates that gains often build over the course of the window rather than arriving in a single burst. Years such as 2016, 2022 and 2023, which posted net returns of 13.38%, 14.36% and 24.57% respectively, combined meaningful intraperiod rallies with relatively contained adverse moves, suggesting that when the pattern is working, strength can persist across much of the 44-day span.
Year-by-year net returns and intraperiod swings help frame how much GDX has tended to move, and how bumpy the ride has been, inside this window.
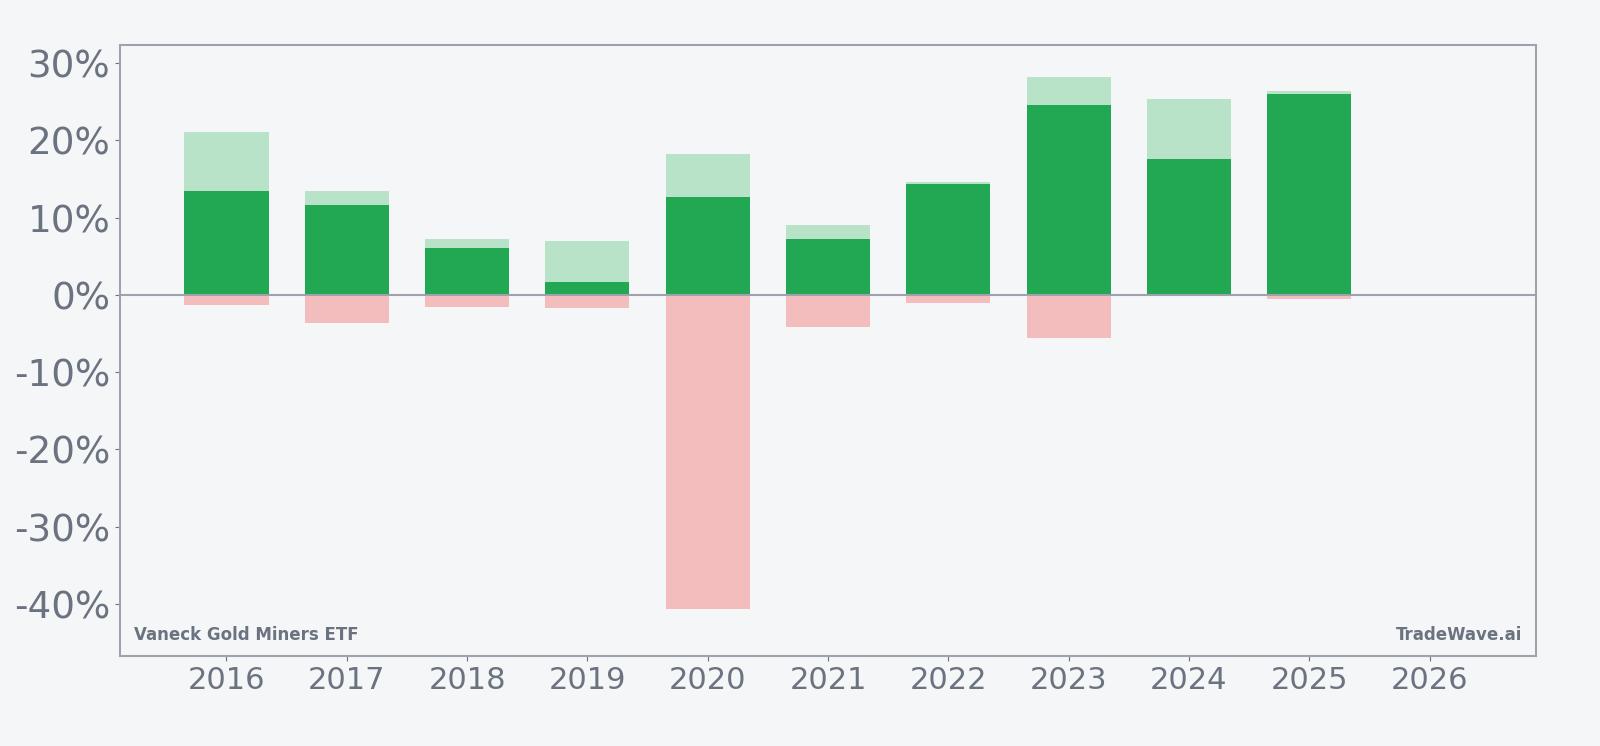
The combined net, maximum favorable excursion and maximum adverse excursion profile shows that this has historically been a high-energy but ultimately constructive period for GDX: upside moves have often been substantial, yet several years featured meaningful drawdowns along the way, including one extreme shock that still resolved in a positive finish. Taken together, the historical pattern defines the quantitative seasonal backdrop for the upcoming period.
History does not guarantee future results, and adverse excursions can be large even in windows that ultimately finish higher.
Price and near-term drivers
Heading into this seasonal window, GDX is coming off a year marked by sharp swings in bullion and mining shares rather than a smooth trend. On Oct 21, 2025, gold prices suffered their steepest one-day drop since 2013, dragging gold-mining stocks and GDX lower in tandem as the ETF absorbed a near-10% hit alongside bullion’s slide.[1]
That shock followed an earlier pullback on Oct 10, 2025, when gold and gold miners endured a sizable one-day retreat that some analysts framed as a shakeout within a still-intact longer-term uptrend for the group.[2] The combination of those moves underscored how quickly sentiment can reverse in the space, even when the broader narrative around gold and miners remains constructive.
Despite those setbacks, gold-mining stocks and ETFs such as GDX outperformed physical gold over the course of 2025, reflecting the sector’s operating leverage to bullion prices and investors’ willingness to use miners as a higher-beta way to express a gold view.[2][3] That outperformance, however, left positioning vulnerable to bouts of profit-taking when bullion stumbled, as the October episodes illustrated.
ETF-specific flow data for GDX are limited in the current snapshot, but the broader pattern in 2025 pointed to renewed interest in gold-related vehicles as investors sought hedges against macro uncertainty and currency volatility.[3] Within that context, GDX has functioned as a liquid, diversified way to access a basket of global gold miners, amplifying moves in the underlying metal while spreading single-company risk across the portfolio.
Structurally, Vaneck Gold Miners ETF tracks a market-cap-weighted index of global gold-mining companies, giving investors exposure to producers whose revenues and margins are tightly linked to bullion prices.[3] That design means the fund can outperform physical gold in rising-price environments, as operating leverage and cost structures translate incremental bullion gains into larger percentage moves in miners’ earnings and share prices.
At the same time, the ETF’s sensitivity to gold price shocks was on full display during the October 2025 downdrafts, when bullion’s abrupt decline translated into outsized losses for mining shares.[1][2] For investors, that dynamic highlights the trade-off between using GDX as a leveraged play on gold and the need to manage the higher volatility that comes with equity exposure to the commodity cycle.
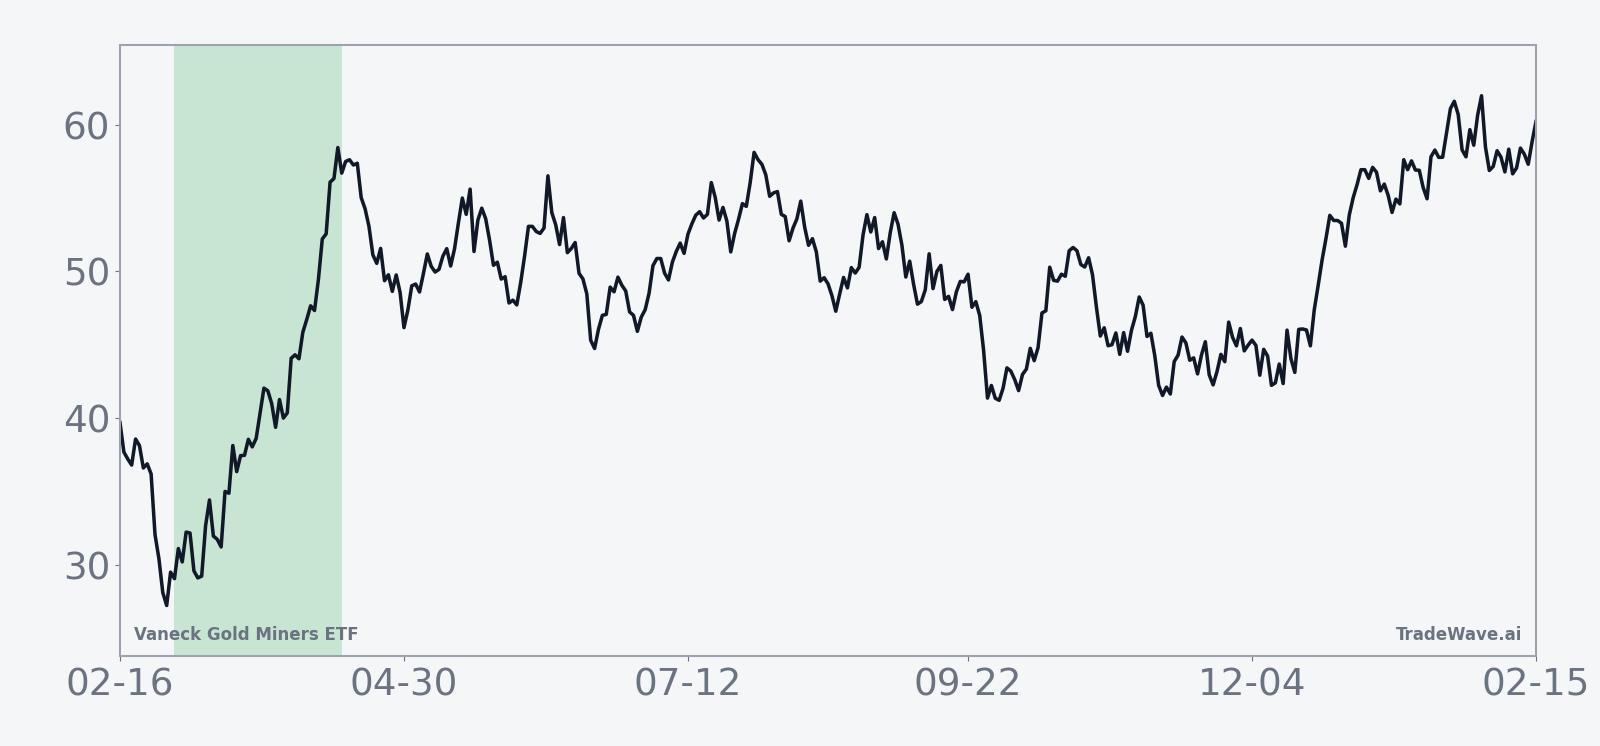
The chart below situates GDX’s recent swings against its broader 12-month trading range.
Macro backdrop and exposure profile
The macro environment around gold remains central to how GDX trades. In October 2025, the nearly 9.89% drop in gold prices in a single session underscored how sensitive the metal is to shifts in interest-rate expectations, real yields and the dollar, all of which feed directly into miners’ equity valuations.[1] When real yields rise or the dollar strengthens, gold often comes under pressure, and GDX tends to magnify that move.
Conversely, periods of falling real yields, rising inflation concerns or heightened geopolitical risk have historically supported bullion and, by extension, gold miners. In 2025, that mix helped miners outperform physical gold over the year, as investors looked beyond spot prices to the earnings leverage embedded in producers’ cost bases and reserve profiles.[2][3]
Because GDX holds a diversified basket of mining companies, its performance also reflects company-specific factors such as production costs, reserve quality, jurisdictional risk and capital-allocation decisions. However, the October 2025 episodes showed that macro forces can overwhelm idiosyncratic stories in the short term, with broad-based selling across the sector when bullion slumps.[1][2]
For asset allocators, GDX sits at the intersection of commodity and equity risk. It can serve as a tactical tool for expressing a view on gold with more upside potential than a bullion-backed ETF, but it also introduces equity-market beta and operational risk. That dual exposure is part of what makes the upcoming seasonal window noteworthy: the historical pattern has played out across a range of macro backdrops, including both supportive and challenging environments for gold.
How the seasonal pattern fits the current setup
The fact that this 44-day window has been profitable in all 10 years of the sample stands out, particularly given the sector’s reputation for volatility. The period includes years like 2020, when a severe intraperiod drawdown still resolved in a double-digit gain, as well as more straightforward advances such as 2023 and 2025, when GDX climbed 24.57% and 25.96% respectively within the window.
At the same time, the presence of large adverse excursions in some years is a reminder that the path to those gains has not always been smooth. The 2020 pattern, with a -40.71% worst drawdown before finishing higher, illustrates how quickly conditions can deteriorate even inside a historically favorable window. For traders and investors, that history argues for treating the seasonal tendency as context rather than a guarantee.
From a flows perspective, the window’s track record suggests that periods of renewed interest in gold and miners have often coincided with this early-spring stretch. Whether that reflects recurring macro catalysts, portfolio-rebalancing patterns or other structural drivers is difficult to isolate, but the consistency of the outcome across different years and environments is notable.
Relative to bullion-focused products, GDX’s seasonal strength in this window may also reflect the way investors time their exposure to mining equities. In years when gold has already moved, miners can become a preferred vehicle for adding or trimming risk, and the historical pattern hints that such positioning shifts have tended to favor the ETF during this specific 44-day span.[3]
What to watch as the window opens
As the Mar 2 window approaches, investors will be watching how GDX trades around key macro catalysts for gold, including shifts in interest-rate expectations, inflation data and dollar moves. Sustained strength in bullion would align with the historical pattern’s positive bias, while a renewed bout of selling similar to the October 2025 episodes would test how resilient the seasonal tendency is in a more challenging tape.[1][2]
Within the ETF itself, flows and volume will be important signals. A pickup in trading activity and net inflows into gold-miner funds would suggest that investors are leaning into the space again, potentially reinforcing the historical pattern, whereas persistent outflows could blunt the typical seasonal tailwind.[3]
Price-wise, traders will be monitoring how GDX behaves on pullbacks inside the window, given the history of sizable intraperiod drawdowns in some years. A pattern of shallow, bought dips would be more consistent with the stronger historical outcomes, while deeper, persistent declines would echo the more volatile years in the sample and could signal that macro forces are overpowering the seasonal backdrop.
Finally, relative performance versus physical gold and bullion-backed ETFs will be a key reference point. If miners continue to outperform bullion as they did through much of 2025, it would reinforce the idea that investors are using GDX as a higher-beta expression of gold views; if that relationship reverses, it could indicate a shift toward more defensive positioning in the precious-metals complex.[2][3]
Sources
- Seeking Alpha, “Gold mining stocks sink as bullion suffers sharpest drop in over a decade,” Oct 21, 2025.
- MarketWatch, “Gold and gold miners suffered a big one-day retreat. Why it’s still not time to sell,” Oct 10, 2025.
- The Motley Fool, “The Gold Rush Continues: GDX's Amplified Bet vs. GLD's Steady Hold,” Jan 25, 2026.