Cardinal Health (CAH) Bets $1.9 Billion on Solaris Health to Drive Specialty-Care Growth
Cardinal Health is nearing a midterm-year seasonal stretch that has been consistently positive in past cycles, adding context to a stock already up about 22% year to date.

Key takeaways
- Cardinal Health enters a 42-day seasonal window on Feb 5 that has historically been strongly positive in midterm election years.
- The pattern is based on the last 10 midterm election years and has a long trade direction.
- Across those 10 years, the window was profitable 100% of the time, with 10 winners and 0 losers.
- Average profit across all years in the window was 9.4%, with a Sharpe ratio of 2.55 and a TradeWave Ratio of 2.45.
- Historical best and worst intraperiod moves show meaningful upside swings alongside occasional drawdowns, underscoring the need to monitor risk even in a strong pattern.
- The setup arrives as CAH trades around $211 and is up about 22% year to date, framing the seasonal window against an already strong price backdrop.
According to historical data from TradeWave.ai, this upcoming stretch for Cardinal Health sits inside a well-defined election-cycle pattern for the stock. The next section looks at how this specific midterm-year window has behaved in prior decades and what that context may signal for the weeks ahead.
Seasonal window
This seasonal window begins on Feb 5, 2026 and spans 42 trading days. Historically, during this period, Cardinal Health has shown a strong upside tendency in midterm election years, with the pattern grouped across the last 10 such cycles rather than consecutive calendar years. Today the stock closed at $211.23, up about 0.4% on the session and roughly 22% higher year to date, so the window is approaching against the backdrop of an already solid advance.
Grouping performance by the presidential election cycle matters here because policy, regulation and reimbursement expectations for healthcare distributors often shift with the political calendar, and midterm years can feature different legislative and budget dynamics than election or pre-election years. In this case, the pattern phase is the midterm election year, while the calendar is still in the year after the presidential election, which means investors are looking ahead to how this mid-cycle environment has historically set up CAH as markets transition toward the next pre-election year.
Within this framework, the trade direction for the pattern is long, and the historical record across the last 10 midterm election years shows that every instance of this 42-day window finished positive. Percent Profitable stands at 100%, with 10 winners and 0 losers, and the average profit across all years in the sample is 9.4%, which is also the average outcome for winning years because there were no losing ones. That consistency does not imply certainty, but it does highlight that in prior midterm cycles this particular stretch has tended to reward long exposure rather than fade it.
The distribution of outcomes by year shows both strong and more modest advances. The best-performing instance in the sample was 1986, when the window produced a net return of 15.39%, while 1990 marked the weakest gain at 2.41%. In between, years such as 1994 and 2014 each delivered 12.36% net returns, and more recent midterm years like 2018 and 2022 saw gains of 8.78% and 8.85% respectively. The pattern therefore reflects a cluster of mid-to-high single-digit advances with several double-digit outliers on the upside.
Intraperiod behavior has also been constructive in prior cycles. The maximum favorable move, or best point-to-peak excursion during the window, has often exceeded the final net gain, with examples such as a 23.08% peak run-up in 1986 and 13.82% in 2018. At the same time, the maximum adverse move, which captures the worst drawdown from the entry during the window, has generally been contained but not negligible, ranging from near-flat readings in 1986 and 1994 to deeper pullbacks of around 4.25% in 2002 and 3.02% in 2018. That mix suggests a pattern where upside has historically dominated, yet investors have still had to sit through occasional mid-window dips.
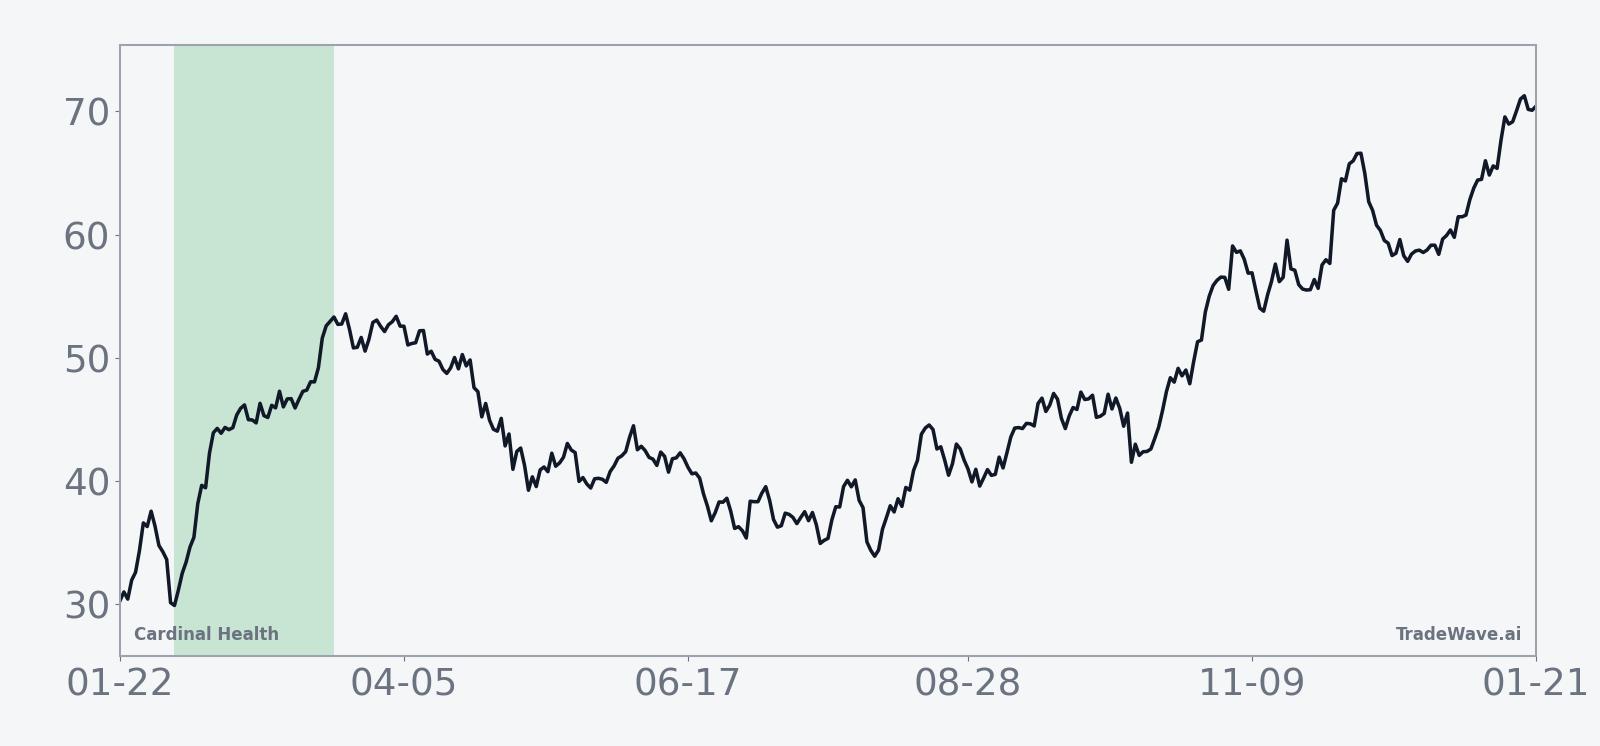
The historical seasonal trend chart for this window shows a relatively steady upward slope across the 42 days, with gains tending to accrue throughout the period rather than arriving in a single burst. In several years, the path has featured a modest early consolidation followed by a more persistent climb into the latter half of the window, which aligns with the idea that midterm-year policy and earnings visibility can improve as the quarter progresses. The cumulative return profile across all 10 years reinforces this, with the average path rising in a fairly consistent fashion from entry to exit.
From a risk-adjusted standpoint, the pattern’s Sharpe ratio of 2.55 indicates that the average end-of-window return has been high relative to its variability across years. The TradeWave Ratio of 2.45, which measures how far price typically travels in the trade direction within the window regardless of the final close, points to meaningful intraperiod follow-through in the historical sample. Combined with the maximum favorable and adverse excursions, this suggests that when the window has worked in the past, it has often done so with reasonably strong and sustained moves rather than marginal gains.
A second view of the pattern highlights how yearly net results, best run-ups and worst drawdowns have interacted within the same window.
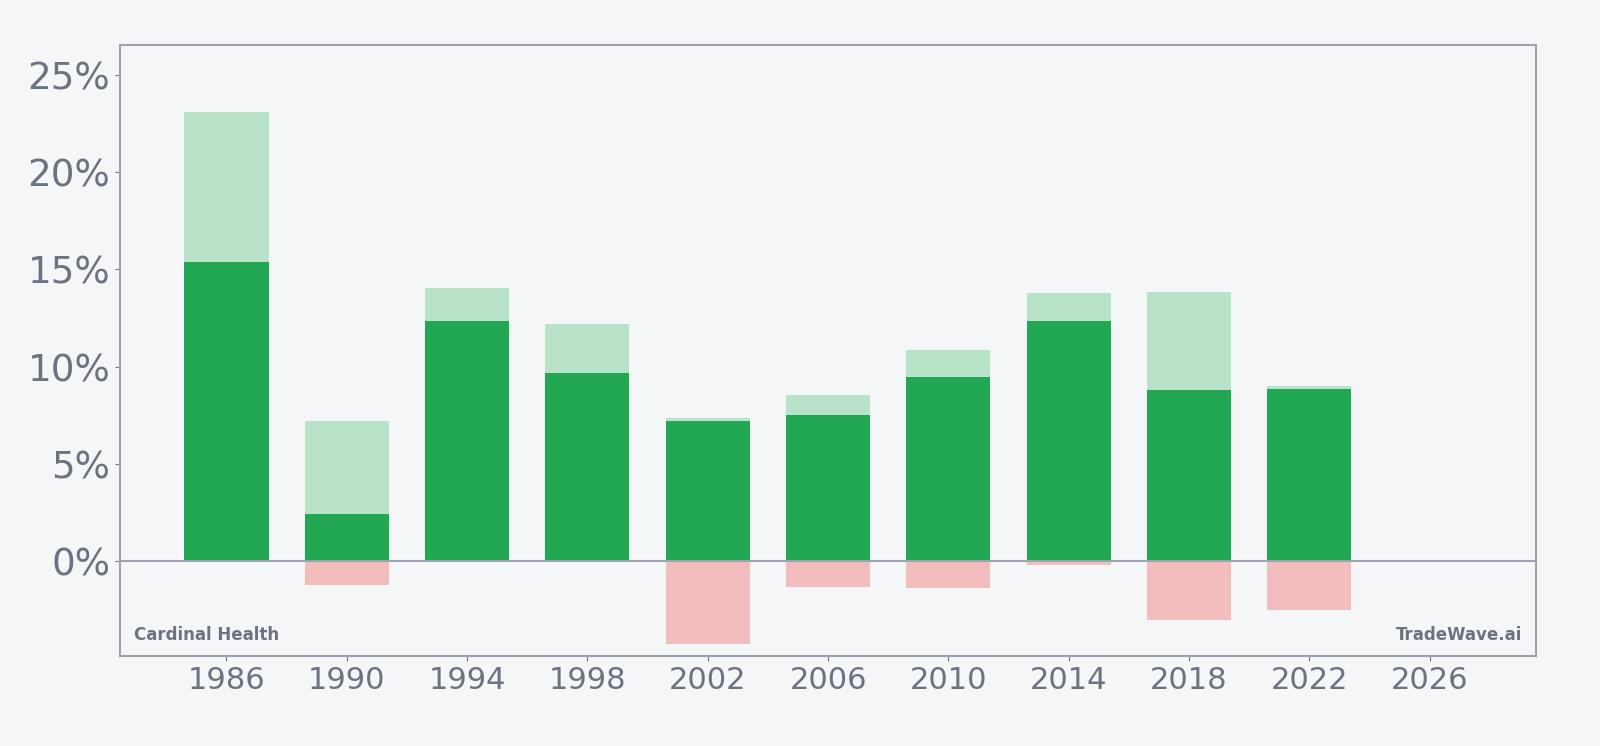
History does not guarantee future results, and even in windows where every past year was profitable, adverse excursions can still be sizable before any recovery.
Taken together, the historical pattern defines the quantitative seasonal backdrop for the upcoming period as Cardinal Health approaches this midterm-year window.
Price and near-term drivers
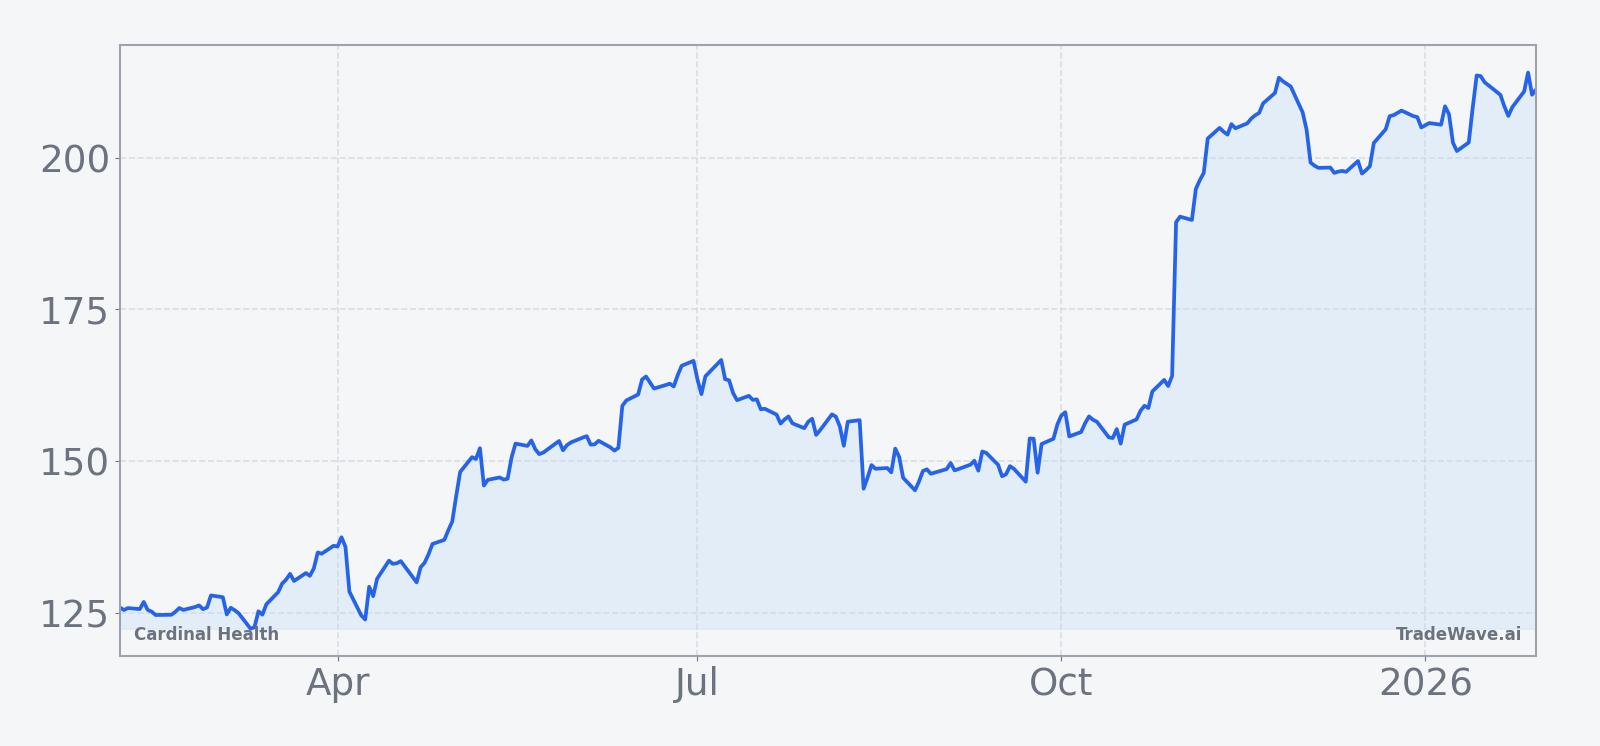
Cardinal Health shares finished Friday at $211.23, up $0.84 or about 0.4% on the day, extending a run that has lifted the stock roughly 22% year to date. The move continues a broader uptrend that accelerated after fiscal 2025 results and strategic updates in the prior year, even though those announcements initially produced a sharp pullback.
On Aug 12, 2025, Cardinal Health reported mixed fiscal fourth-quarter results, with revenue of $60.16 billion coming in slightly below Wall Street’s $60.89 billion estimate but profit edging higher, and the stock dropped 8.9% in response.[1] The company simultaneously announced a $1.9 billion cash deal to acquire Solaris Health, a urology management-services organization, in a bid to deepen its presence in specialty physician services and broaden its healthcare platform.[1] In the months since, investors have weighed the near-term earnings drag and integration risk from the Solaris transaction against the potential for longer-term growth and margin expansion in a higher-value segment of the healthcare supply chain.[2]
Sector-wise, the Solaris acquisition underscored how large distributors are leaning into specialty care and services as reimbursement pressure and generic-drug competition keep traditional distribution margins tight.[2] For Cardinal Health, that strategic pivot has helped frame the stock as a way to gain exposure to procedure-driven urology volumes and practice-management economics, rather than relying solely on volume growth in commoditized drug distribution. As the market looks ahead to the next earnings cycle and any updated commentary on Solaris integration, the approaching seasonal window offers an additional lens on how the stock has tended to behave in similar mid-cycle policy environments.
The chart below situates the latest move in its recent multi-month context.
What to watch as the window opens
With the 42-day midterm-year window set to begin on Feb 5, investors will be watching how Cardinal Health trades relative to its historical pattern. One focal point is whether the stock can maintain its existing uptrend into and through the window, given that prior midterm cycles have typically seen gains build steadily across the period rather than spike and fade.
Policy and budget developments will also matter, particularly around healthcare reimbursement, Medicare and Medicaid funding, and any signals on drug pricing or distribution regulation that could affect margins for large distributors. Midterm years have historically brought shifting expectations on these fronts, which may help explain why this specific phase of the election cycle has produced a distinct pattern for CAH in the past.
From a price-action standpoint, traders may focus on how any early pullbacks inside the window compare with the historical maximum adverse excursions, where prior years occasionally saw drawdowns of several percentage points before recovering. A shallow and short-lived dip followed by renewed strength would be more in line with the historical seasonal profile, while a deeper or more persistent decline would mark a departure from the pattern and could signal that fundamentals or positioning are exerting a stronger influence than the usual midterm-year template.
Finally, upcoming commentary on the Solaris Health integration and any updated financial targets will be key reference points, since the acquisition has become central to Cardinal Health’s strategy in specialty services.[1][2] How management frames that deal, and how the stock responds around those updates during the seasonal window, will help determine whether this midterm-year stretch once again aligns with its historically strong profile or breaks from it.
Sources
- [1] The Wall Street Journal, “Cardinal Health Posts Higher Profit, Enters $1.9 Billion Solaris Health Buy,” Aug 12, 2025.
- [2] The Wall Street Journal, “Cardinal Health Posts Mixed Results, Strikes $1.9 Billion Solaris Health Deal,” Aug 12, 2025.