IBM Trades in Historically Weak Midterm-Year Seasonal Window
IBM is moving through a 20-day midterm-election-year pattern that has often favored downside for the stock, even as it comes off a strong 2025 built on AI, hybrid cloud and quantum momentum.

Key takeaways
- IBM is in a 20-day seasonal window that begins Jan 17 and has historically been a weak stretch for the stock in midterm election years, with a short trade direction.
- Across the last 8 comparable midterm-election-year windows, 88% of outcomes were profitable for the short setup, with 7 winners and 1 loser.
- Average profit in winning years was 7.82%, while the all-years average including the lone losing year was 6%, highlighting a consistent downside bias.
- The pattern’s TradeWave Ratio of 2.88 and Sharpe ratio of 1.38 point to a historically meaningful move in the trade direction with risk-adjusted returns that have been relatively strong for this setup.
- Intraperiod swings have included sizable peak run-ups and drawdowns, so traders watching this window should be aware that adverse moves against the short side have occurred even in years that ultimately finished profitable.
According to historical data from TradeWave.ai, this part of the calendar has shown a distinct pattern for IBM in past midterm election years, and the current stretch is being evaluated against that backdrop rather than in isolation.
Seasonal window
Grouping IBM’s performance by the presidential election cycle shows that the last 8 midterm election years have shared a common pattern in this 20-day window that begins on Jan 17, with the stock tending to weaken during this stretch. IBM is entering the midterm election year in 2026 while this specific window historically reflects behavior seen in prior midterm years, and the pattern is evaluated over that phase rather than across consecutive calendar years.
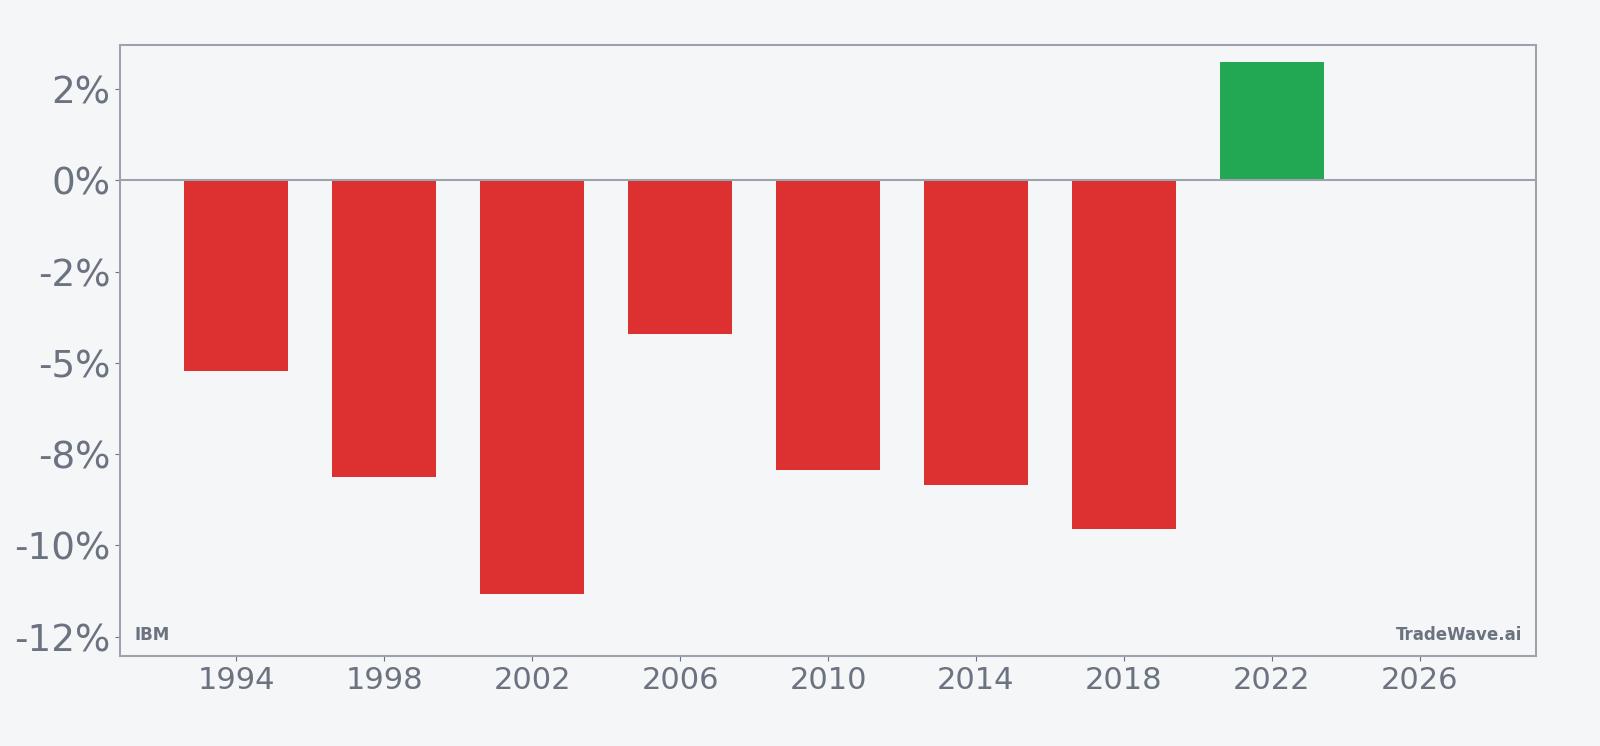
Within this framework, the trade direction is explicitly short, meaning that years in which IBM declined over the window are considered favorable outcomes for the pattern, while sharp rallies represent losing years for the setup. Across the last 8 midterm-election-year samples, 88% of those windows were profitable for the short side, with 7 winners and just 1 loser, and the average gain in winning years was 7.82% compared with a 6% average when all years are included, which indicates that the lone losing year did not fully offset the typical downside drift.
The per-year breakdown underscores how that tendency has played out in practice. In 2002, for example, IBM fell 11.34% over the window, which was a strong year for the short pattern, while 1994 saw a more modest 5.23% decline that still counted as a profitable outcome for the same setup. The only losing year for the short pattern in this sample was 2022, when IBM rose 3.23% over the window, illustrating that the stock can still move against the historical bias in individual cycles even when the broader pattern has favored weakness.
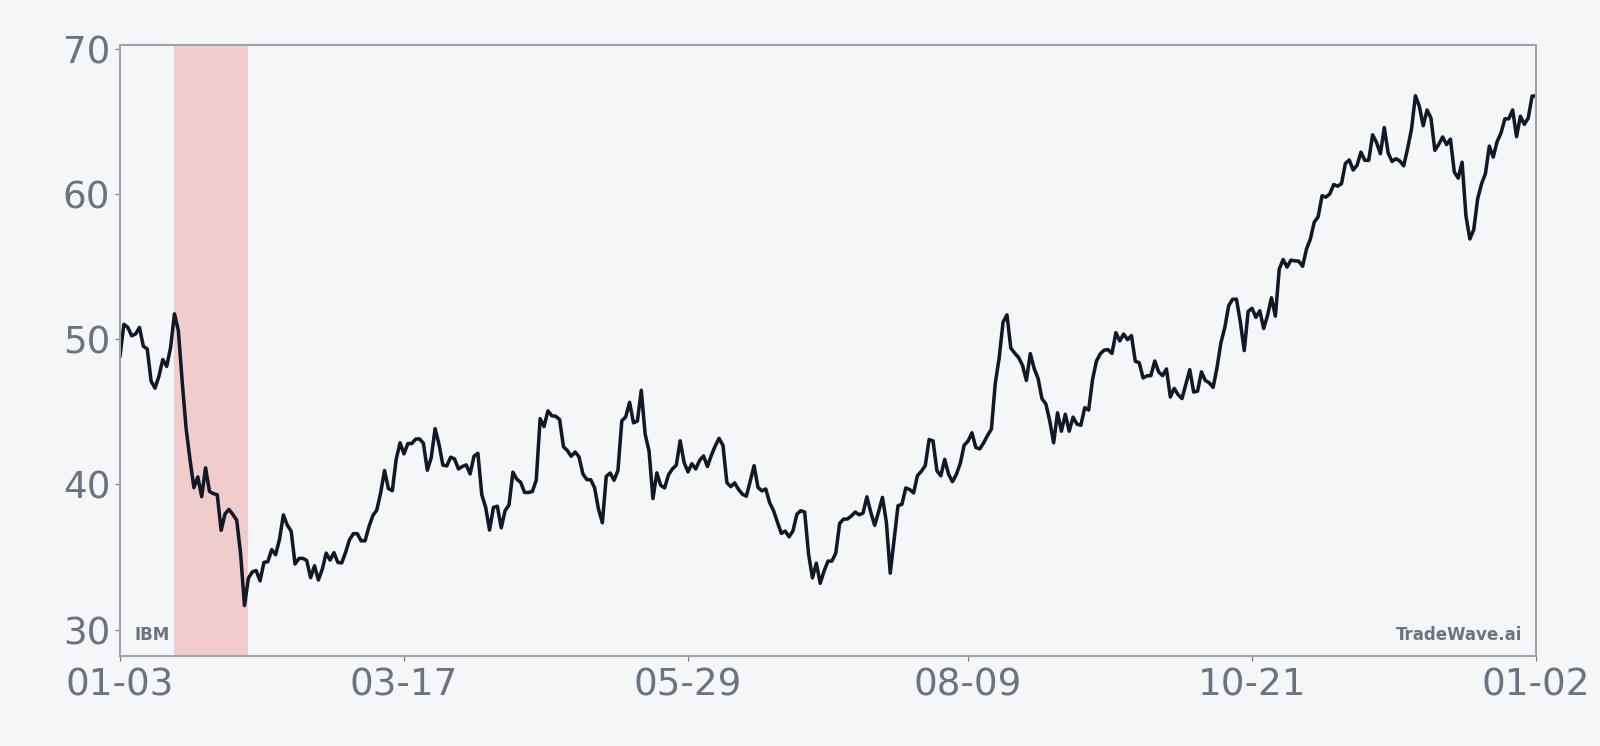
The historical seasonal trend chart for this window shows that, on average, IBM’s returns tend to deteriorate relatively steadily across the 20 trading days, with the bulk of the downside accruing in the middle portion of the window rather than in a single sharp break. That profile is consistent with the pattern’s 63% cumulative return for the short setup across the sample and an annualized return of 6.35%, suggesting that the tendency has been persistent rather than driven by one or two outlier years.
A combined view of net results and intraperiod swings helps clarify how far IBM has typically moved in both favorable and adverse directions during this stretch.
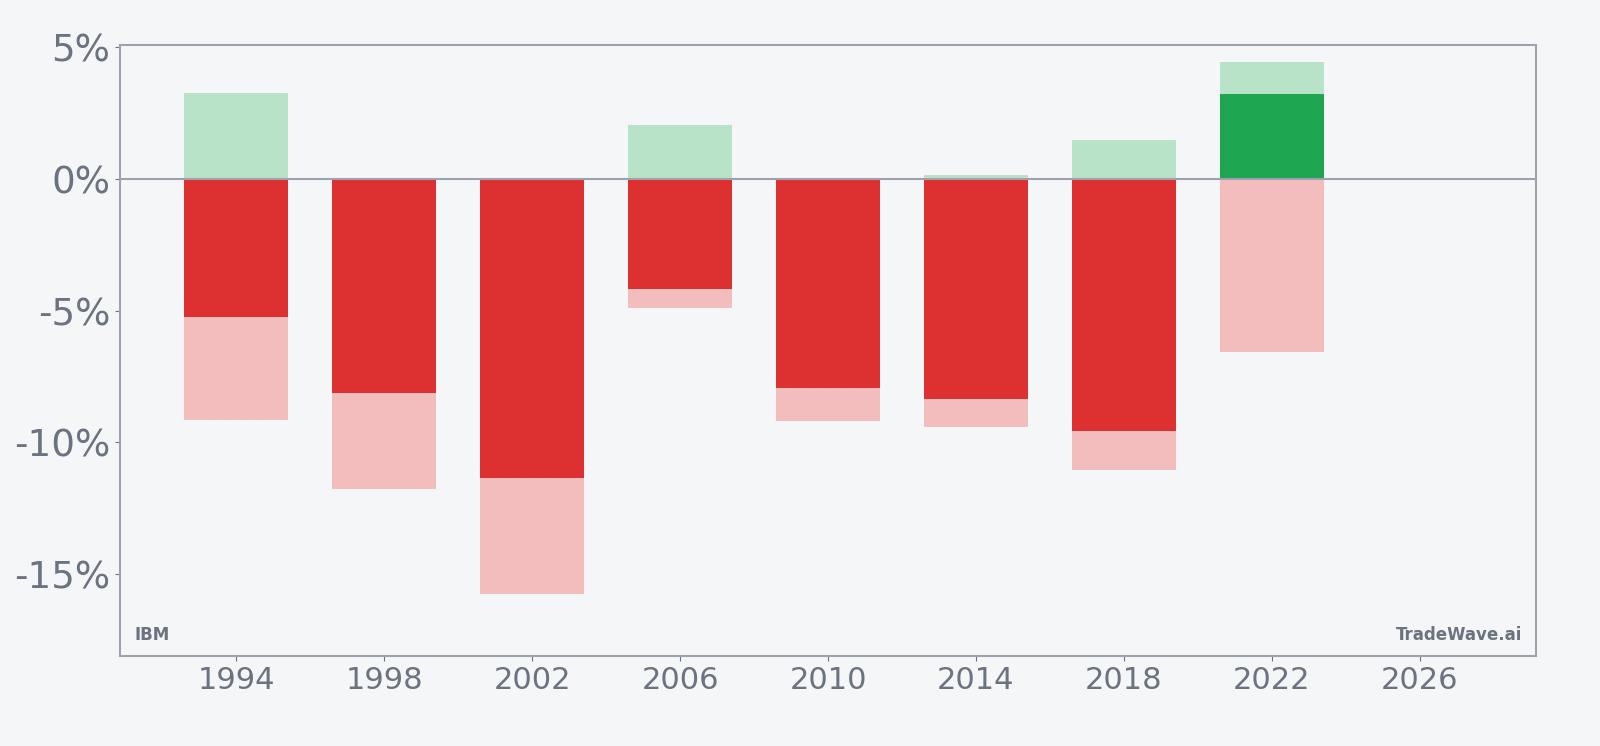
The bars with maximum favorable and maximum adverse excursions show that in many years IBM has experienced sizable intraperiod swings even when the final outcome aligned with the short bias. In 1998 and 2010, for instance, the stock’s worst drawdowns from entry, or maximum adverse excursions, reached roughly the high single digits, while the best point-to-peak moves in the trade direction, or maximum favorable excursions, also extended several percentage points, illustrating that both sides of the tape have seen meaningful volatility inside the window. Taken together, the historical pattern defines the quantitative seasonal backdrop for the current period.
History does not guarantee future results; adverse excursions (MAE) can be large even in winning windows.
Price and near-term drivers
IBM enters this midterm-election-year window after a strong 2025 in which the stock delivered a 32% year-to-date gain through the end of that year, supported by improving fundamentals in AI, hybrid cloud and quantum initiatives.[2] In October 2025, IBM reported third-quarter results that beat Wall Street expectations on both revenue and earnings and raised its full-year revenue growth guidance to more than 5% in constant currency, although the stock reaction at the time was muted as investors focused on the quality and sustainability of that growth.[3]
Earlier in 2025, analysts highlighted IBM’s positioning in AI and hybrid cloud as a key driver of sentiment, even as the stock experienced bouts of volatility around earnings and macro headlines.[2] The company’s integration of Anthropic’s AI models into its software offerings in October 2025 was cited as a catalyst that helped lift the shares, contributing to a double-digit percentage rise over the following month as investors reassessed IBM’s role in enterprise AI spending.[4]
IBM has also leaned on its quantum computing roadmap to differentiate itself within large-cap tech. In September 2025, a successful quantum computing trial with HSBC for bond trading optimization underscored IBM’s progress in turning experimental technology into applied solutions for financial services, and the stock advanced more than 5% following that announcement.[7] Together with steady execution in its core software and consulting businesses, those developments have helped frame IBM as a more growth-oriented story than in prior cycles, even if the market’s response has at times been uneven.[1]
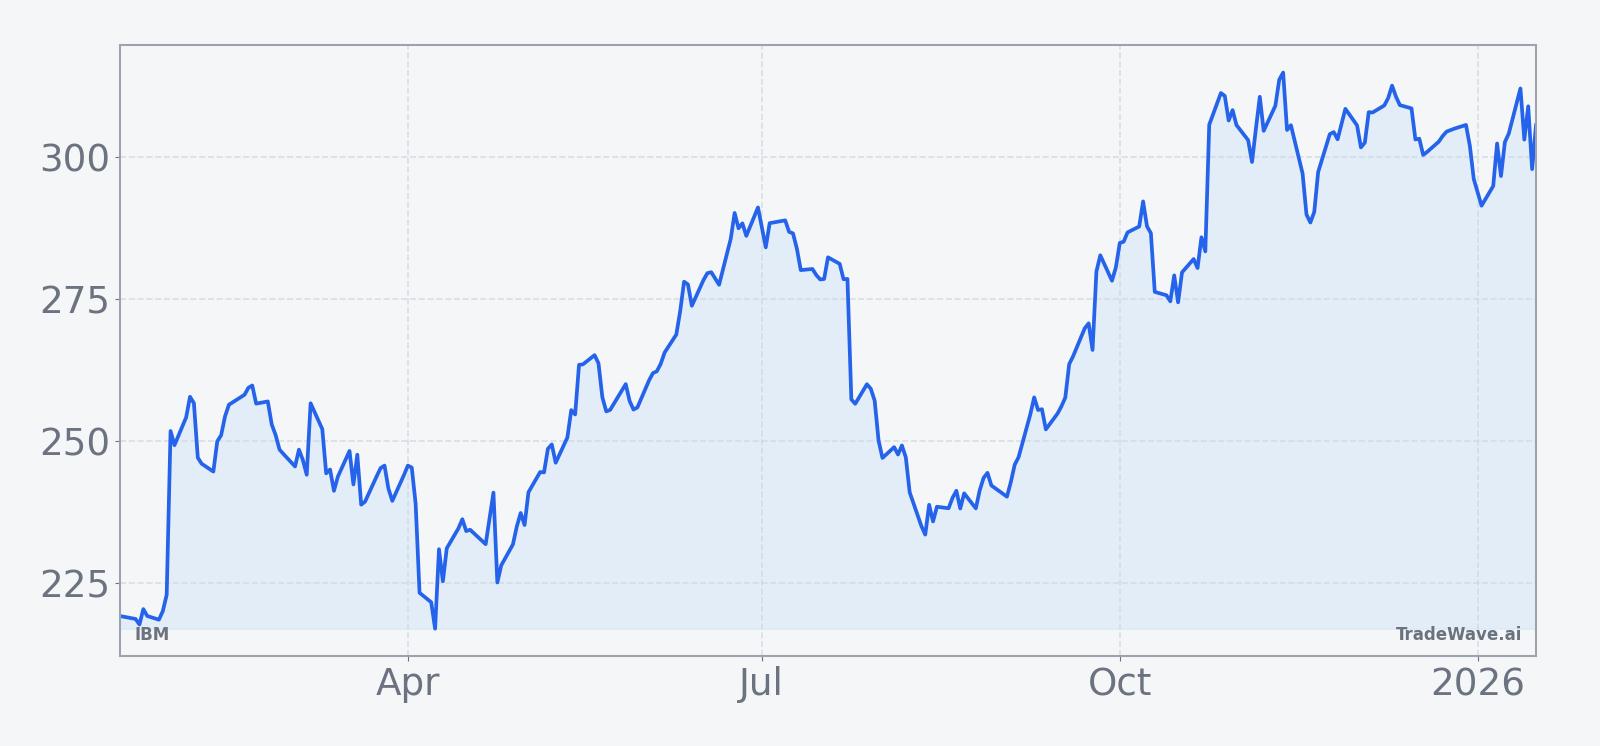
The chart below situates the latest move in its recent multi-month context.
Macro and election-cycle backdrop
The current seasonal analysis is framed within the presidential election cycle, where 2026 marks the midterm election year and 2027 will be the year before the presidential election. Historically, midterm years have often featured more policy uncertainty and episodic volatility as markets digest shifts in fiscal priorities, regulatory agendas and the balance of power in Washington, while the subsequent pre-election year has tended to be more supportive for risk assets as policy paths become clearer.
For IBM, which is deeply tied to enterprise IT budgets and public-sector technology spending, that cycle can matter at the margin. Shifts in government investment in cloud infrastructure, cybersecurity and AI, along with regulatory developments around data privacy and AI governance, can influence demand for IBM’s offerings and the timing of large contracts. The fact that this historically weak 20-day window sits in the early part of the midterm year means it may intersect with a period when corporate and government buyers are still calibrating budgets and waiting for more clarity on the policy calendar.
At the same time, the broader sector narrative around AI and hybrid cloud remains constructive. Analysts in mid-2025 pointed to IBM’s ability to monetize AI workloads and hybrid cloud migrations as a reason some investors were willing to look through short-term volatility in the stock.[2] That tension between a supportive structural story and a historically soft seasonal patch is part of what makes this window notable for traders and portfolio managers tracking IBM’s role within large-cap tech.
What to watch
For the remainder of this 20-day window, traders watching IBM may focus on how the stock behaves around key technical levels established during its 2025 advance and whether intraday swings resemble the historically choppy pattern seen in prior midterm-election-year samples. A drift lower with intermittent rallies that fade, particularly in the middle portion of the window, would be more consistent with the historical short bias, while a sustained upside break similar to 2022 would represent a clear deviation from the pattern.
On the fundamental side, any updates related to large AI or hybrid cloud deals, progress in quantum commercialization, or commentary from management at industry conferences could influence how closely IBM tracks its seasonal template. Investors may also monitor the evolving policy calendar as the midterm election year develops, including signals on technology regulation and public-sector IT spending that could affect sentiment toward enterprise-focused names like IBM.
Because the historical pattern is defined over the last 8 midterm election years, behavior in this window will also help determine whether IBM continues to follow that cycle-based script as markets transition toward the year before the presidential election. A period of contained volatility and limited downside would suggest that the stock’s improved fundamental story is dampening the traditional midterm-year weakness, while a sharper pullback would reinforce the idea that this early-year stretch remains a challenging one for IBM despite its recent operational progress.
Sources
- [1] CNBC, "IBM is trying to rebound after results disappointed initially. What analysts and investors are saying" (Oct 23, 2025)
- [2] MarketWatch, "IBM’s stock is sliding. Here’s why these analysts see an opportunity to buy." (Jul 24, 2025)
- [3] CNBC, "IBM tops third-quarter estimates and lifts guidance, but stock drops" (Oct 22, 2025)
- [4] Forbes, "What’s Happening With IBM Stock?" (Oct 7, 2025)
- [5] MarketWatch, "Why is IBM’s stock down after an earnings beat? Here’s one quibble." (Jul 23, 2025)
- [6] Forbes, "Should You Pick IBM Stock At $250?" (Jan 30, 2025)
- [7] CNBC, "Friday's big stock stories: What’s likely to move the market in the next trading session" (Sep 25, 2025)