Fed Rate Path and Treasury Yield Swings Jolt Outlook for Alliant Energy (LNT)
Alliant Energy is nearing a 73-day stretch that has been consistently positive in past midterm election years, giving investors a structured backdrop as utilities navigate policy, rates and demand.

Key takeaways
- Alliant Energy’s key seasonal window begins on Feb 6, 2026 and runs for 73 trading days, aligned with the early part of the midterm election year in the presidential cycle.
- Across the last 7 midterm election years in this window, the pattern has been long-biased with a 100% win rate, featuring 7 winners and 0 losers.
- Average profit in those winning years was 9.09%, with a cumulative gain of 83% and a median outcome of 8.09% over the window.
- The TradeWave Ratio of 3.73 indicates that price has typically traveled meaningfully in the trade direction within the window, beyond just the end-of-window result.
- Intraperiod swings have included sizable peak run-ups and occasional drawdowns, highlighted by a worst adverse move of 7.28% in 2022 even though that year still finished positive.
- For investors watching utilities into the midterm policy calendar, this pattern offers a structured historical backdrop rather than a forecast or recommendation.
According to historical data from TradeWave.ai, this part of the calendar has shown a distinct seasonal tendency for Alliant Energy in past midterm election years, and the following section unpacks that pattern in detail without making predictions.
Seasonal window
This seasonal window begins on 2026-02-06 and spans 73 days. Historically, during this period, Alliant Energy has shown a strong upward tendency in midterm election years, with every observed instance finishing higher over the window. That backdrop sits alongside the stock’s current trading range and valuation context, giving investors a structured way to think about how policy, rates and sector flows might intersect with the calendar in the months ahead.
Grouping the data by the presidential election cycle matters because utilities often respond to policy and regulatory expectations that move in multi-year waves rather than in isolated calendar years. In the midterm election year, debates over infrastructure, grid investment and environmental rules can intensify, while markets also begin to look ahead to the pre-election year, which has historically been more risk-on for many equities.
In this pattern, the trade direction is long, meaning the historical analysis focuses on gains during the window rather than declines. Across the last 7 midterm election years that match this phase, Alliant Energy finished the window higher every time, producing a Percent Profitable reading of 100% with 7 winners and 0 losers. The average profit across those winning years was 9.09%, with a median outcome of 8.09%, and the cumulative gain across all seven instances was 83%.
The dispersion of outcomes has been relatively contained compared with many single-stock patterns. The standard deviation of end-of-window returns was 3.0%, and the Sharpe ratio, which measures risk-adjusted average return based on end-of-window outcomes, came in at 2.77. That combination points to a pattern where positive results have not only been frequent but also relatively consistent in size.
The TradeWave Ratio (TWR) for this setup is 3.73. TradeWave Ratio (TWR) reflects how far price typically travels in the trade direction within the window regardless of the final close, so a reading at this level suggests that intraperiod rallies have often been meaningfully larger than the simple end-to-end gain might imply.
Looking at individual years helps illustrate the range of behavior. In 2014, the stock gained 12.91% over the window, with a best point-to-peak move, or maximum favorable excursion, of 14.95% and only a shallow worst drawdown, or maximum adverse excursion, of 0.18% from the entry. By contrast, 2022 still finished up 8.09% but experienced a much deeper intraperiod setback, with a worst adverse move of 7.28% before recovering into the close of the window.
Across the seven midterm election years in the sample, maximum favorable excursions have generally been in the low double digits, ranging from 6.38% in 2002 to 14.95% in 2014. Maximum adverse excursions have mostly been modest, often under 2%, with 2022 standing out as the one year where the stock dipped more sharply before ultimately ending the period higher. That profile suggests a pattern where upside has tended to dominate, but where investors still needed to tolerate occasional volatility along the way.
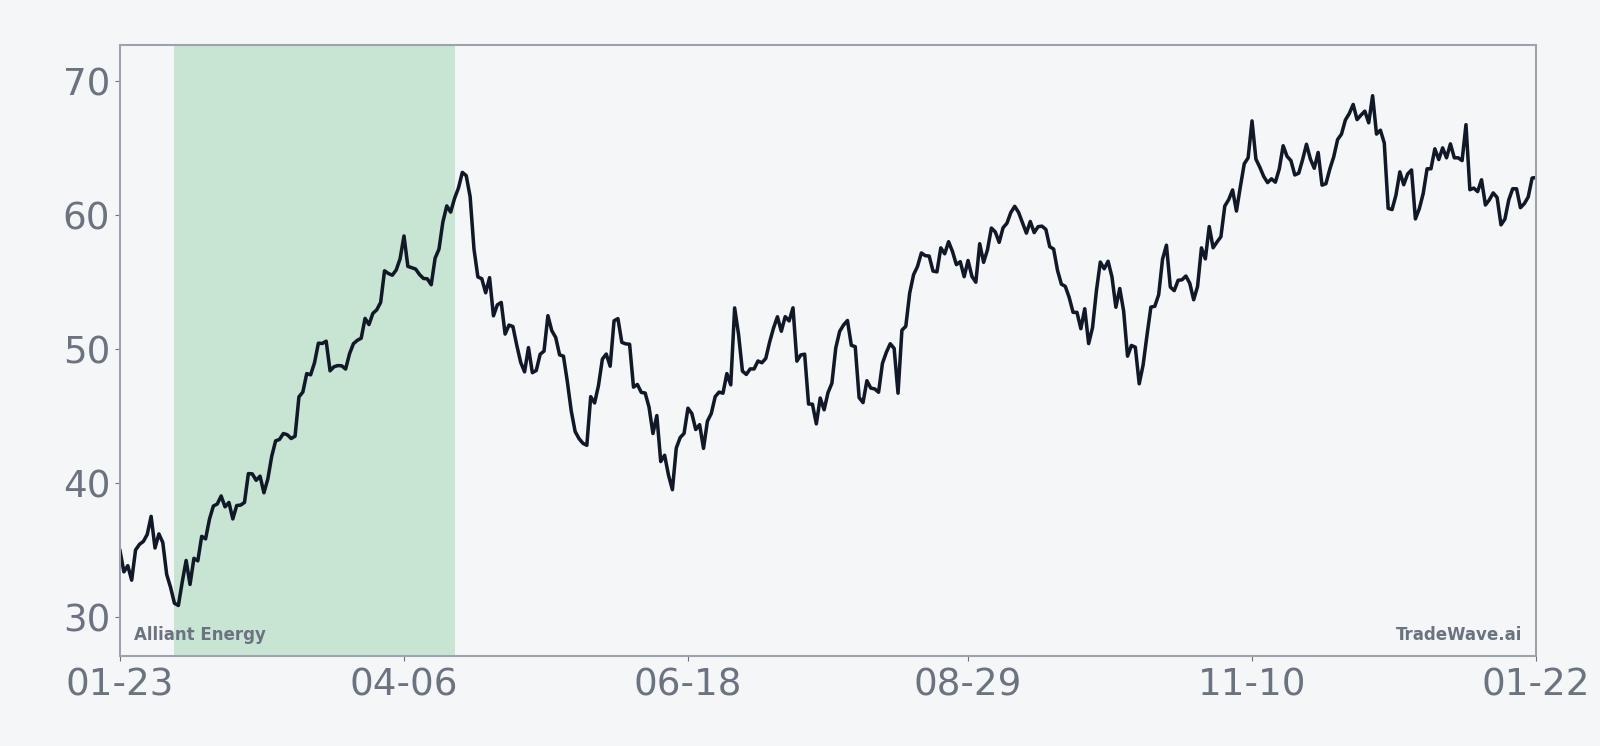
The historical seasonal trend chart for this window shows a relatively steady climb rather than a single explosive burst. On average, gains have tended to accrue across the full 73-day span, with some years front-loading strength and others building more gradually, but without a clear tendency for late-window giveback. The cumulative return curve across cycles reinforces that picture, rising in a fairly consistent fashion as each midterm-year instance adds another positive contribution.
When the yearly net returns are plotted alongside their best and worst intraperiod moves, the pattern looks like a cluster of solid positive bars with upper extensions that capture the peak rallies and smaller, mostly contained lower extensions that capture the drawdowns. The combination of sizable maximum favorable excursions and generally limited maximum adverse excursions is what underpins the strong Sharpe ratio and the all-winner track record in this particular sample.
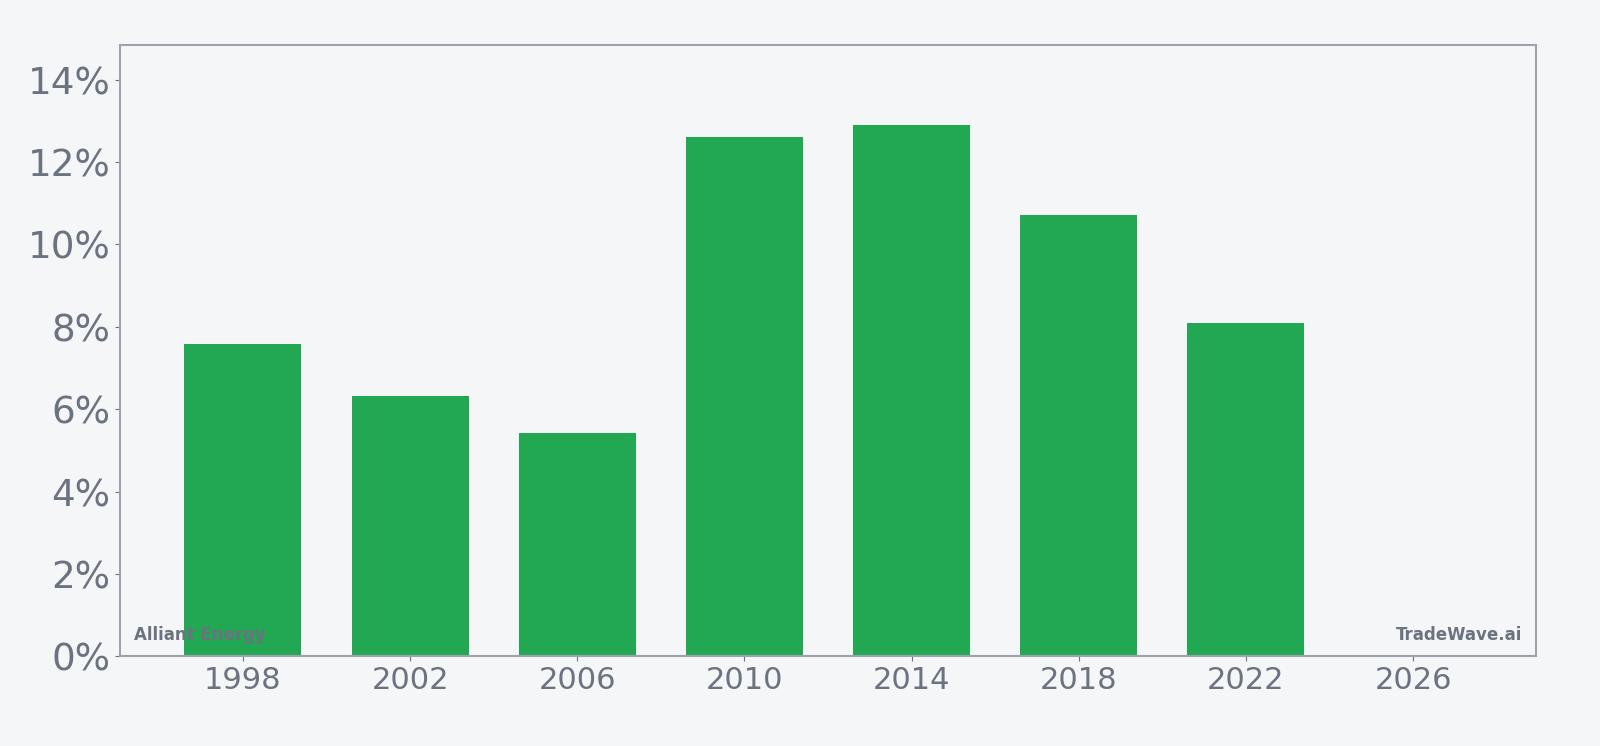
A combined view of net results with peak rallies and worst drawdowns highlights how upside and downside have interacted within the window.

History does not guarantee future results; adverse excursions (MAE) can be large even in winning windows.
Taken together, the historical pattern defines the quantitative seasonal backdrop for the current period as Alliant Energy approaches this midterm-year window.
Price and near-term drivers
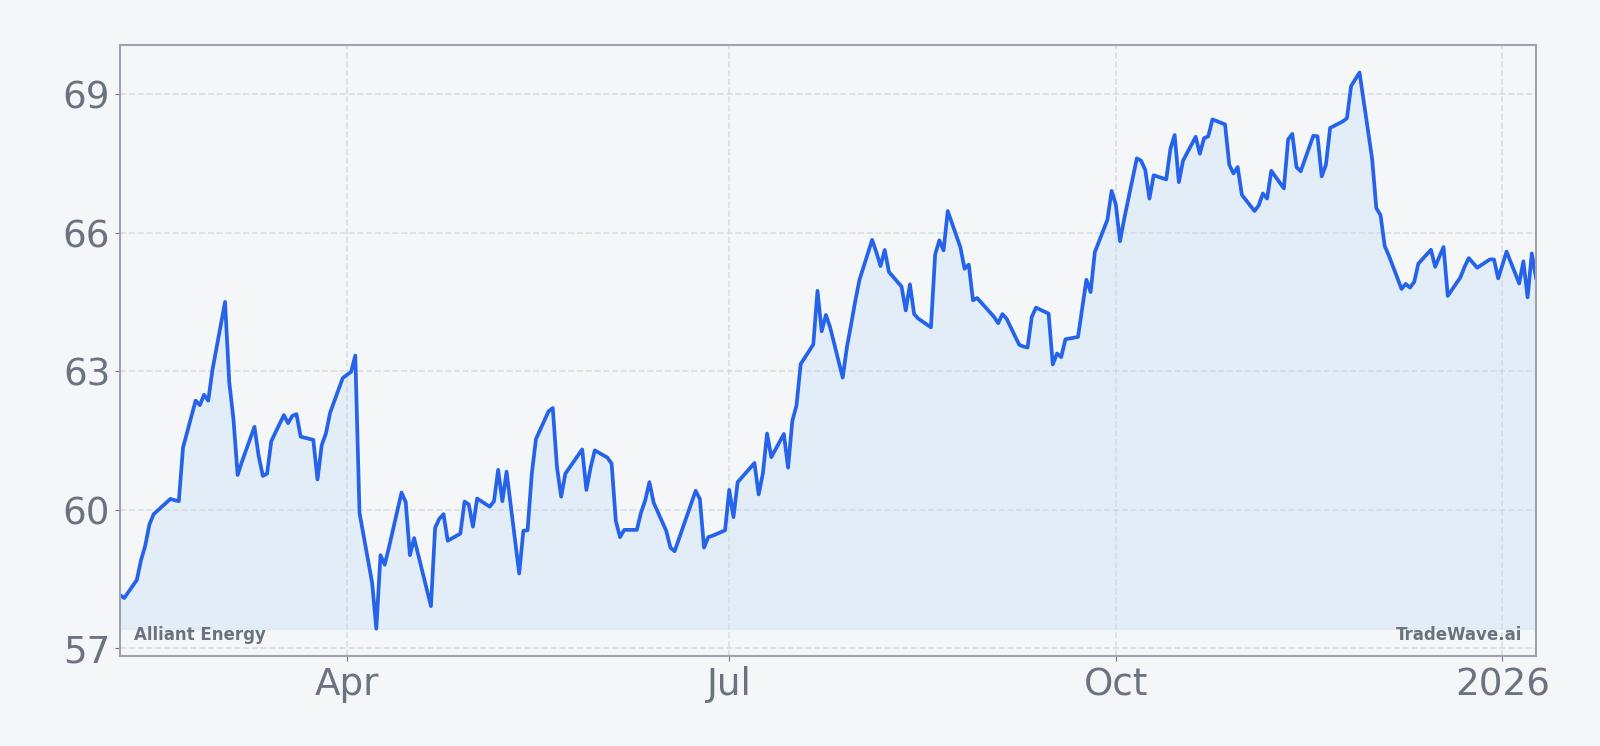
Alliant Energy’s share price context heading into February will help determine how investors interpret this historically strong window, particularly against a backdrop of shifting sector sentiment and interest-rate expectations. Utilities often trade as rate-sensitive bond proxies, so any renewed move in Treasury yields or changes in expectations for Federal Reserve policy could influence how aggressively investors lean into or away from the historical pattern.
The chart below situates the latest move in its recent multi-month context.
Sector dynamics also matter as the window approaches. In late 2025, several mining and materials names showed sharp single-day moves, with some stocks trading notably higher and others lower, underscoring how quickly sentiment can shift around real-asset and commodity-linked sectors when macro narratives change.[2][3][4][6][7][13] While Alliant Energy is a regulated utility rather than a miner, investor appetite for defensive yield, infrastructure exposure and inflation hedges often moves across adjacent sectors at the same time.
Options and positioning data in related areas of the real-assets complex have also pointed to periods of more active risk-taking. In late November 2025, for example, traders were reported to be buying a high volume of call options on AngloGold Ashanti, a move that highlighted growing speculative interest in parts of the commodity space.[11] For utilities, similar bursts of options activity or ETF flows can signal shifts in how investors are using the sector, whether as a defensive haven, a yield play or a vehicle for policy themes such as grid modernization and decarbonization.
Against that backdrop, the early part of the midterm election year often brings a heavier policy calendar for utilities, including regulatory decisions, rate-case developments and legislative debates over energy and climate. Markets will be watching how these catalysts intersect with the seasonal window, particularly if bond yields or inflation data surprise in either direction and force investors to reassess the relative appeal of regulated utilities versus other income-generating assets.
What to watch as the window opens
As Alliant Energy approaches the Feb 6 start of its 73-day midterm-year seasonal window, investors will be watching how the stock trades around several key reference points. One focus will be whether the share price is entering the period from a position of strength or weakness, since the historical pattern has delivered positive outcomes across a range of starting conditions but with different intraperiod paths.
Policy and macro catalysts will be central. Any updates on utility regulation, grid investment programs or environmental rules could influence how closely the stock tracks its historical seasonal tendency, particularly if they affect allowed returns or capital spending plans. At the same time, shifts in interest-rate expectations or inflation data could alter the relative appeal of utilities versus bonds and other defensives, either reinforcing or offsetting the historical pattern.
Investors may also monitor cross-asset signals in related sectors. The late-2025 bursts of volatility and options activity in mining and precious-metals names showed how quickly positioning can build when macro narratives change, and similar dynamics in utility options or sector ETFs would be one sign that investors are actively trading around the upcoming window rather than simply holding through it.[2][3][4][6][7][11][13]
Finally, behavior inside the window itself will offer clues about how relevant the historical pattern is this cycle. A path that features steady gains with contained drawdowns would be broadly consistent with prior midterm election years, while a deeper early setback or unusually muted upside would suggest that macro or policy forces are overpowering the usual seasonal tendency. For investors and traders alike, the goal is not to treat the pattern as a forecast, but to use it as a structured backdrop for interpreting price action as the midterm-year calendar unfolds.
Sources
- MarketBeat: Andrada Mining (LON:ATM) Releases Earnings Results (Nov 28, 2025)
- MarketBeat: Endeavour Mining (LON:EDV) Trading Down 1.1% - What's Next? (Dec 5, 2025)
- MarketBeat: Eurasia Mining (LON:EUA) Trading 16.7% Higher - Time to Buy? (Nov 26, 2025)
- MarketBeat: Lundin Mining (OTCMKTS:LUNMF) Sets New 1-Year High - Time to Buy? (Nov 29, 2025)
- MarketBeat: Lundin Mining Corp. (OTCMKTS:LUNMF) Receives Average Recommendation of 'Moderate Buy' from Brokerages (Nov 30, 2025)
- MarketBeat: Stock Traders Buy High Volume of AngloGold Ashanti Call Options (NYSE:AU) (Nov 27, 2025)
- MarketBeat: Andrada Mining (LON:ATM) Trading Up 8.2% - Here's Why (Nov 22, 2025)
- MarketBeat: U S Global Investors Inc. Cuts Holdings in IAMGOLD Co. (NYSE:IAG) (Mar 1, 2025)
- MarketBeat: Lundin Mining (TSE:LUN) Given New C$28.00 Price Target at TD Securities (Nov 8, 2025)
- MarketBeat: Agnico Eagle Mines Limited $AEM Shares Acquired by Intech Investment Management LLC (Sep 17, 2025)
- MarketBeat: Ur-Energy (TSE:URE) Share Price Passes Below 200 Day Moving Average - Here's What Happened (May 28, 2025)