$6.5 Billion Asset-Backed Deal Highlights Growth Ambitions at KKR & Co. (KKR)
KKR & Co. is moving through a 34-day stretch that has often skewed positive in past years, giving investors another lens on the alternative asset manager’s earnings momentum and growth ambitions.

Key takeaways
- KKR & Co. is in a 34-day seasonal window that began Dec 30, 2025 and has historically been favorable for long positions.
- Across 16 years of data, the pattern has been profitable in 81% of years, with 13 winners and 3 losers.
- Winning years in this window have averaged an 11.61% gain, while the all-years average, including losers, is 8%.
- The strongest years, such as 2022 and 2018, saw double-digit gains, while 2021 stands out as the weakest outcome with a modest loss and a deeper intraperiod drawdown.
- Historical best and worst excursions inside the window show that upside moves have typically outweighed adverse swings, but pullbacks can still be sharp in some years.
- The seasonal backdrop adds context to KKR’s earnings-driven growth story and the broader strength in alternative asset management.
According to historical data from TradeWave.ai, this part of the calendar has shown a distinct pattern for KKR & Co. over the past decade and a half, offering a quantitative backdrop to the company’s fundamental story.
Seasonal window
This seasonal window is currently underway, spanning 34 days from Dec 30, 2025, and has historically been a strong stretch for KKR & Co. on a long-bias basis. With current price and 52-week context unavailable, the pattern itself becomes a key reference point for how the stock has tended to behave in similar calendar periods.
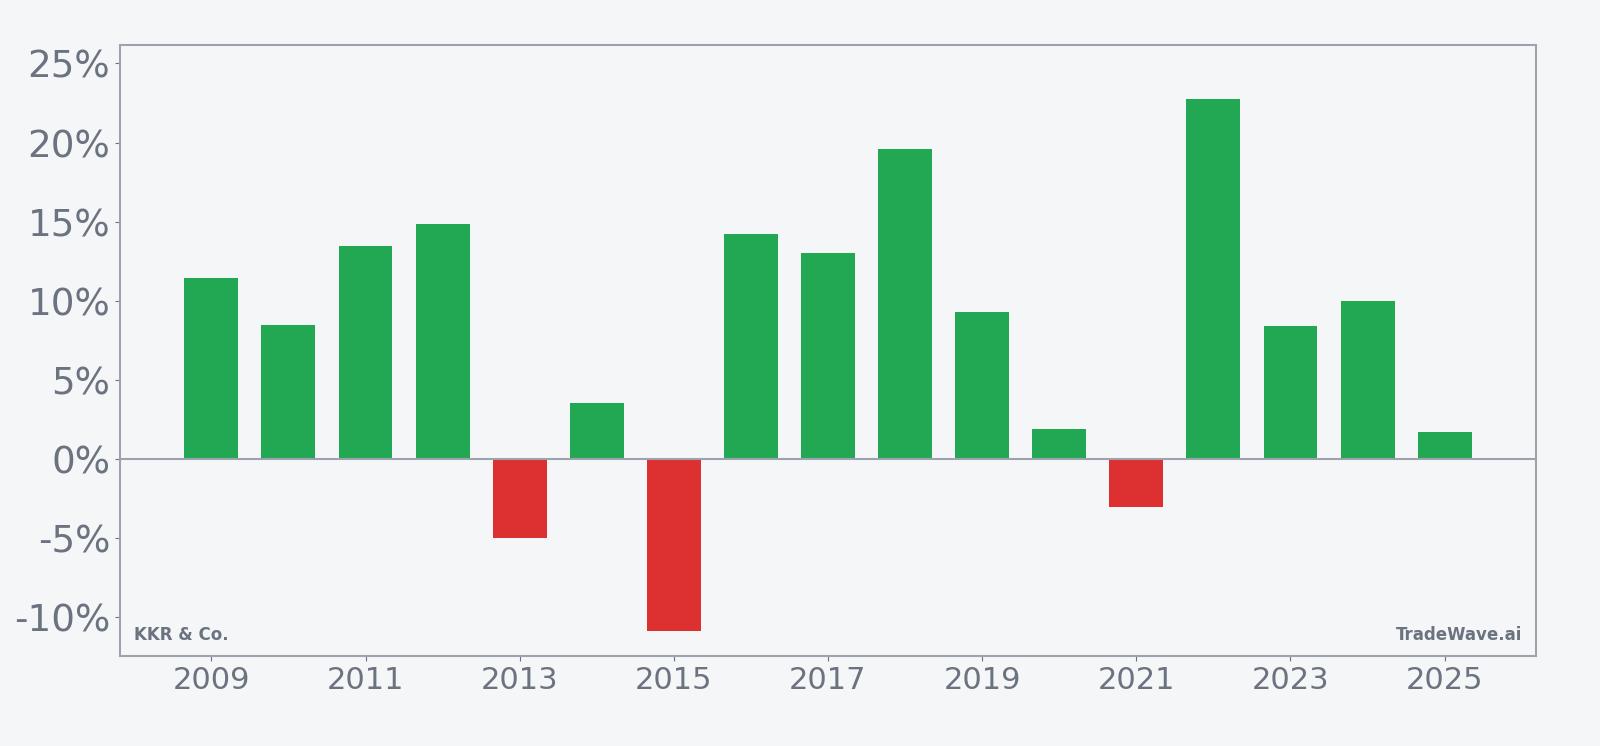
Across the 16-year sample, this long-direction pattern has been profitable in 81% of years, with 13 winners and 3 losers, indicating a clear historical bias toward gains in this part of the calendar. In winning years, KKR has averaged an 11.61% advance over the 34-day span, while including all years, the average outcome moderates to 8%, reflecting the drag from the three losing instances. The median profit of 9.62% and a Sharpe ratio of 0.87, based on end-of-window results, point to a relatively consistent payoff profile compared with many short-term seasonal patterns.
The per-year breakdown shows that some windows have been particularly strong. In 2022, KKR gained 22.77% during this stretch, with a maximum favorable move of 23.65% and only a shallow worst drawdown of 0.24% from the entry level. At the other end of the spectrum, 2021 delivered a net loss of 3.09%, with the stock experiencing a much deeper intraperiod decline of 18.24% from the starting price before partially recovering by the end of the window. These examples illustrate how the same calendar period can host both powerful rallies and meaningful setbacks, even within an overall positive pattern.
The historical best and worst excursions inside the window, captured by maximum favorable and maximum adverse moves, underline that upside has typically outweighed downside but that volatility can still be significant. Years such as 2018 and 2022 combined double-digit net gains with strong peak run-ups and relatively contained pullbacks, while 2020 and 2024 show more modest net results alongside intraperiod swings of roughly 5% to 6% in both directions. The TradeWave Ratio of 1.86 suggests that, on average, price has tended to travel a meaningful distance in the trade direction during the window, even when the final close did not fully retain the peak move.
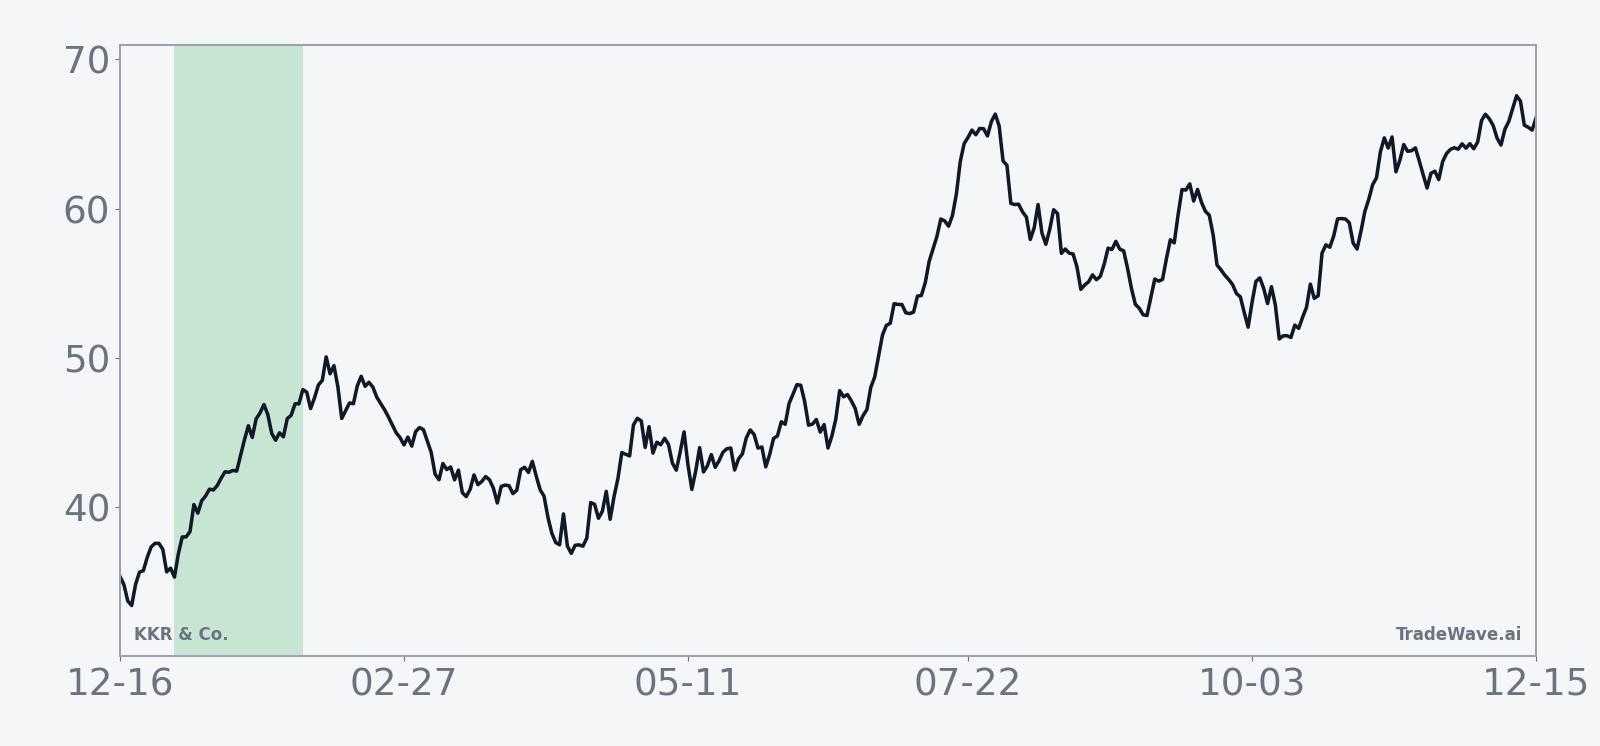
The historical seasonal trend chart suggests that, on average, gains in this window have tended to build progressively rather than arriving in a single burst, with the pattern often showing early strength that either consolidates or extends into the latter half of the period. While individual years deviate from the average, the clustering of positive cumulative returns across the sample supports the idea of a persistent, if not guaranteed, tailwind during this stretch.
A combined view of net returns and intraperiod swings helps clarify how upside potential and drawdown risk have interacted in past years.
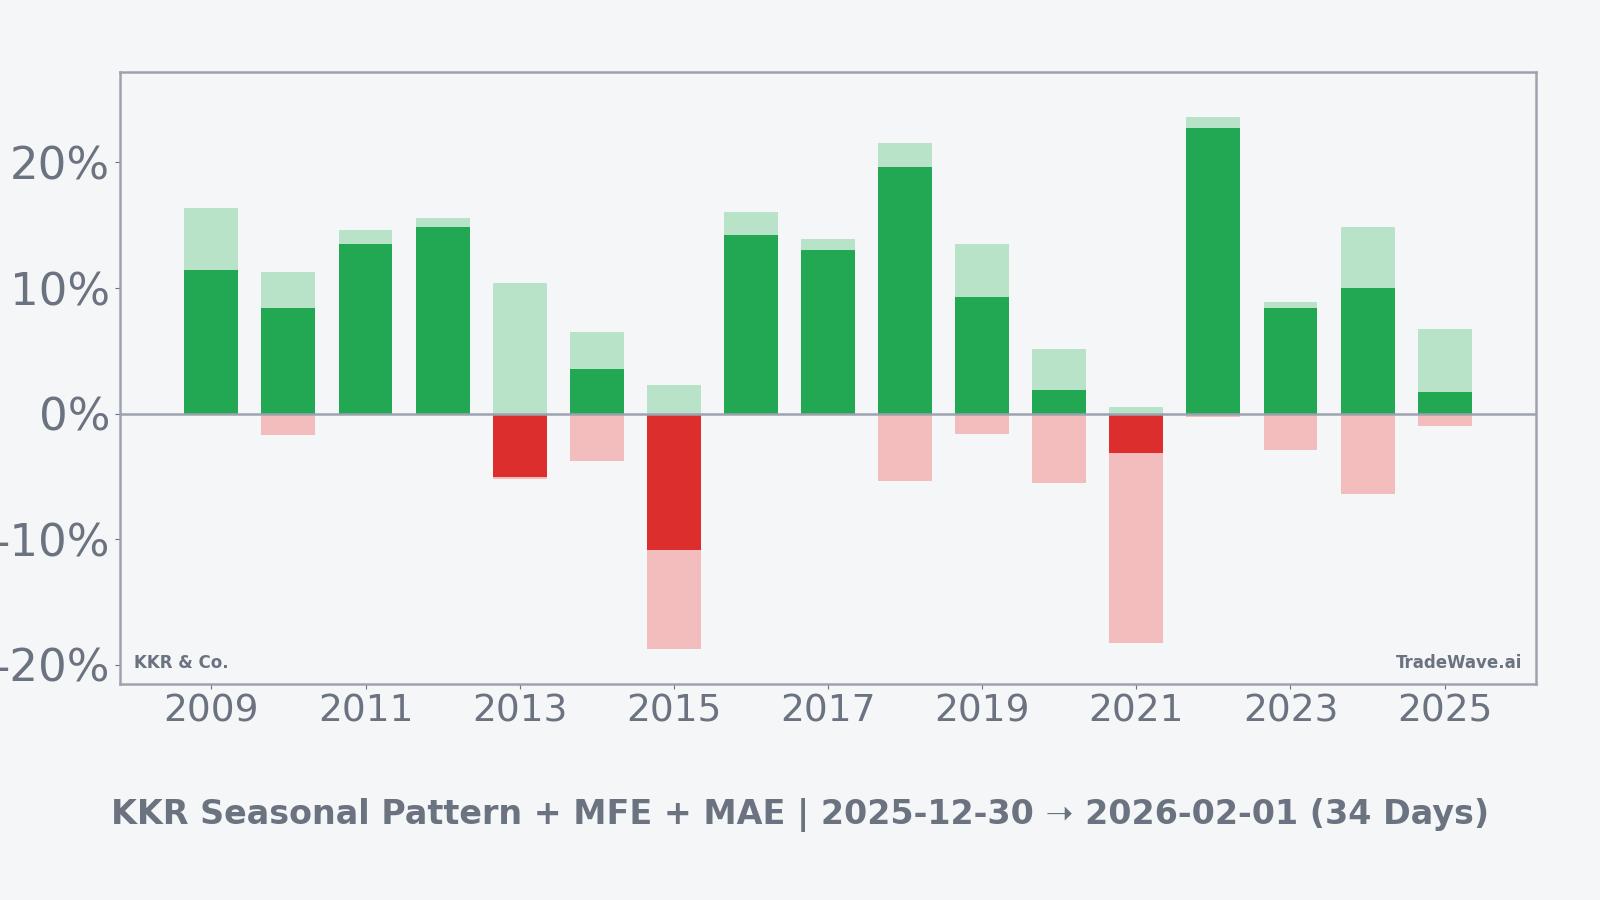
Viewed together, the net, peak favorable, and worst adverse moves show that many winning years featured sizeable rallies with relatively modest drawdowns, while the few losing years often combined softer net results with larger intraperiod declines. Taken together, the historical pattern defines the quantitative seasonal backdrop for the current period.
History does not guarantee future results; adverse excursions (MAE) can be large even in winning windows.
Price and near-term drivers
Real-time price, 52-week range and year-to-date performance data for KKR & Co. were not available as of Jan 8, 2026, which makes the company’s recent fundamental narrative particularly important for interpreting the current seasonal backdrop. In July 2025, KKR reported higher revenue and a 14% increase in assets under management to $686 billion, even as profit declined from the prior year, underscoring the firm’s continued growth in fee-earning assets.[1]
In November 2025, KKR’s third-quarter profit exceeded Wall Street expectations, with adjusted net income of $1.27 billion helped by strong fundraising in credit and insurance strategies, reinforcing the firm’s position as a beneficiary of investor demand for alternative assets.[2] Earlier in February 2025, KKR had raised its earnings forecast for long-term private equity investments and increased ownership in three portfolio holdings worth $1.1 billion, signaling confidence in its ability to compound value across its balance sheet.[3]
That same February 2025 reporting cycle also highlighted the growing importance of KKR’s capital markets unit, which generated record annual fees of $1 billion in 2024, up from $577.6 million the year before, driven largely by structured-credit transactions.[4] The expansion of this fee stream, alongside rising assets under management, has helped diversify KKR’s earnings base beyond traditional buyout economics and positioned the firm to benefit from a broader shift toward private credit and bespoke financing solutions.
In July 2025, KKR announced it had raised $6.5 billion for asset-backed financing, targeting an undercapitalized $6 trillion market that is projected to grow to $9 trillion by 2029, highlighting the scale of the opportunity the firm sees in providing capital against real-world assets.[7] This push into asset-backed finance aligns with a wider trend in alternative asset management, where large platforms with durable balance sheets are seen as relatively insulated from day-to-day interest-rate volatility and are increasingly central to credit intermediation.[2]
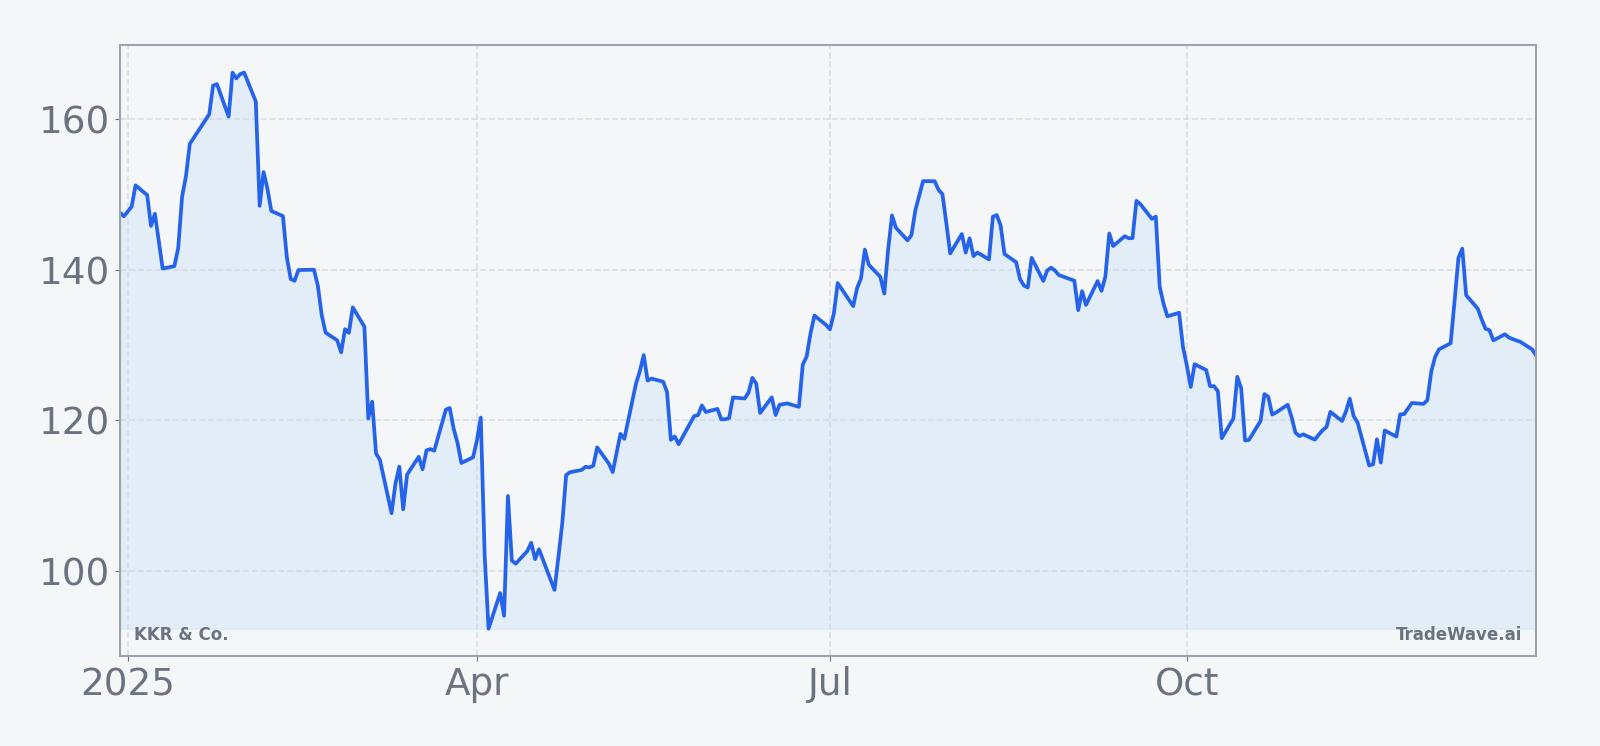
The chart below situates KKR’s recent trading behavior in its broader 12-month context.
Earnings backdrop
KKR’s recent earnings trajectory provides important context for the seasonal pattern. For the second quarter of 2025, the firm reported profit of $472.4 million, or $0.50 per share, compared with $667.9 million, or $0.72 per share, a year earlier, while adjusted earnings per share came in at $1.18.[1] The decline in headline profit contrasted with the 14% year-on-year increase in assets under management to $686 billion, reflecting the lag between fundraising, deployment and realized earnings in alternative strategies.
By the third quarter of 2025, KKR’s adjusted net income had risen to $1.27 billion, or $1.41 per share, beating analyst estimates of $1.17 billion and $1.30 per share respectively, as strong inflows into credit and insurance strategies helped offset market volatility.[2] The firm’s earlier decision, reported in February 2025, to raise its earnings forecast for long-term private equity bets and increase ownership stakes in select investments worth $1.1 billion underscored management’s conviction in the durability of its portfolio companies.[3]
KKR has not provided a specific date for its next earnings release, but the most recent guidance points to a strategy focused on scaling fee-related earnings, expanding in private credit and leveraging its capital markets capabilities. For investors watching the current seasonal window, the interplay between these earnings drivers and any upcoming results will be central to whether the historical pattern of strength is reinforced or challenged.
Macro and sector context
KKR’s seasonal window is unfolding against a backdrop of structural growth in private credit and asset-backed financing. In July 2025, the firm disclosed that it had raised $6.5 billion for asset-backed financing vehicles, targeting a $6 trillion market that is expected to expand to $9 trillion by 2029, highlighting the long runway for capital deployment in this area.[7] This initiative reflects a broader shift in credit intermediation away from traditional banks and toward large alternative managers with flexible capital and specialized underwriting capabilities.
Within the alternative asset management sector, KKR’s performance has been cited as emblematic of the industry’s resilience, with balance-sheet strength and diversified fee streams helping to buffer the impact of interest-rate swings and public-market volatility.[2] As investors weigh the historical tendency for KKR shares to perform well in this particular calendar window, the macro backdrop of growing demand for private capital and structured financing provides an additional layer of context for how the stock might respond to new information.
Valuation and positioning lens
Specific valuation metrics such as price-to-earnings ratios, dividend yield and price-to-book for KKR were not available in the current dataset, but analyst sentiment has generally been constructive. According to a Reuters-cited view from Piper Sandler, the stock carries a Buy consensus rating, reflecting confidence in the firm’s ability to translate its expanding asset base and capital markets capabilities into sustained earnings growth.[2]
Without precise real-time valuation markers, investors often look to a combination of earnings momentum, sector positioning and historical behavior to frame risk and opportunity. In that context, the current seasonal window, with its long-biased historical tendency and relatively high share of winning years, serves as one more input into how market participants might think about timing and potential volatility around upcoming catalysts.
What to watch from here
For the remainder of this 34-day window, investors will be watching how KKR trades around any company-specific updates or broader macro headlines, particularly those tied to private credit, asset-backed financing and fundraising flows. Price action relative to recent ranges and any approach toward prior highs or lows will help indicate whether the stock is tracking closer to the stronger historical years, such as 2018 and 2022, or to softer outcomes like 2021.
Upcoming earnings will be another key checkpoint, even though the exact date is not yet specified, as the market assesses whether KKR can sustain the adjusted net income strength seen in the third quarter of 2025 and continue to grow fee-related earnings.[2] Investors will also be monitoring announcements around new funds, capital deployment and realizations, which can influence both near-term sentiment and the longer-term growth narrative that underpins the stock.
From a seasonal perspective, behavior inside the window that features steady gains with contained pullbacks would be more consistent with the historical pattern, while a sharp, sustained drawdown would look more like the outlier years in the sample. How KKR trades through this period, in conjunction with its next set of financial results and any macro developments in private credit, will help determine whether the current season aligns with the long-term tendency or diverges from it.
Sources
- [1] The Wall Street Journal, “KKR Posts Higher Revenue, Increases Assets Under Management,” Jul 31, 2025.
- [2] Reuters, “KKR's quarterly profit beats estimates on rising inflows,” Nov 7, 2025.
- [3] Bloomberg, “KKR Boosts Earnings Forecast for Long-Term Private Equity Bets,” Feb 4, 2025.
- [4] Bloomberg, “KKR Capital Markets Unit Reports Record $1 Billion of Fees,” Feb 4, 2025.
- [7] Reuters, “KKR raises $6.5 billion for asset-backed financing,” Jul 30, 2025.