PepsiCo (PEP) Holds at ‘Hold’ as Analysts Weigh Earnings Beats Against Slower Growth
PepsiCo is entering a late-year stretch that has often leaned lower in the year after a presidential election, just as the stock sits down for 2025 and investors reassess consumer strength and pricing power.
Key takeaways
- PepsiCo is in a 40-day seasonal window that has historically favored downside moves for a short trade in the year after the presidential election.
- The pattern runs from Dec 30 and is grouped by election cycle, focusing only on prior “year after the election” episodes.
- Across 10 historical years, the short setup was profitable in 100% of cases, with 10 winners and 0 losers.
- Average profit for winning short trades was 3.41%, reflecting modest but consistent downside drift in this stretch.
- Historical paths show adverse moves against the short can still be sizable within the window, underscoring the importance of intraperiod risk management.
- The window arrives as PepsiCo navigates softer North American beverage volumes offset by international growth and pricing gains.[1][3][4]
According to historical data from TradeWave.ai, this late-year stretch for PepsiCo has shown a distinct election-cycle pattern in prior decades. The next section unpacks how that behavior has tended to unfold and what it may signal about the current backdrop.
Seasonal window
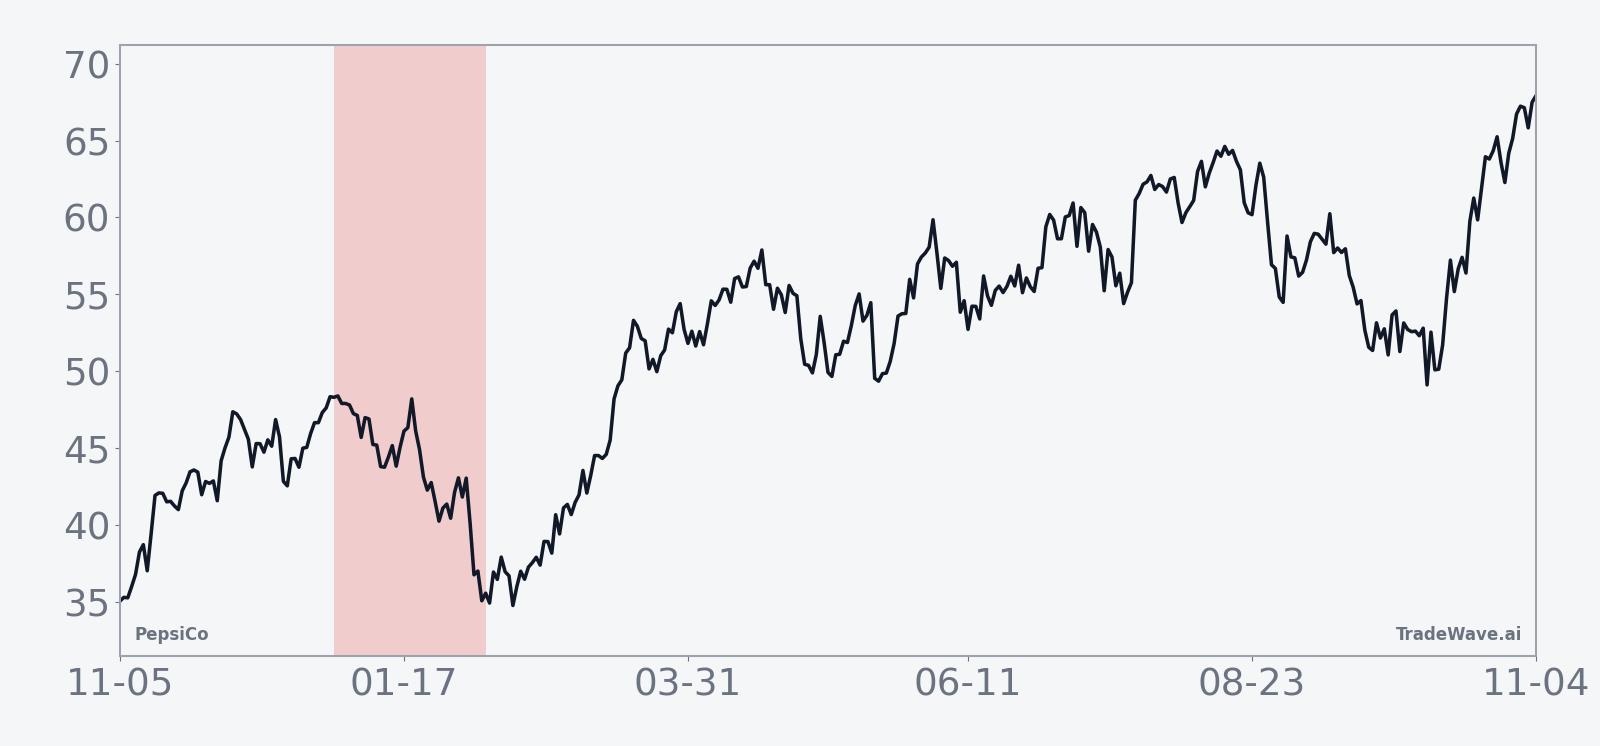
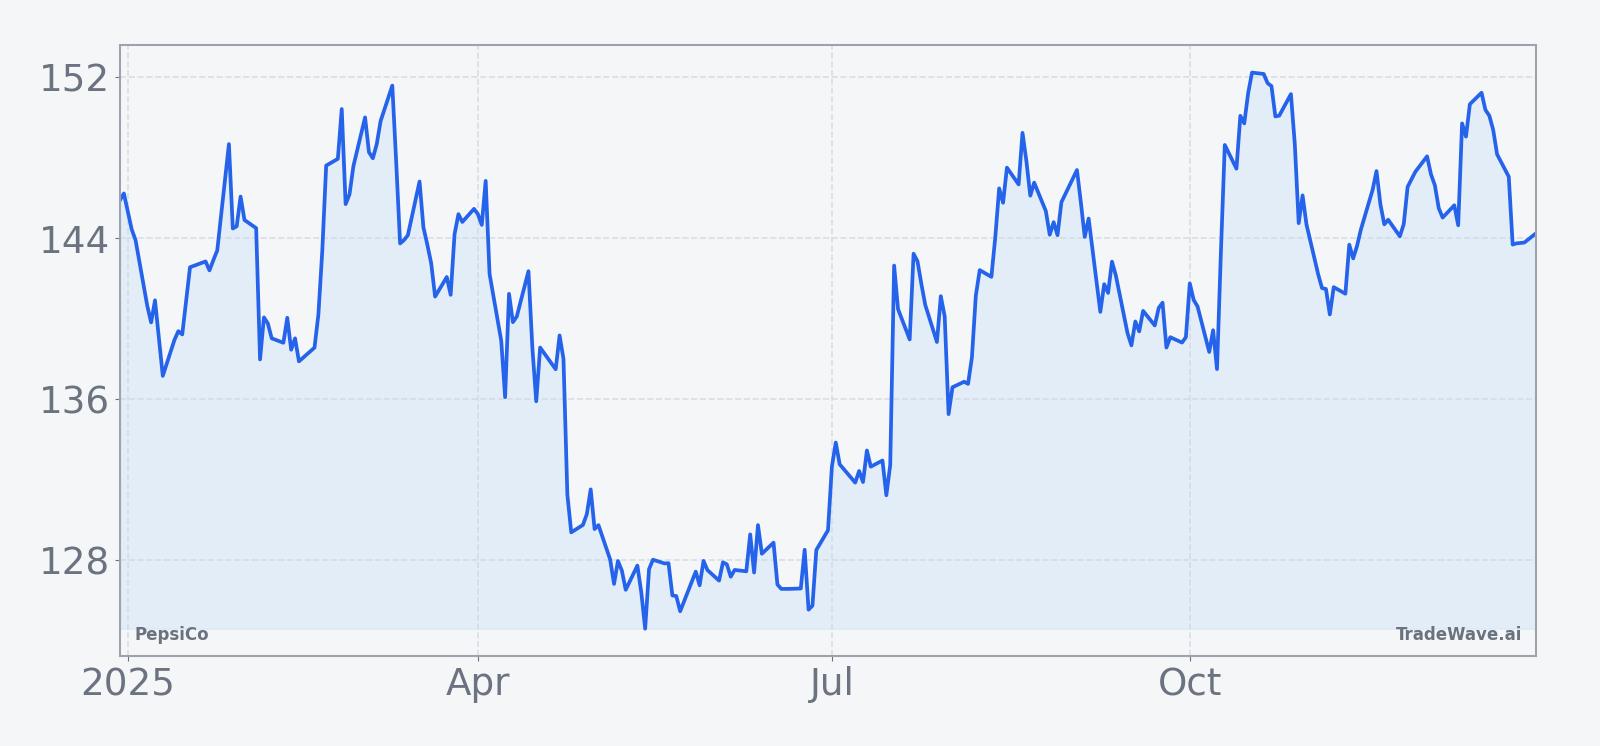
This seasonal window is currently underway, spanning 40 days from Dec 30, and has historically been a weak stretch for PepsiCo when viewed through the lens of a short trade in the year after the presidential election. Today the stock is up roughly 2.7% on the session but remains about 8.0% lower for 2025, leaving it lagging broader consumer staples peers even after recent earnings beats.[1][3][5]
Because this analysis is grouped by the presidential election cycle, it compares PepsiCo only against prior “year after the election” environments rather than a simple run of calendar years. That matters for a consumer-facing multinational, since fiscal policy, regulation and real-income trends often shift meaningfully between the election year, the year after, the midterm year and the year before the next vote, shaping how defensives like beverages and snacks trade around policy resets.
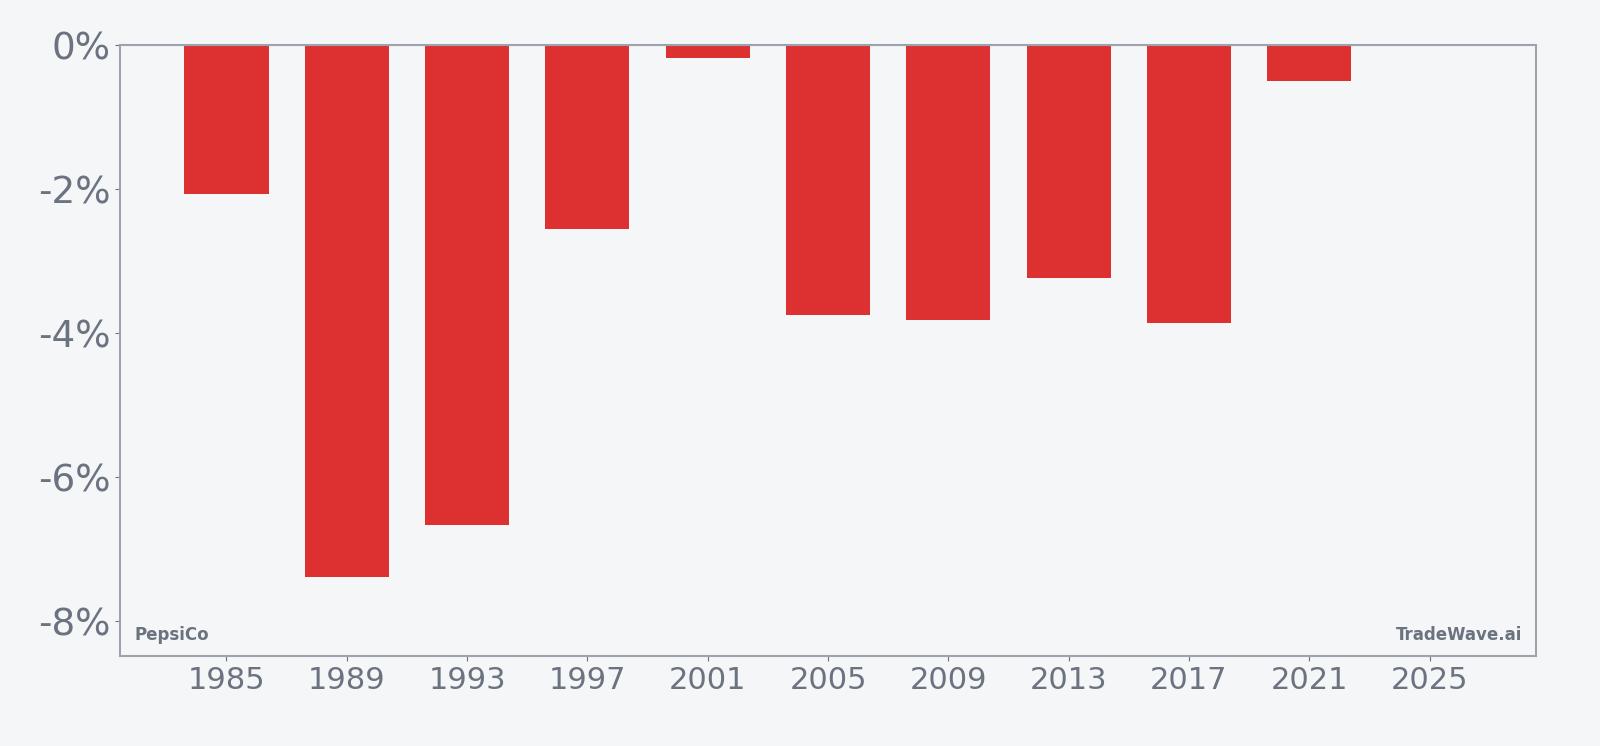
This seasonal window begins on Dec 30 and spans 40 days. Historically, during this period, PepsiCo has shown a consistent downward bias when viewed from the standpoint of a short position, with every one of the 10 prior years in the sample ending profitably for that trade. The average profit of 3.41% reflects a pattern of modest but steady declines, rather than dramatic collapses, across those episodes.
The per-year breakdown highlights how that weakness has tended to appear. The strongest year for the short setup was 1989, when PepsiCo fell 7.39% over the window, while 2001 and 2021 were comparatively muted, with net returns of 0.18% and 0.50% respectively from the short perspective. Even in the softer years, the stock still drifted lower by the end of the 40-day span, keeping the win rate at 10 out of 10.
The historical seasonal average suggests that, in many of these years, the bulk of the downside for the short trade has tended to accrue gradually rather than in a single shock. The curve slopes lower over the window, with some choppiness, indicating that rallies against the short have occurred but have usually been contained before the end of the period.
A combined view of net returns and intraperiod swings shows how far PepsiCo has typically moved in both favorable and adverse directions during this window.
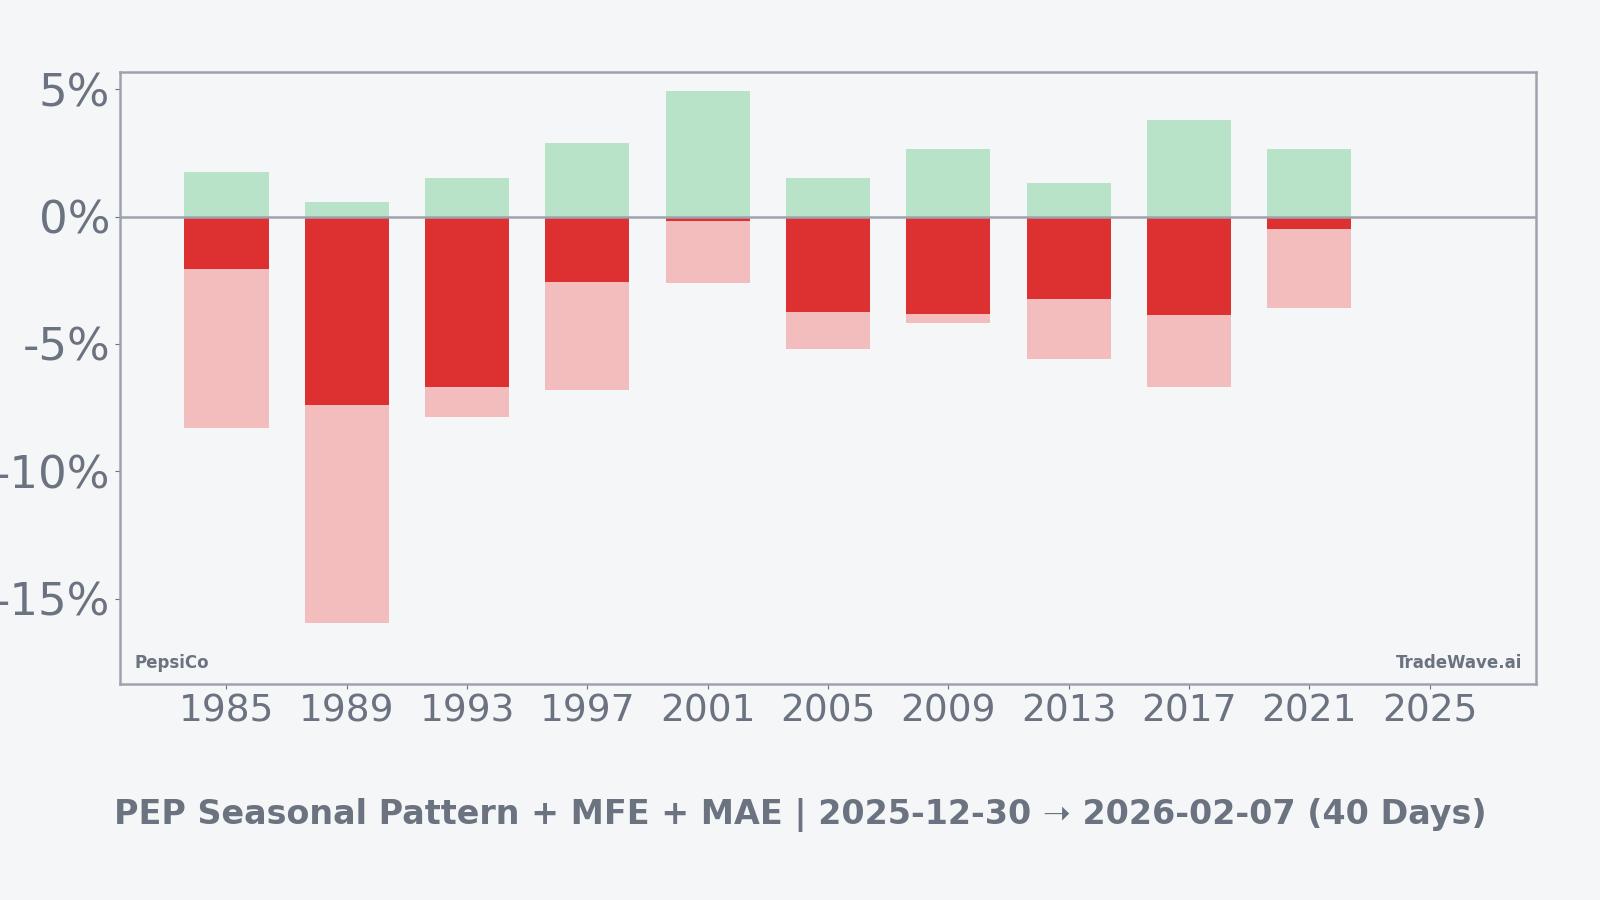
The combined net, maximum favorable excursion and maximum adverse excursion profile shows that while the short trade has historically ended in the black, PepsiCo has often moved meaningfully in both directions inside the window. In 1989, for example, the best intraperiod move in favor of the short was accompanied by a deep adverse swing of 15.95% at one point, while 2001 saw a relatively modest worst drawdown of 2.59% despite a profitable close. That mix of sizable potential run-up and sometimes sharp countertrend rallies is reflected in the TradeWave Ratio of 1.67, which captures how far price typically travels in the trade direction within the window independent of the final close.
The cumulative return chart for this pattern, which aggregates outcomes across all prior years, reinforces the idea of a steady, election-cycle-specific drift lower rather than a one-off anomaly. Returns cluster in a relatively tight band, with no losing years for the short setup, suggesting that this particular phase of the presidential cycle has repeatedly coincided with a softer tone for PepsiCo over this late-year and early-year stretch.
History does not guarantee future results, and adverse excursions within the window can be large even in years that ultimately finish profitably for the short trade.
Price and near-term drivers
PepsiCo’s latest bounce comes after a year in which the stock has struggled to keep pace with both the broader market and key rivals, leaving it roughly 8.0% lower year to date despite a series of earnings beats and resilient international demand.[1][3][4][5] The company has leaned on price increases and strength in snacks and overseas markets to offset weaker beverage volumes in North America, a trade-off that has supported revenue but raised questions about how much more pricing power remains.
In its most recent quarter, PepsiCo reported revenue of $23.94 billion versus expectations of $23.83 billion and earnings per share of $2.29 against a $2.26 consensus, marking another modest beat driven largely by international growth and a rebound in soda demand in the U.S. and Europe.[1][3] Earlier in the year, second-quarter results also topped forecasts, with revenue of $22.73 billion and EPS of $2.12, again helped by overseas markets and improving beverage trends, while a prior fourth-quarter report showed revenue missing estimates as product recalls and geopolitical disruptions weighed on sales even as earnings slightly exceeded expectations.[3][5]
Management has reiterated its full-year 2025 outlook, calling for a low-single-digit increase in organic revenue and a smaller decline in core EPS than previously guided, signaling confidence that cost controls and mix can offset volume pressure.[5] Analysts tracked by Bloomberg via CNBC maintain a “Hold” consensus rating with a price target around $154.09, reflecting a view that much of PepsiCo’s defensive appeal is already embedded in the stock while execution risks and competitive dynamics with Coca-Cola remain in focus.[5]
At the macro level, investors have been using consumer bellwethers like PepsiCo as stand-ins for official confidence data during periods when government statistics are delayed, with recent commentary highlighting how spending patterns on beverages and snacks can reveal stress or resilience in household budgets.[6] That lens has become more important as markets weigh the Federal Reserve’s path on interest rates, inflation trends and the durability of consumer demand heading into the midterm election year, all of which can influence how much investors are willing to pay for steady but slower-growing staples names.
The chart below situates the latest move in its recent multi-month context.
Election-cycle context and macro backdrop
This seasonal window sits at the end of the year after the presidential election, a phase that often features policy digestion rather than fresh legislative initiatives. For a company like PepsiCo, that can translate into a focus on how prior-year tax, regulatory and trade decisions filter through to consumer incomes and input costs, rather than on new headline policy shocks.
As markets transition from the year after the election into the midterm election year, investors typically pay closer attention to fiscal debates, potential changes in healthcare and environmental rules, and any shifts in trade policy that could affect global supply chains. For PepsiCo, which generates a significant share of revenue outside North America, the balance between domestic volume softness and international growth has already been a key theme in 2025, and that balance could become more sensitive to currency moves and geopolitical developments as the political calendar advances.[1][3][5]
Within consumer staples, beverage and snack makers have faced a mixed backdrop: higher prices have supported top-line growth even as volumes in mature markets have slipped, a pattern that has been evident in PepsiCo’s North American beverage business.[1][4] The sector’s defensive reputation has helped cushion some of the downside, but with the stock already lower for the year, the historically weak seasonal window adds another layer of nuance to how investors may frame risk and reward into early 2026.
What to watch in this window
For traders and longer-term investors alike, the key question in this 40-day stretch is whether PepsiCo’s price action tracks the historical pattern of gentle but persistent weakness or diverges meaningfully from it. A continuation of the recent bounce that pushes the stock sharply higher and holds those gains would mark a clear break from prior “year after the election” episodes, while a choppy, sideways-to-lower path would be more consistent with the seasonal template.
Fundamentally, upcoming company updates on pricing, promotions and volume trends in North America will be important, particularly any signs that consumers are trading down or that retailers are pushing back on further price increases.[1][4] On the macro side, fresh readings on inflation and labor markets, along with any new guidance from the Federal Reserve, could influence how investors value defensive cash flows relative to higher-growth sectors, potentially amplifying or muting the seasonal tendency.[6]
From a technical standpoint, traders will be watching how PepsiCo behaves around recent support and resistance zones visible on the one-year chart, including whether rallies during the window are sold or whether buyers step in more aggressively than in past cycles. Because the historical pattern has featured meaningful intraperiod swings even in years that ultimately favored the short trade, the way the stock responds to sharp single-day moves could offer early clues about whether this cycle is tracking the established script or writing a new one.
Taken together, the election-cycle grouping, the 100% historical win rate for the short setup and the presence of sizable intraperiod swings define the quantitative seasonal backdrop for PepsiCo in the current period. How the stock trades against that backdrop, especially as policy debates and consumer data evolve into the midterm election year, will help determine whether this window once again tilts soft or breaks from its historical pattern.
Sources
- [1] CNBC, “PepsiCo earnings top estimates as international markets fuel sales growth” (Oct 9, 2025)
- [2] Seeking Alpha, “PepsiCo gains after topping earnings expectations, naming a new CFO” (Oct 9, 2025)
- [3] Reuters, “PepsiCo's results exceed expectations on international growth, soda demand rebound” (Jul 17, 2025)
- [4] MarketWatch, “PepsiCo’s revenue grows, as higher prices offset a continued drop in beverage volumes” (Oct 9, 2025)
- [5] Bloomberg, “PepsiCo Revenue Misses Estimates, Hit By Recall and Geopolitics” (Feb 4, 2025)
- [6] Reuters, “Wall St set for muted open after Powell offers no new guidance on rate outlook” (Oct 9, 2025)