CBOE Volatility Index
The VIX measures the market's expectation of 30-day forward-looking volatility, derived from S&P 500 index options. Often called the 'fear gauge,' it rises during periods of market uncertainty.
Fear may be fading, but 2026 complicates that story. Over the last 10 consecutive years, the VIX declined in all 10 of the measured 90-day periods, pointing toward a level near 16.54 and signaling broadly stable equity conditions ahead. The 30-day and 60-day windows show similarly bearish VIX readings, with median declines suggesting diminishing market anxiety.
Midterm election years tell a different story. Historically, the VIX rose in 4 of 8 midterm periods across all three horizons, with average increases exceeding 12%, pointing toward elevated uncertainty near 20.94 over 90 days. The divergence between the broad seasonal trend and the election-cycle pattern is the key tension to monitor. Investors should watch whether political uncertainty overrides the typical seasonal drift toward calmer markets.
Seasonal Price Projections
Select a historical basis and projection horizon to see where seasonal patterns suggest CBOE Volatility Index may be headed.
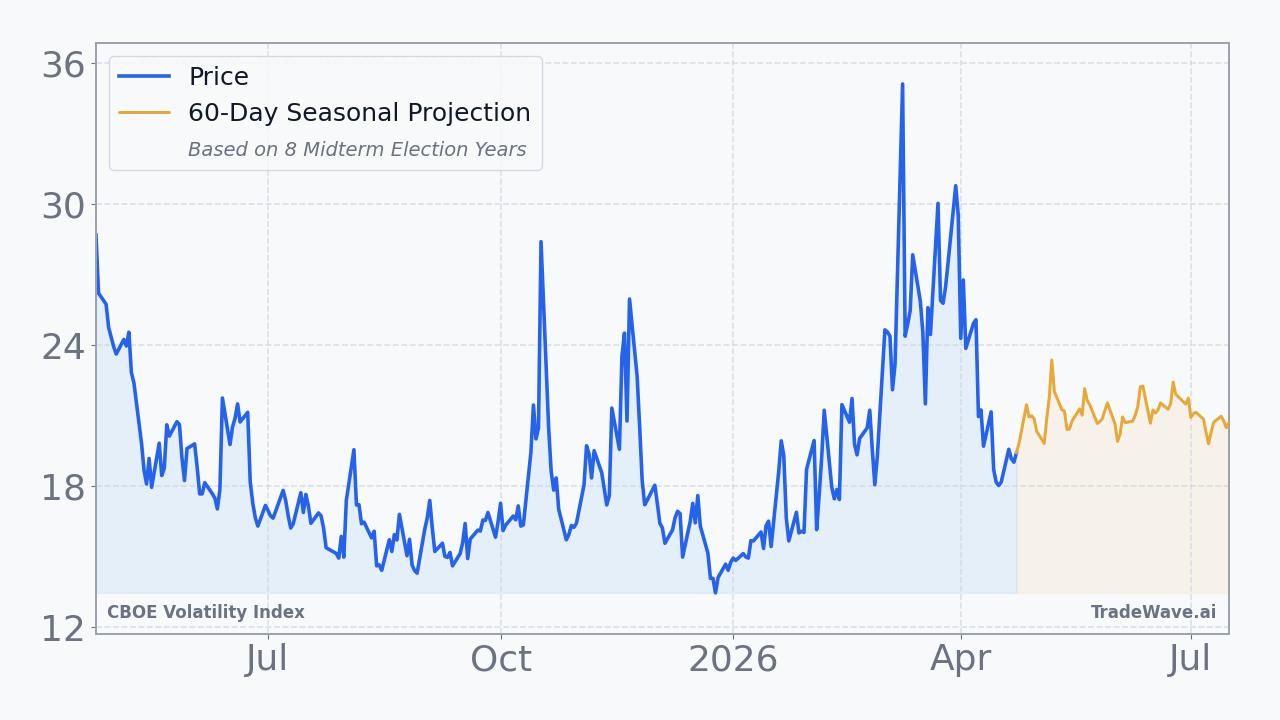
Projection as of Apr 24, 2026 from closing price $19.31
How to Use This Data
Seasonal projections for the CBOE Volatility Index reveal how VIX has historically behaved during this same calendar period across past years. In consecutive periods, VIX increased in just 30.0% of cases, suggesting relative calm was more common. In midterm election years specifically, VIX increased in 50.0% of periods, indicating meaningfully more frequent market anxiety during those cycles.
When the two bases point in opposite directions, as they do here, neither pattern should be treated as definitive. The election-year cycle may introduce conditions that recent consecutive history does not capture. Median returns, such as the consecutive median of -7.5%, often provide a cleaner read than averages because extreme outlier years, like the historical range of -25.1% to +22.5%, can distort the mean significantly.
Seasonal patterns carry real limitations. Breaking news, Federal Reserve decisions, geopolitical shocks, or earnings surprises can override any historical tendency entirely. A higher VIX-increase rate signals a statistical tendency toward turbulence, not a guarantee that volatility will spike in any given year.
Market participants may find seasonal VIX data useful as one diagnostic layer when assessing broader equity market conditions. It works best alongside technical indicators, macroeconomic context, and sound risk management frameworks, informing expectations rather than driving conclusions on its own.
This information is provided for educational purposes only and does not constitute financial advice, a recommendation, or a solicitation to buy or sell any security. Seasonal patterns are based on historical data and do not guarantee future performance. All investment decisions carry risk. Consult a qualified financial advisor before making investment decisions.
Understanding Seasonal Projections
Seasonal projections estimate future price movement based on how CBOE Volatility Index has historically performed during the same calendar period. These are statistical baselines derived from decades of market data, not predictions.
Consecutive Years (Last 10)
Uses the most recent 10 years of data regardless of market regime. This captures the broadest recent behavior, including all economic and political environments. Over the next 60 trading days, this pattern has been positive 3 of 10 times with an average return of -4.8%.
Midterm Election Years (8 Available)
Uses only years that fall in the same position within the 4-year U.S. presidential election cycle. 2026 is a midterm election year. Markets often exhibit distinct patterns tied to fiscal and monetary policy shifts within this cycle. In 8 historical midterm election years, this 60-day window was positive 4 times with an average return of +12.0%.
Seasonal patterns reflect historical tendencies and do not guarantee future results. All projections are based on past performance and should be used as one input among many in your investment decision-making process. Data provided by TradeWave.ai.
Latest News
Recent headlines related to CBOE Volatility Index, sourced from major financial news outlets with AI sentiment analysis.
- VIX Creeps Toward 20 as Iran Fears and Tesla’s Whipsaw Rattle Nerves
- This risky monthly income ETF yields over 20%, but beware of volatility surges
- 5 Top Small-Cap Value Funds to Buy for Long-Term Growth
- Market Fear Index Rises on Strait of Hormuz Tensions
- The VIX Hasn’t Been This Calm Since March. Here’s Why Traders Are Breathing Easier.
- Wall Street Fear Index Drops as Cease-Fire Extension Soothes Markets
- Assessing Cboe Global Markets (CBOE) Valuation As Strait Of Hormuz Tensions Lift Volatility Index
- Wall Street Fear Index Edges Higher on Iran Uncertainty. Markets Haven't Hit the Panic Button.
- CBOE VIX Index Spikes 9.7% as Oil-Fueled Fears Grip Markets
- Wall Street Fear Index Spikes as Peace Talks Hang in the Balance
Explore More
Other markets with seasonal analysis and recent pattern articles.