CBOE Volatility Index (VIX) Has Finished Lower in Every Spring-Summer Run for the Past 10 Years
The CBOE Volatility Index is stepping into a 130-day stretch that has consistently seen volatility grind lower even as sharp spikes hit along the way.
Key takeaways
- The 130-day window starting Mar 6 has seen VIX decline in 10 of the past 10 years, aligned with a short-volatility trade direction.
- Average profit for the seasonal short setup is 23.95%, with a 100% win rate across 10 winners and 0 losers.
- The TradeWave Ratio (TWR) of 3.05 signals that VIX typically travels meaningfully in the trade direction within the window, beyond just the final close.
- Intraperiod swings have been violent: historical best-case spikes reached up to 141.78% above entry in one year, while worst drawdowns ran as deep as 49.38%.
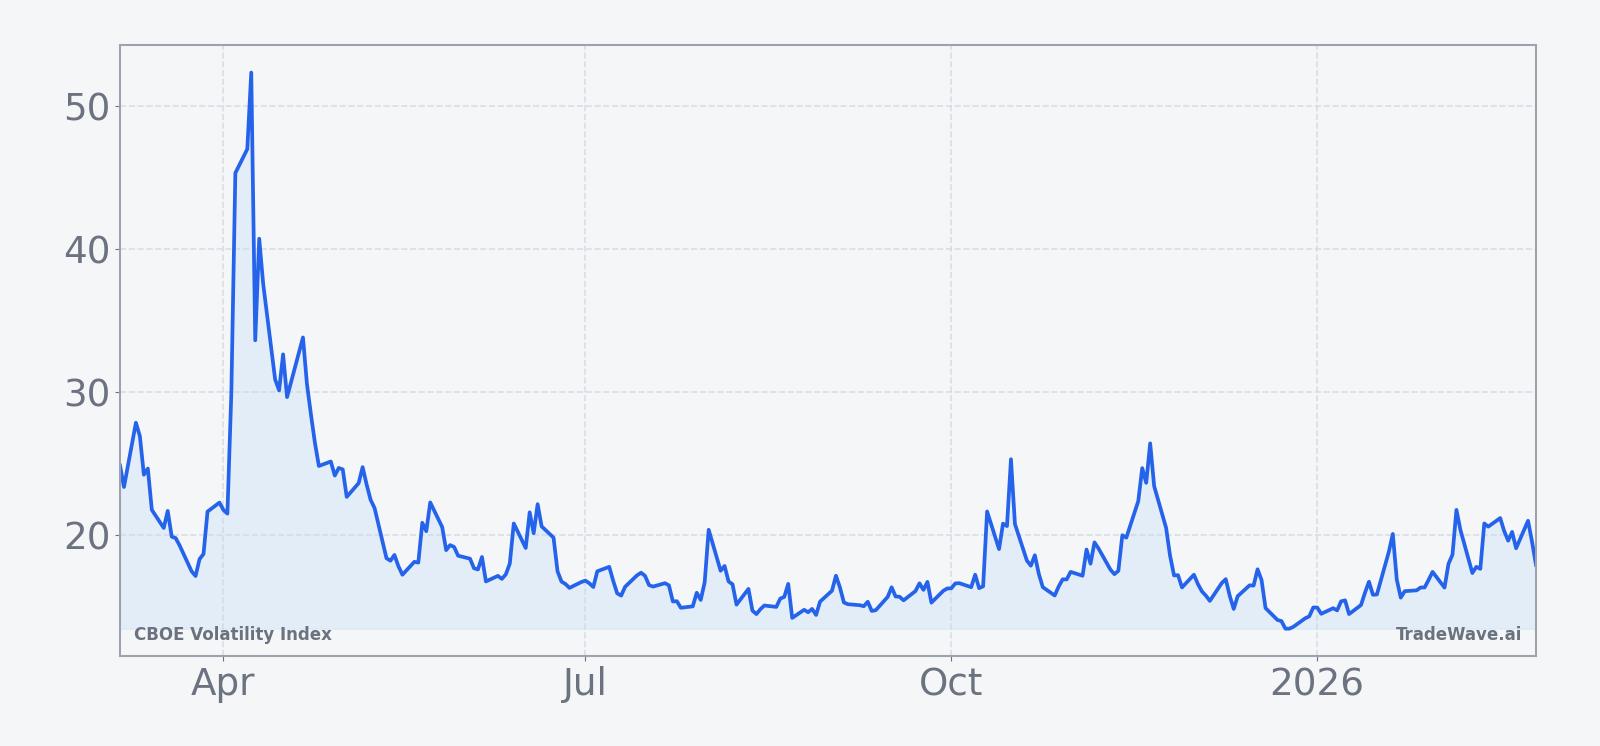
- Today VIX trades at 23.75, about 60.5% below its 52-week high of 60.13 and 77.6% above its 52-week low of 13.38, entering the window from the middle of its recent range.
- History points to a grind lower in implied volatility over this stretch, but the path has often included one or more sharp volatility shocks along the way.
According to historical data from TradeWave.ai, this part of the calendar has behaved very differently for VIX than a typical month. The next section walks through that seasonal pattern and how it frames the current volatility backdrop.
Seasonal window
CBOE Volatility Index has delivered a profitable short-volatility outcome in all 10 of the past 130-day windows starting on Mar 6, with average gains of 23.95% for the short side. Today VIX sits at 23.75, about 60.5% below its 52-week high of 60.13 and 77.6% above its 52-week low of 13.38, entering this regime from the middle of its recent range. That combination of a strong historical tendency for volatility to fade and a still-elevated spot level gives traders a clear seasonal backdrop as the new window opens.
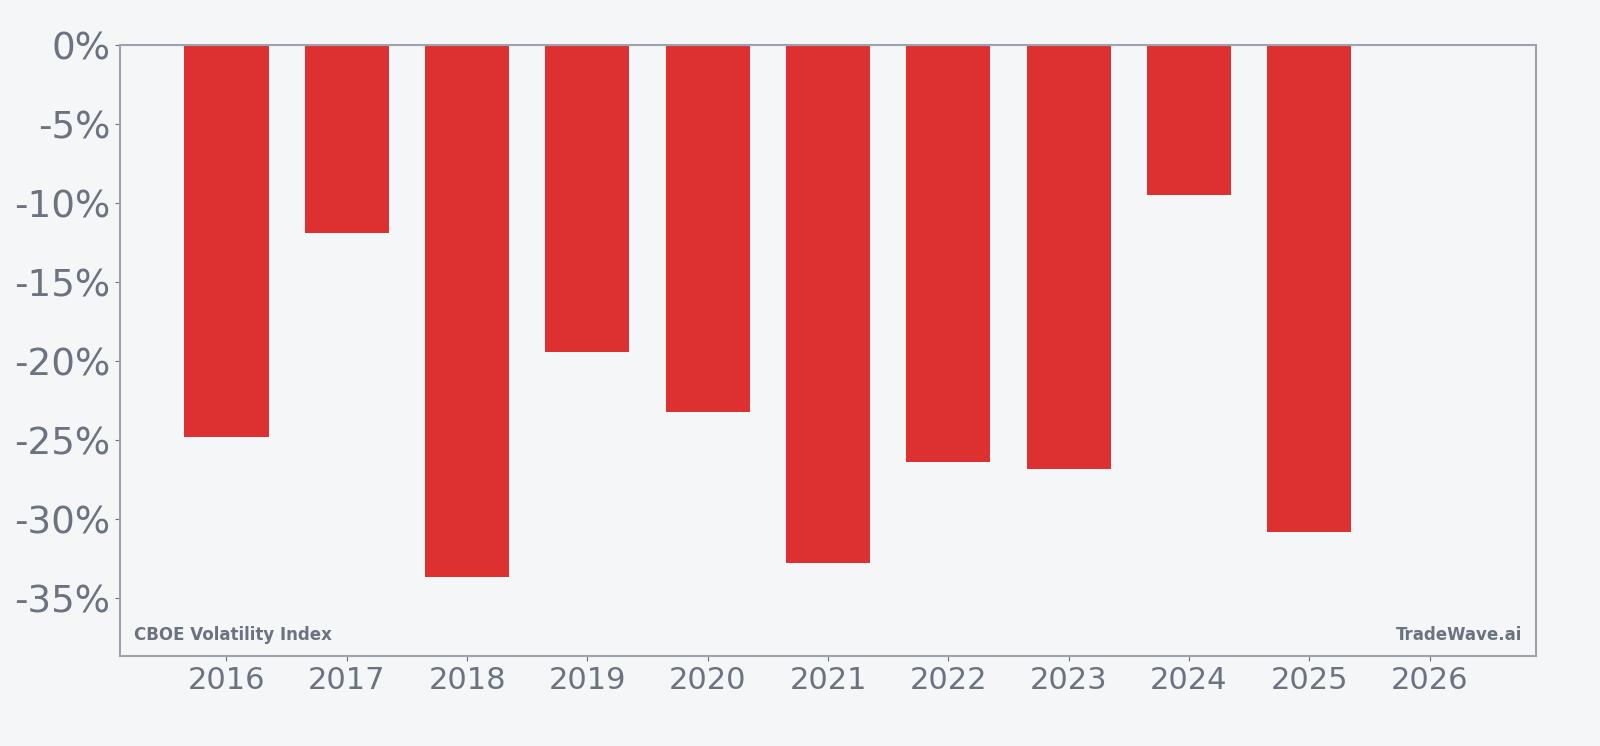
Trade direction for this pattern is explicitly short, which means years where VIX drifted lower over the 130 days were favorable outcomes. Across the 10-year sample, every single window produced a net decline in VIX from entry to exit, with the weakest year for the short side still showing a 9.52% gain and the strongest year delivering a 33.66% profit. Average profit of 23.95% and a median outcome of 25.63% point to a fairly tight cluster of winning years rather than one or two outliers carrying the series.
The per-year table shows how that played out in specific episodes. In 2018, a short entered around 18.36 and exited near 12.18, a 33.66% gain even though VIX saw a best intraperiod spike of 41.67% above entry and a worst drawdown of 40.58% below it. In 2025, the pattern captured a 30.84% profit from a 24.87 entry to a 17.20 exit, but not before VIX surged as much as 141.78% above the starting level at one point and then swung 36.87% below it later in the window. That mix of large spikes and lower closes is exactly what a short-volatility seasonal pattern looks like in practice.
The 10-year seasonal trend chart smooths those episodes into an average path that slopes lower across most of the 130 days. The typical pattern shows VIX holding up or even popping early in the window, then grinding down through the middle portion before flattening out into the exit. That shape fits a market where equity stress events can still hit, but the dominant tendency over this stretch has been for implied volatility to compress as risk assets stabilize.
Yearly net and peak moves highlight how often sharp volatility spikes have still resolved into lower closes by the end of the window.
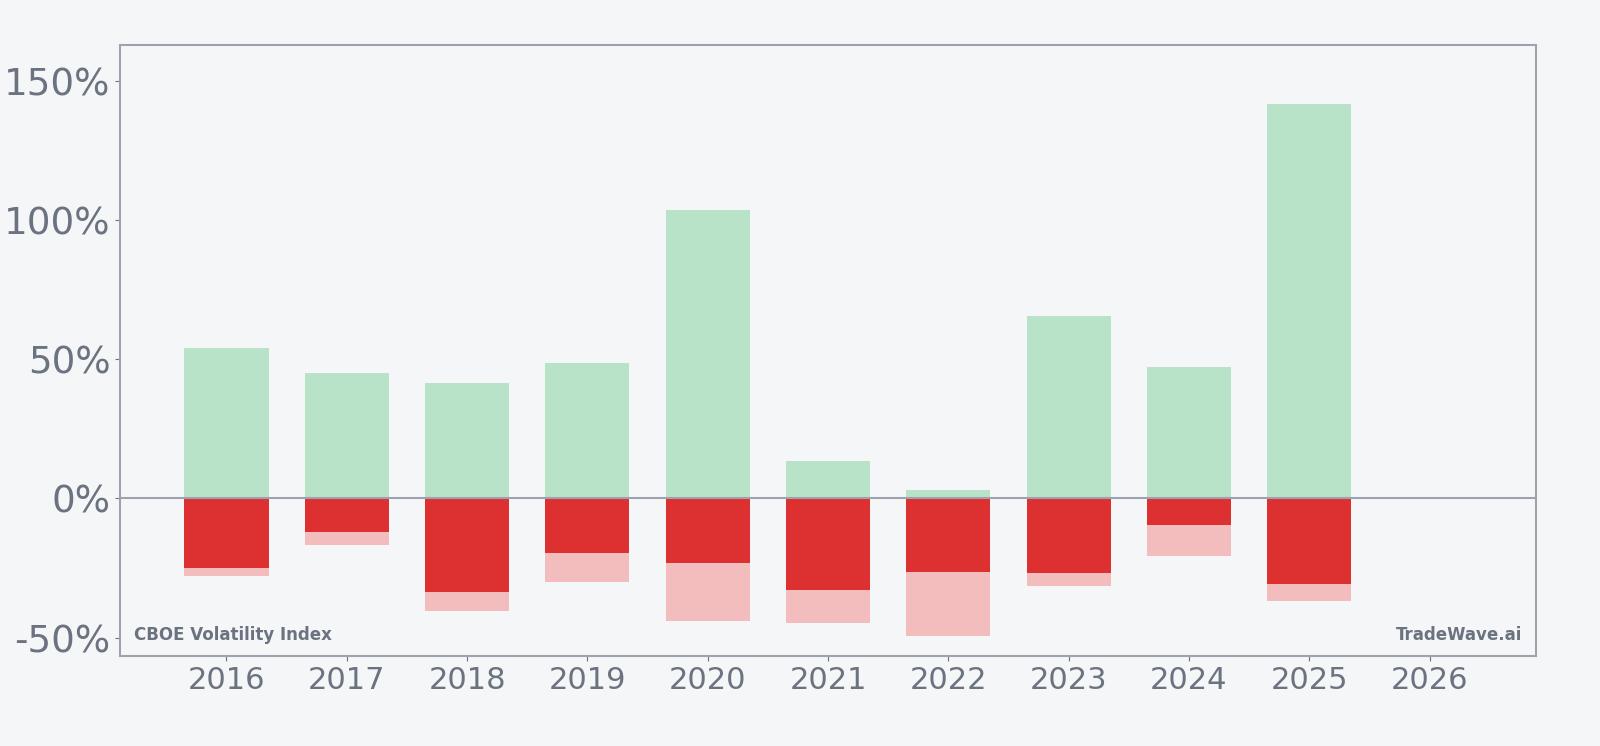
The combined net, maximum favorable excursion and maximum adverse excursion bars drive home how volatile the ride has been even in a perfect 10-for-10 stretch. In 2020, for example, VIX more than doubled at its peak, with a best intraperiod move of 103.79% above entry, yet the window still closed with a 23.25% profit for the short side as volatility bled off from crisis levels. On the downside, worst intraperiod drawdowns for shorts have reached as deep as 49.38% in 2022, meaning VIX traded nearly half below the entry level at one point before rebounding into a still-profitable close. Large MFE and large MAE together flag this as a high-variance window where both sharp rallies and deep fades have been common.
History does not guarantee future results, and the worst intraperiod excursions have been large even in years that ultimately finished as winners for the seasonal short-volatility pattern.
Price and near-term drivers
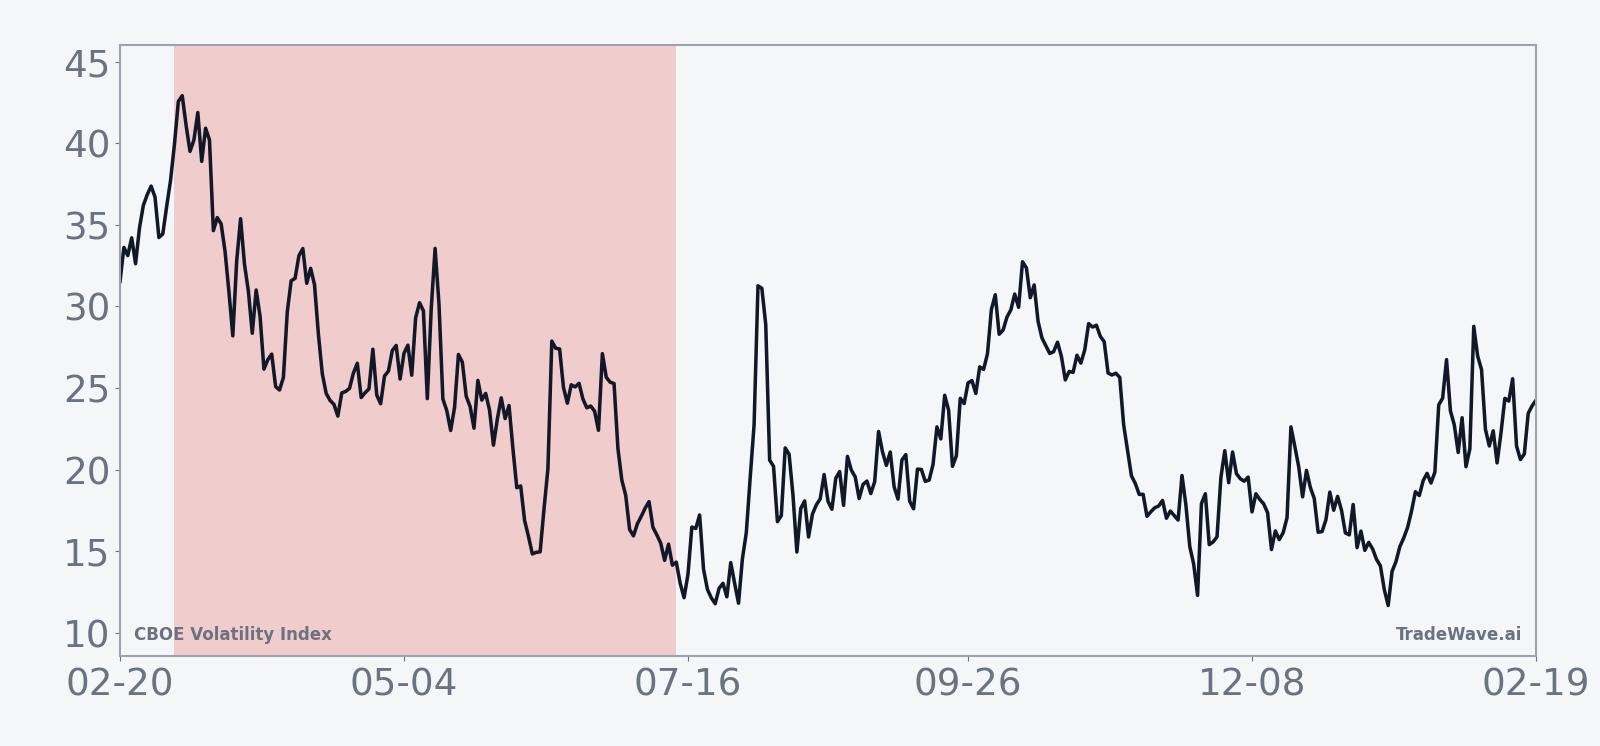
VIX closed at 23.75 on Mar 6, up 12.29% on the day, after trading between 20.55 and 25.84 in a wide intraday range. That leaves the index sitting roughly in the middle of its past-year band, about 60.5% below the 52-week high of 60.13 and 77.6% above the 52-week low of 13.38, with the 50-day moving average down at 16.94 and the one-month return running 9.66%. The level is elevated enough to reflect lingering demand for protection but not yet in outright panic territory, a setup that has often preceded volatility compression in prior iterations of this seasonal window.
The chart below situates the latest move in its recent multi-month context.
In prior cycles, macro shocks have repeatedly driven VIX sharply higher before the seasonal pattern reasserted itself. In March 2025, tariff anxiety pushed the index near 30 for the first time since an earlier summer shock, as investors scrambled for downside protection in options markets.[3] In April 2025, escalating trade tensions sent VIX above 40 for the first time since the pandemic era, underscoring how quickly implied volatility can overshoot when policy risk collides with crowded positioning.[1] Those episodes sit inside the same broad spring–summer window that, on a full-period basis, has still tended to resolve with lower volatility by the end.
Options positioning has often mirrored that push and pull. During the 2025 trade-war flare-up, investors were reported to be adding protection via VIX structures, including put spreads that effectively bet on volatility spiking and then easing back rather than staying pinned at extremes.[3] That kind of structure lines up with the historical pattern in this window: room for big intraperiod spikes, but a tendency for implied volatility to fade as equity markets find their footing. Because VIX typically moves opposite to broad equity indices, a seasonal bias toward lower volatility over this stretch has often coincided with periods where stocks grind higher or at least stabilize after earlier shocks.
What to watch in this window
The next 130 trading days put VIX inside a regime that has historically favored short-volatility exposure, but the path has rarely been smooth. The first marker to watch is how VIX behaves relative to its 50-day moving average near 16.94. In prior years, sustained breaks back toward or below that band have often lined up with the middle portion of the window, when the seasonal trend toward lower implied volatility has tended to accelerate.
Second, monitor whether any macro shock produces a spike that resembles the large maximum favorable excursions seen in 2020 and 2025. A move that sends VIX sharply higher but then fails to hold those levels into the back half of the window would be consistent with the historical pattern of big intraperiod swings resolving into lower closes. By contrast, a spike that stays sticky into late in the window would mark a clear departure from the past decade’s behavior.
Third, keep an eye on options flow around volatility products. In 2025, investors used VIX options, including put spreads, to express views that volatility would surge and then cool off rather than remain elevated indefinitely.[3] If similar structures reappear in size during this window, it would suggest that institutional traders are again leaning into the idea that volatility shocks are tradable events inside a broader regime of compression. A shift toward outright long-volatility positioning without those hedged structures would signal a market that is less confident in the seasonal fade.
Finally, watch how equity indices respond to any VIX spikes. Historically, this window has seen volatility shocks tied to trade and policy headlines, followed by periods where stocks stabilize and implied volatility drifts lower.[1][3] If this year’s window instead features persistent high VIX readings alongside sustained equity weakness, that would be a meaningful break from the last decade’s pattern and a sign that the volatility regime itself may be changing.
Sources
- [1] Business Insider, "Inside the volatility-trading strategy one investor is using to capitalize on Trump market madness" (Apr 29, 2025)
- [2] CNBC, "Market volatility reflects AI trade anxiety ahead of Mag 7 earnings, says Cboe's Xu" (Oct 23, 2025)
- [3] Bloomberg, "VIX Nears 30 First Time Since August Shock on Tariff Anxiety" (Mar 10, 2025)