Fed Rate-Cut Hopes Extend Rally in S&P 500 Healthcare Sector SPDR (XLV)
S&P 500 Healthcare Sector SPDR is nearing a midterm-year stretch that has often favored downside, giving investors a structured way to think about potential volatility into late spring.

Key takeaways
- A 49-day seasonal window for S&P 500 Healthcare Sector SPDR begins on Mar 18, 2026, aligned with the midterm election year phase of the presidential cycle.
- In the last 6 comparable midterm election years, the pattern has favored a short trade direction, with XLV finishing lower at the end of every window.
- Percent Profitable is 100%, with 6 winners and 0 losers for the short setup, and an average profit of 3.9% across those years.
- Individual years have seen net declines between about 2% and 6% for XLV during the window, highlighting a consistent but moderate downside bias.
- Intraperiod swings have included meaningful adverse moves against the short side, so traders considering the pattern need to account for drawdown risk even in historically “winning” years.
- The window sits in the early part of the midterm election year, a phase that has often been choppier for risk assets as policy and rate expectations reset.
According to historical data from TradeWave.ai, this upcoming stretch for XLV has shown a distinct election-cycle pattern in prior midterm years. The next section looks at how that behavior has unfolded across the last six comparable cycles.
Seasonal window
This seasonal window begins on Mar 18, 2026 and spans 49 trading days. Historically, during this period, S&P 500 Healthcare Sector SPDR has shown a weak directional tendency, with prices tending to drift lower by the end of the window in midterm election years. With XLV’s latest quote data not yet available for Feb 27, 2026, the focus for investors is less on today’s tick and more on how this pattern has behaved when the calendar reaches this part of the cycle.
The analysis groups history by the presidential election cycle, focusing on the last six midterm election years rather than consecutive calendar years. That matters for healthcare because policy expectations, regulation risk and fiscal priorities often shift in recognizable ways across the four-year cycle, and sector ETFs like XLV tend to respond more to those structural forces than to the calendar alone.
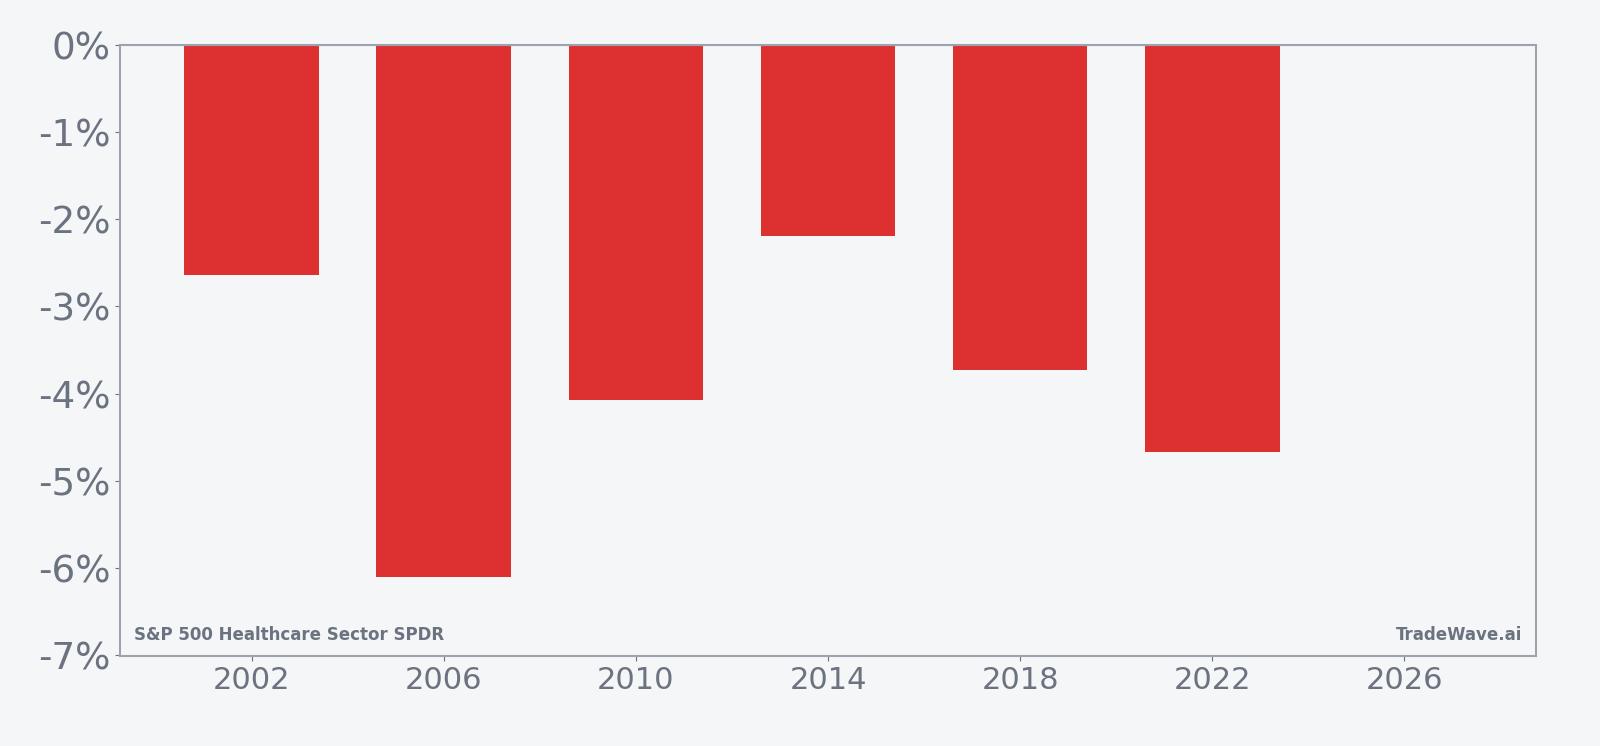
Trade direction for this pattern is short, meaning the historical tendency has been for XLV to end the 49-day window below its starting level. Percent Profitable is 100%, with 6 winners and 0 losers for the short setup, and the average profit across those years is 3.9%. In practice, that has translated into net declines of 2.19% in 2014, 2.64% in 2002, 3.73% in 2018, 4.07% in 2010, 4.67% in 2022 and 6.1% in 2006 over the course of the window.
The average winner gain of 3.9% for the short side means that, across the sample, XLV has typically delivered a mid-single-digit decline from entry to exit during this stretch. Because there were no losing years in the lookback, the all-years average is effectively the same as the average profit figure, underscoring how consistently the pattern has leaned in favor of downside outcomes for this specific midterm-year window.
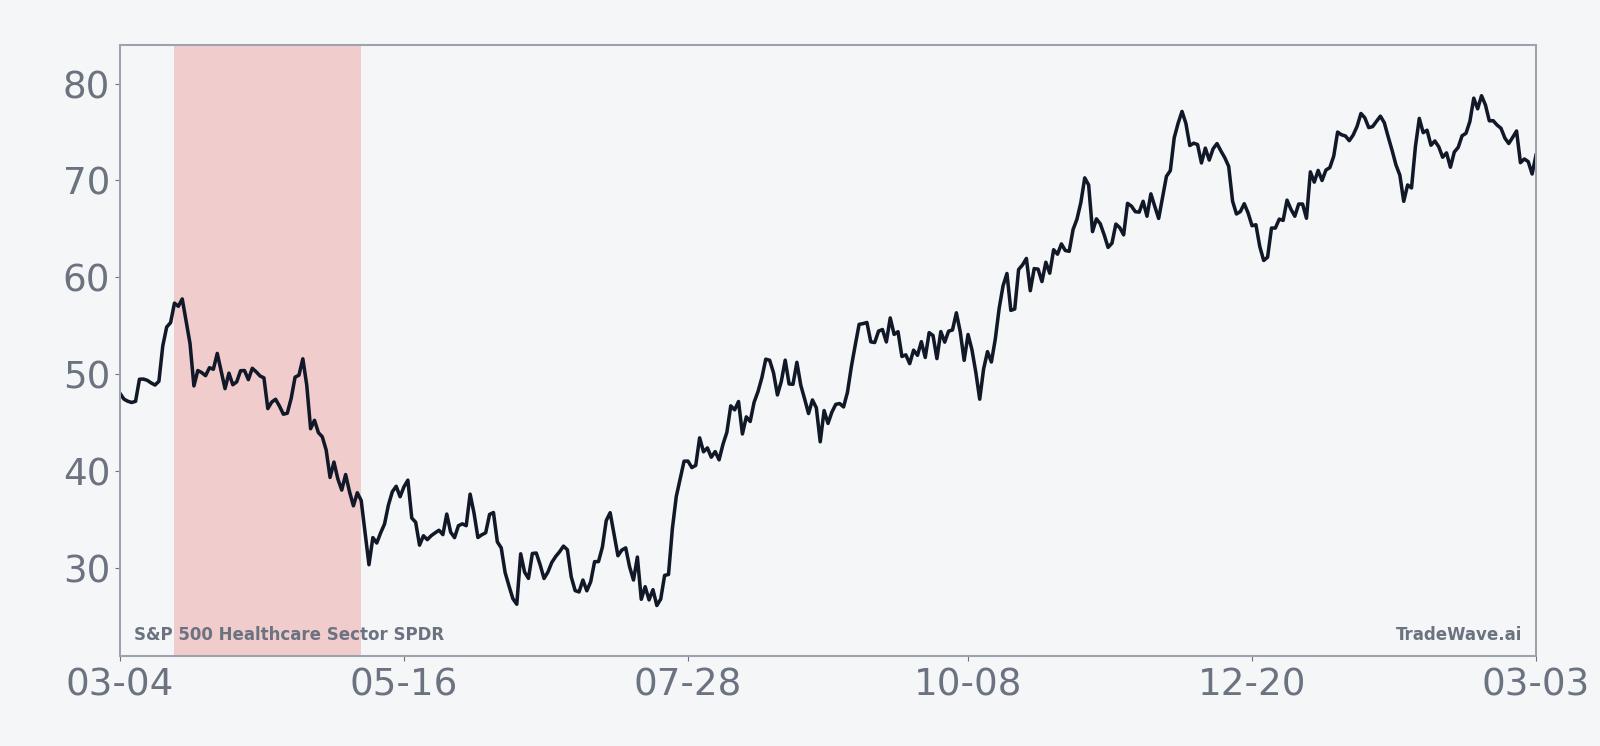
The historical seasonal average suggests that weakness in this window has tended to build gradually rather than in a single sharp break. In several years, XLV saw modest early resilience before sliding more decisively later in the period, which fits with a pattern where policy uncertainty and shifting rate expectations weigh on healthcare as the midterm year progresses.
A closer look at yearly net returns alongside best and worst intraperiod swings helps frame both opportunity and risk.
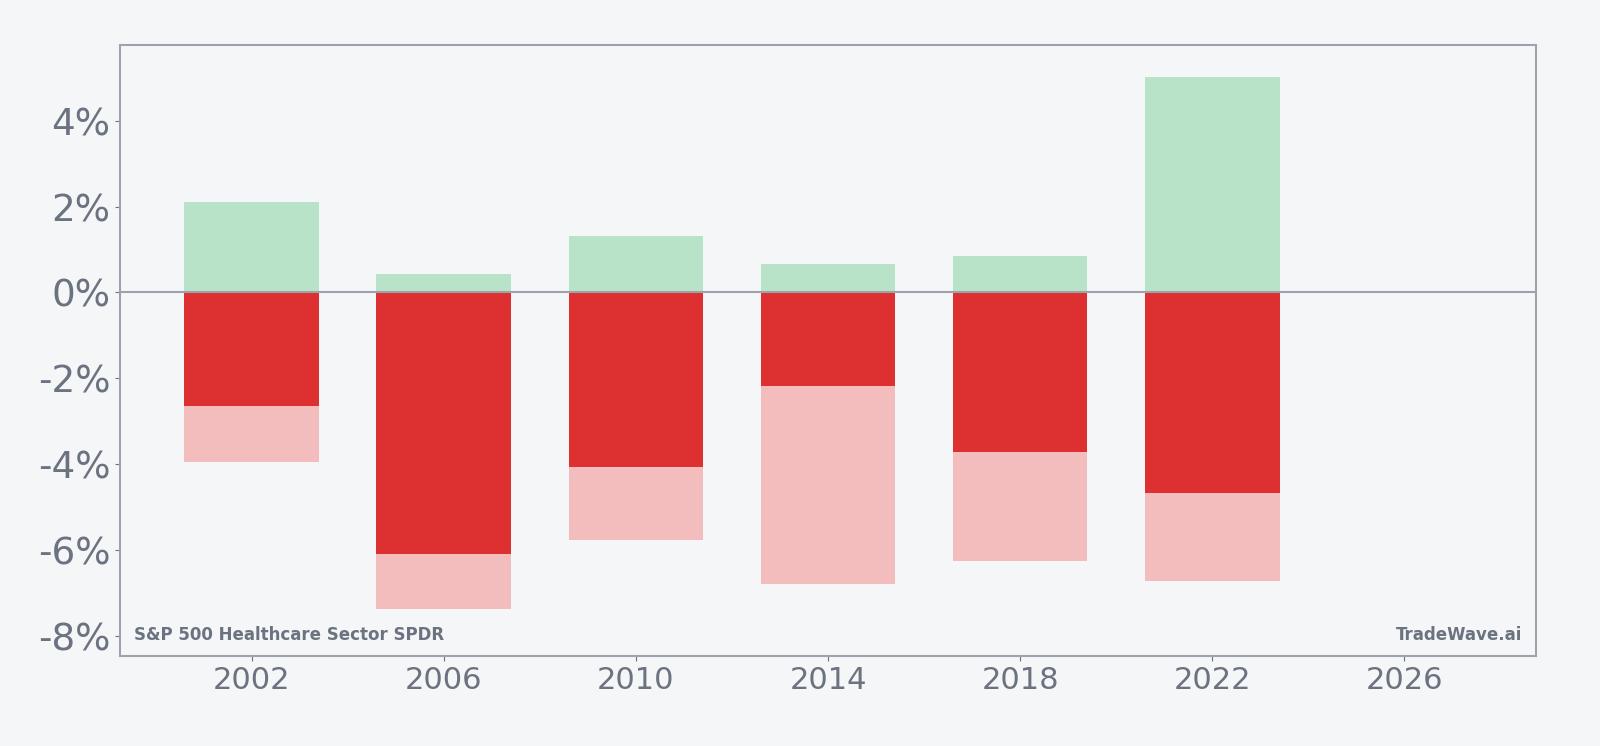
The per-year data show that even in winning years for the short setup, XLV has often experienced sizable intraperiod swings. For example, in 2022 the net return for the window was a 4.67% decline, yet the maximum favorable move for the short side reached 5.02% while the maximum adverse move against it was 6.73%, highlighting that rallies against the pattern can be larger than the final outcome. In 2006, the short trade finished with a 6.1% gain, but the worst drawdown from entry was 7.38%, again underscoring that adverse excursions can be significant even when the window ultimately aligns with the historical bias.
The cumulative return profile across all six midterm years adds up to a 25% gain for the short direction, with an annualized return of 3.89% and a Sharpe ratio of 2.39. That combination points to a pattern that has been both consistent and meaningfully directional in this phase of the election cycle, even as individual years have featured choppy paths and notable countertrend rallies. Taken together, the historical pattern defines the quantitative seasonal backdrop for the current period.
History does not guarantee future results, and the size of adverse excursions within the window has at times been large even when the short-side pattern ultimately finished profitable.
Price and near-term drivers
XLV’s most recent detailed quote data for Feb 27, 2026 are not yet available, but the ETF enters this seasonal setup after a powerful advance in the prior year. In Nov 2025, reporting showed that XLV had risen about 25% from its August low, leading S&P 500 sectors over one- and three-month horizons and prompting debate over whether the move had become overbought.[1]
That earlier rally unfolded against a macro backdrop in which investors grew more confident that the Federal Reserve would pivot toward rate cuts, a shift that has often supported defensive and income-oriented sectors such as healthcare.[3] In Aug 2025, healthcare stocks in the S&P 500 gained 1.4% in a single session, leading sector performance as markets priced in a potential September rate cut, highlighting how sensitive XLV can be to changes in policy expectations.[3]
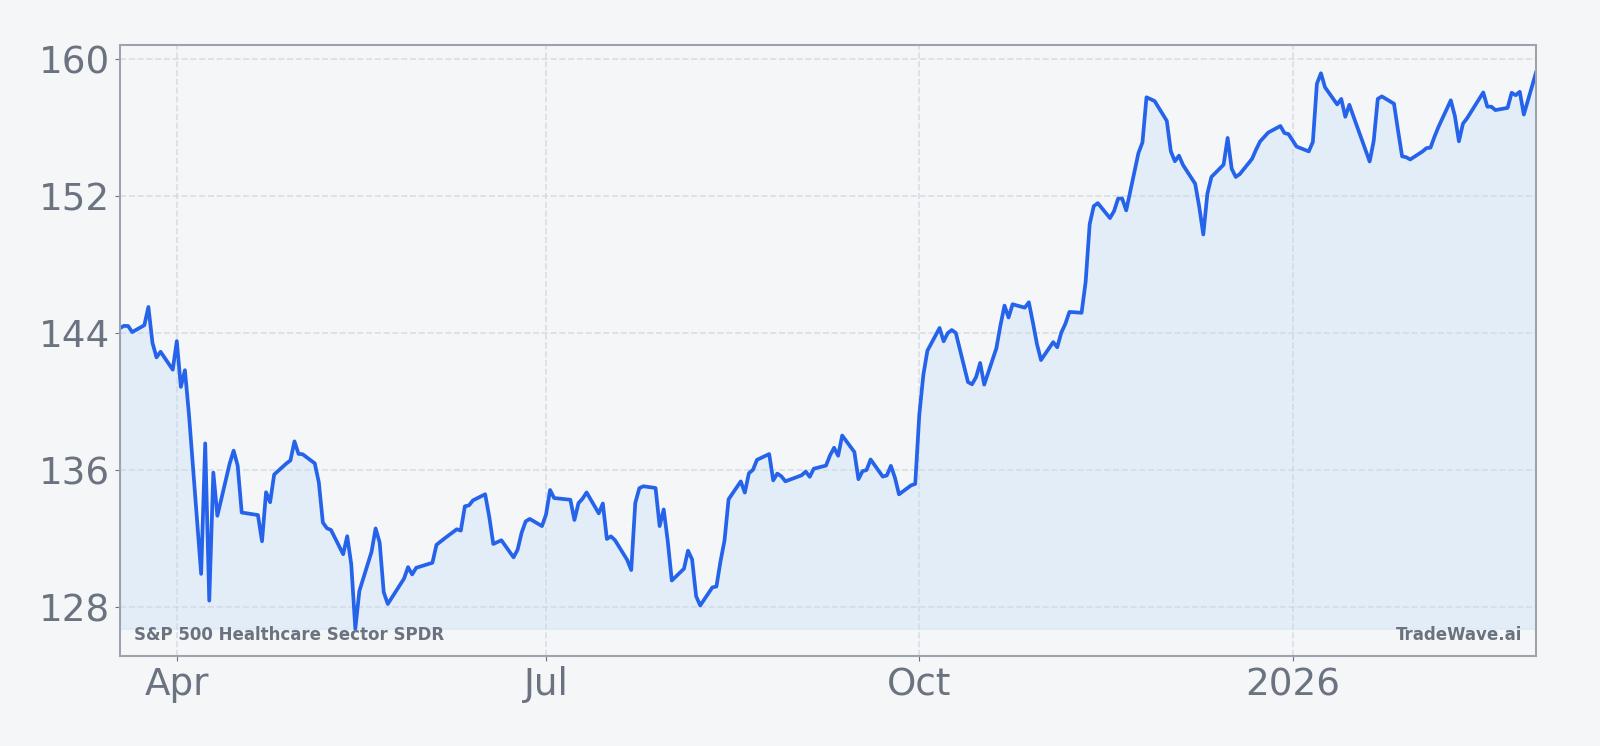
The chart below situates XLV’s latest trading range within its recent 12-month path.
For healthcare investors, the combination of a strong prior-year run and an approaching midterm-year window that has historically leaned lower creates a tension between momentum and seasonality. In Nov 2025, analysts noted that XLV’s leadership came despite concerns about stretched technicals and the durability of the move, suggesting that any shift in the macro narrative or policy outlook could have an outsized impact on the sector.[1]
What to watch as the window opens
As the Mar 18 start date approaches, the key question for traders is whether XLV will again follow the midterm-year pattern of softening over the subsequent 49 trading days or whether the sector’s prior strength will blunt that tendency. Historically, the window has produced moderate but consistent declines for the ETF, with every one of the last six midterm election years ending lower over the period, even when intraperiod rallies were sharp.
Several catalysts could shape how closely this cycle tracks the historical script. First, the policy calendar around the early midterm year will be important, particularly Federal Reserve meetings and any shifts in guidance on the pace and depth of rate cuts, given healthcare’s sensitivity to discount-rate expectations.[3] Second, investors will be watching for signs of changing sentiment toward defensive sectors if broader equity markets remain firm, since rotation out of healthcare leadership could reinforce the seasonal downside bias.
From a price perspective, traders may focus on how XLV behaves around recent support and resistance levels visible on the 12-month chart. A pattern of lower highs and heavier selling into rallies during the window would be more consistent with the historical short-side tendency, while a decisive break to new highs with contained pullbacks would represent a clear departure from prior midterm-year behavior.
Finally, because the historical pattern features sizable intraperiod swings, monitoring volatility will be crucial. Episodes where XLV rallies sharply early in the window before rolling over have been common in the past, so the presence or absence of that “head fake” structure could offer clues about whether this cycle is tracking the established template or diverging from it. For investors and traders alike, the seasonal statistics do not dictate a course of action, but they provide a structured backdrop against which to interpret price moves and policy headlines as the midterm-year window unfolds.