Energy Stocks Eye Breakout as Policy Shifts and Oil Demand Debates Swirl Around S&P 500 Energy SPDR (XLE)
S&P 500 Energy Sector SPDR is stepping into a midterm-year stretch that has reliably skewed higher in the past, giving traders a structured backdrop as they weigh policy shifts, oil dynamics and the sector’s recent underperformance.

Key takeaways
- XLE is entering a 54-day seasonal window tied to midterm election years that has historically been a strong period for the ETF.
- Across the last 6 comparable midterm election years, the pattern has been profitable in 100% of cases, with 6 winners and 0 losers.
- Average profit in those winning years was 9.33%, with a cumulative gain of 70% over the sample.
- The trade direction for this window is long, supported by a Sharpe ratio of 3.17 and a TradeWave Ratio of 2.97.
- Intraperiod swings have included meaningful drawdowns in some years, underscoring that adverse moves can occur even within an overall positive pattern.
- The window sits in the early part of the midterm election year, when policy uncertainty and sector rotation often amplify volatility in energy stocks.
According to historical data from TradeWave.ai, this part of the calendar has shown a distinct pattern for XLE in past midterm election years, and the next several weeks will test whether that tendency reappears.
Seasonal window
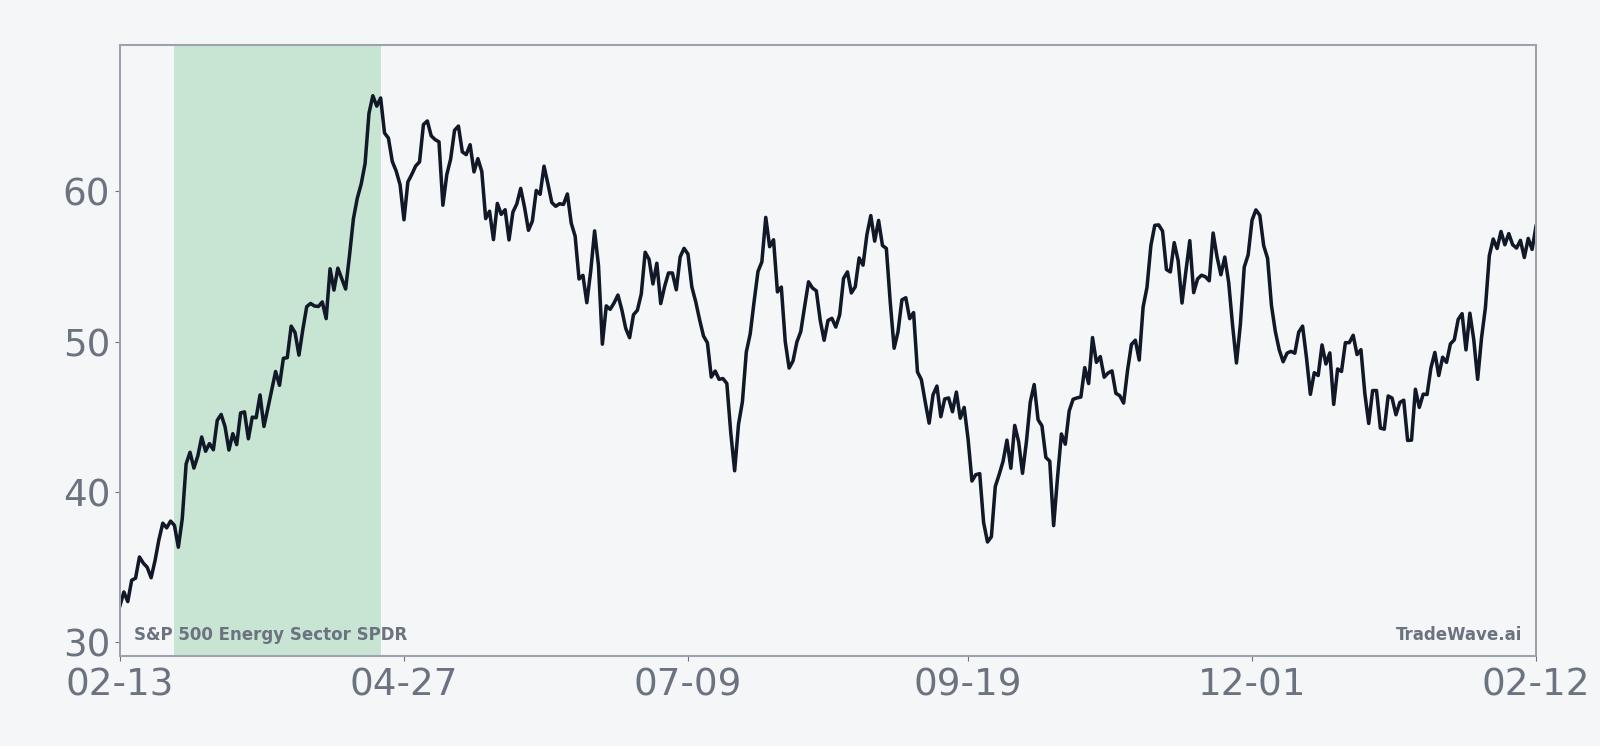
This seasonal window begins on Feb 27, 2026 and spans 54 trading days. Historically, during this period, S&P 500 Energy Sector SPDR has shown a strong upward tendency in the last six midterm election years, even as the broader energy sector has often been choppy in early midterm-year trading.[8]
Grouping the data by the presidential election cycle matters here because midterm years have tended to feature a different policy and liquidity backdrop than other phases, with debates over regulation, drilling policy and fiscal priorities often weighing more heavily on energy than on the broader market.[8] In this framework, the current pattern phase is the midterm election year, and the calendar phase is also the midterm election year in its early part, so the historical sample is drawn from the last six times the market was in this same point of the political cycle.
Within that midterm-year grouping, the trade direction for this pattern is long, and every one of the six historical instances finished higher over the 54-day span. Percent Profitable is 100%, with 6 winners and 0 losers, and the average profit across those winning years was 9.33%, contributing to a cumulative return of 70% for the sample. The median outcome, at 8.19%, sits slightly below the average, which suggests that a few stronger years, such as 2006 and 2022, pulled the mean higher.
Average loss is recorded as 0% because there were no losing years in this particular window, so there is no separate “typical” down-year profile to reference. Instead, the dispersion shows up in the range of winning outcomes, from a net return of 7.06% in 2002 to 13.7% in 2006 and 11.73% in 2022. For context, the Sharpe ratio of 3.17 indicates that, based on end-of-window results, the historical risk-adjusted return has been unusually strong for a sector ETF over this specific slice of the calendar.
The TradeWave Ratio for this pattern is 2.97. TradeWave Ratio (TWR) reflects how far price typically travels in the trade direction within the window regardless of the final close, so a value near 3 suggests that intraperiod rallies have often been sizable relative to the underlying volatility profile. That aligns with the historical tendency for XLE to trend persistently higher once the window gets underway, rather than grinding sideways.
Looking at individual years, 2006 stands out as one of the strongest examples, with a net return of 13.7% and a maximum favorable move of 13.91% from the entry point before the window closed. At the other end of the spectrum, 2002 delivered a still-positive 7.06% net gain with a 10.93% best run-up, while 2010 and 2014 clustered around 7% to 8% net returns, reinforcing the impression of a relatively tight band of positive outcomes rather than a mix of big wins and deep losses.
Intraperiod risk has been present even in these winning years. Maximum adverse moves, which measure the worst drawdown from the entry price during the window, ranged from a shallow -0.26% in 2002 to -4.28% in 2018. The 2006 and 2018 patterns both saw drawdowns of around -4% at some point during the 54 days, even though they ultimately finished with net gains of 13.7% and 8.73% respectively. In practical terms, that means that traders following the historical pattern have had to tolerate several percentage points of downside at times before the longer-term seasonal tendency reasserted itself.
The historical seasonal trend chart for this window shows a relatively steady climb rather than a late-surging or front-loaded profile. On average, returns have tended to build gradually across the 54 days, with only modest pauses, which is consistent with the high share of winning years and the relatively low standard deviation of 2.76% across outcomes. That pattern suggests that, in prior midterm election years, energy stocks have often found a bid through this part of the spring as policy uncertainty begins to be priced in and commodity markets settle after the first quarter.
Year-by-year bars that combine net results with best and worst intraperiod moves help clarify how much upside and downside has typically appeared inside this window.
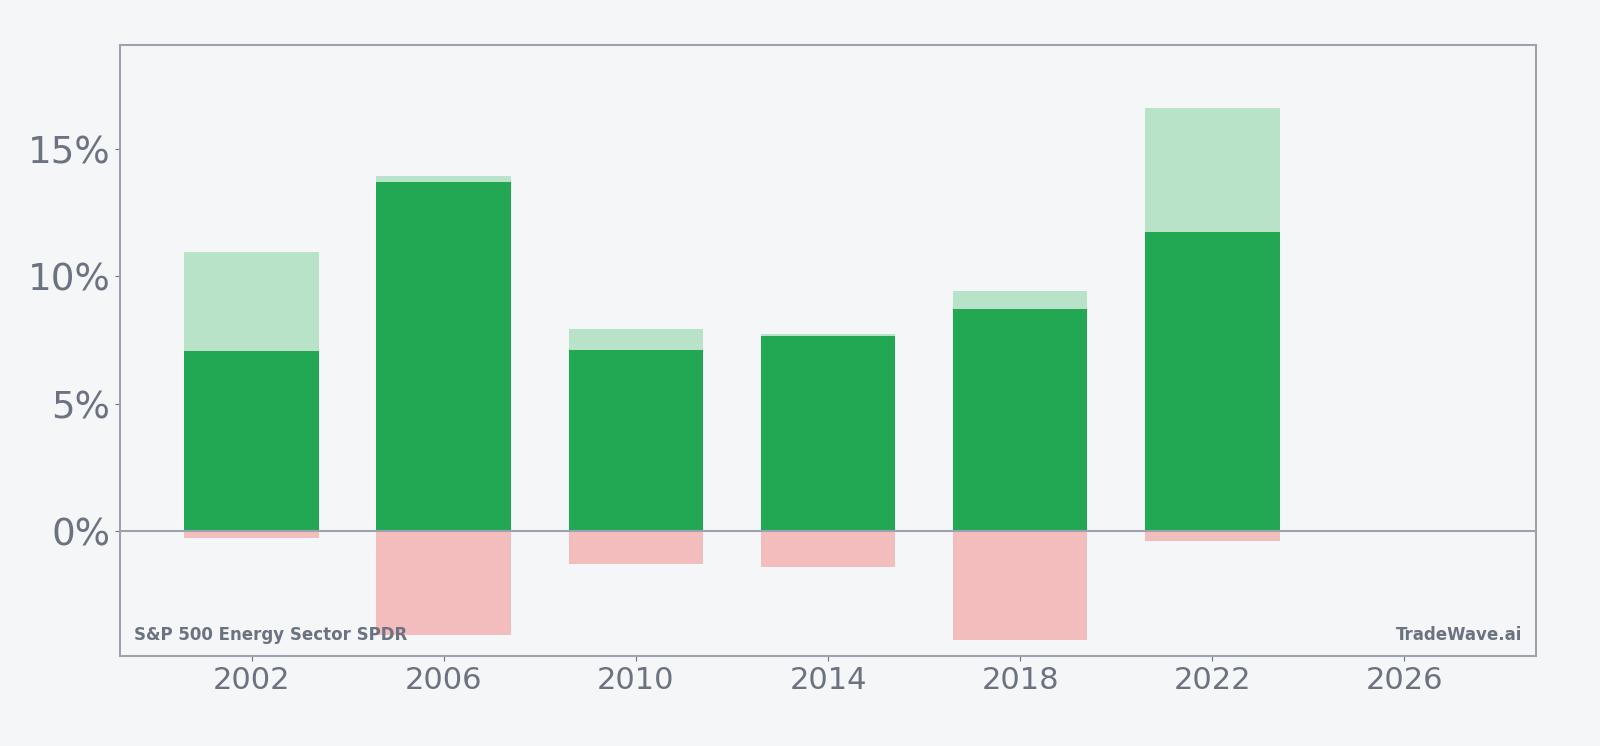
History does not guarantee future results; adverse excursions (MAE) can be large even in winning windows.
Taken together, the historical pattern defines the quantitative seasonal backdrop for the current period.
Price and near-term drivers
Real-time pricing data for XLE are limited in this dataset, but the ETF has been trading against a backdrop of sector underperformance and shifting expectations for energy demand and policy. In 2025, the energy sector lagged the broader market, with XLE’s heavy weighting toward Exxon Mobil, Chevron and ConocoPhillips concentrating exposure in a handful of integrated majors that together made up nearly half of the fund’s holdings.[8]
The chart below situates the latest move in its recent multi-month context.
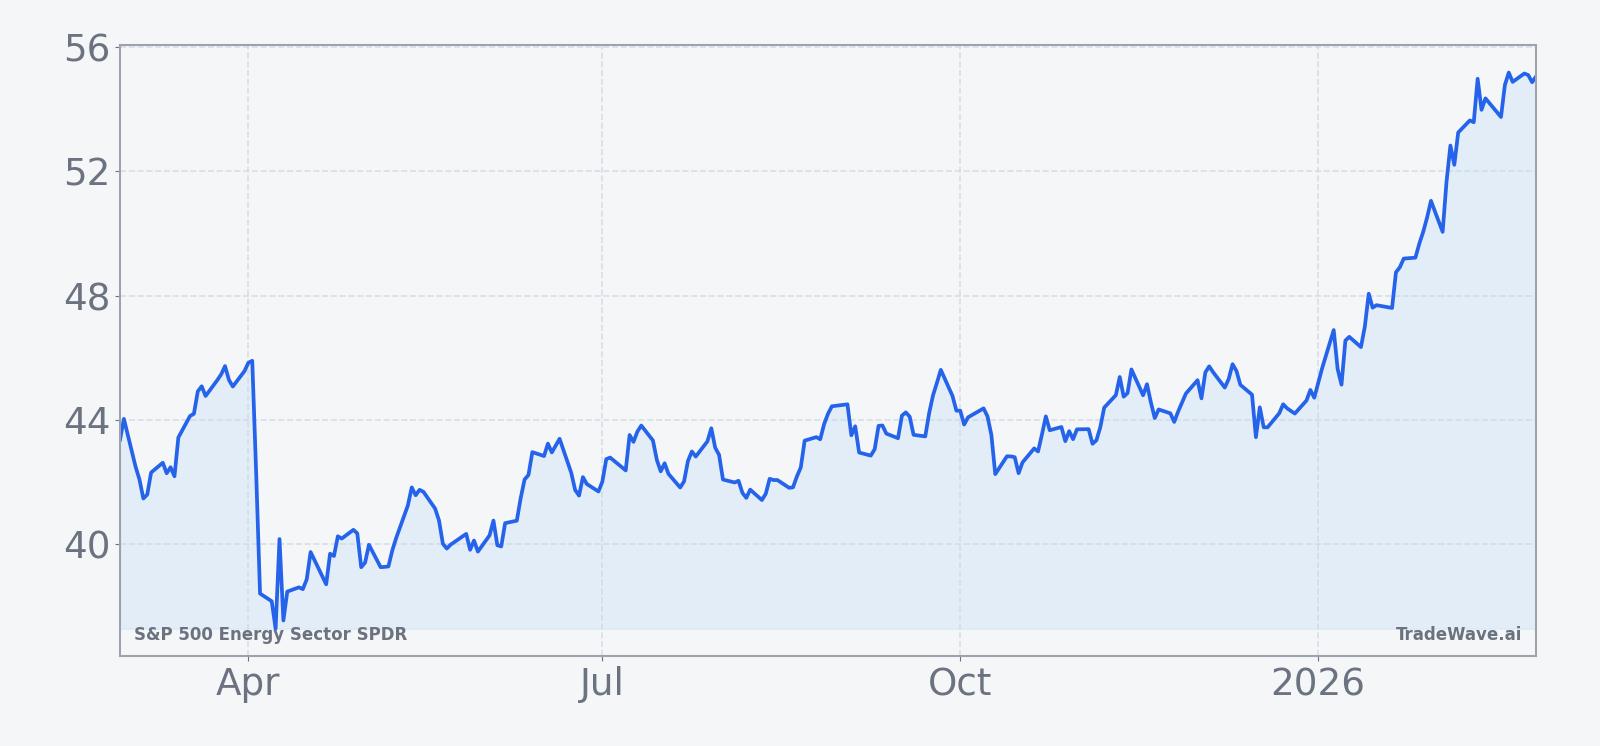
In Oct 2025, strategists highlighted the energy sector as “due for a bounce,” arguing that valuations had fallen to a discount and that options on XLE offered a way to position for a potential comeback in a noisy macro environment that included government shutdown risk.[8] By Nov 2025, technical analysts described XLE as sitting at a major inflection point, trading into the apex of converging trendlines with the potential for an upside breakout if buyers could regain control.[9]
At the industry level, the picture has been more nuanced. Refiners showed momentum into late 2025, midstream operators benefited from continued growth in liquefied natural gas exports, and upstream producers were still generating healthy cash flows, even as the sector as a whole lagged headline indices.[10] That mix of solid fundamentals in parts of the value chain and lackluster ETF-level performance has left some investors debating whether XLE is a value opportunity or a value trap as the midterm election year unfolds.
Macro and political backdrop
The policy environment is a key part of the story in a midterm election year. A new administration’s “Drill baby, Drill” messaging has signaled a friendlier stance toward domestic production, although leading energy names have delivered mixed share-price performance despite that rhetoric.[8] For XLE, which bundles integrated majors, refiners and other energy plays, the interaction between policy support, regulatory uncertainty and commodity prices can be more important than any single headline.
Midterm election years have historically featured elevated debate over environmental regulation, permitting and export policy, all of which can influence capital spending plans and investor sentiment toward energy. At the same time, the macro backdrop for equities more broadly has been shaped by expectations for Federal Reserve policy and the path of interest rates, with some strategists in 2025 arguing that eventual rate cuts would support U.S. stocks but with more muted gains than in past easing cycles.[2] For a high-dividend, capital-intensive sector like energy, the interaction between rates and cash-flow visibility is particularly important.
Another layer is the global demand picture. While this dataset does not include explicit oil price forecasts, the sector’s 2025 underperformance occurred alongside ongoing questions about the durability of post-pandemic demand, the pace of the energy transition and the impact of geopolitical tensions on supply routes.[10] Those same forces are likely to remain in focus through the current 54-day window, potentially amplifying or dampening the historical seasonal tendency depending on how they evolve.
What to watch in this window
For traders and investors tracking this seasonal pattern, the first question is whether XLE behaves in line with its historical midterm-year script by grinding higher through the bulk of the 54-day span. A steady, stair-step advance with only modest pullbacks would be consistent with the average seasonal trend, while a failure to hold early gains or a sharp break below recent ranges would mark a departure from the last six cycles.
Policy and macro catalysts will be central. Any concrete moves on drilling permits, pipeline approvals or export rules could shift sentiment quickly, particularly given the sector’s sensitivity to regulatory signals in prior midterm election years.[8] On the macro side, updates on inflation and central bank policy that alter the expected path of interest rates could influence appetite for high-dividend, cyclical sectors like energy relative to growth-heavy parts of the market.[2]
Within the ETF, the performance of its largest constituents will also matter. Because Exxon Mobil, Chevron and ConocoPhillips together accounted for nearly half of XLE’s exposure in 2025, any company-specific surprises on capital allocation, buybacks or production plans could disproportionately sway the fund’s path through the window.[8] Investors may also watch whether strength in refiners and midstream operators, which showed momentum and benefited from LNG growth in late 2025, continues or fades as the year progresses.[10]
Finally, behavior inside the window will offer a real-time test of the historical pattern. A scenario in which XLE rallies but repeatedly experiences 3% to 4% pullbacks would echo the past mix of sizable maximum favorable moves and occasional adverse excursions. By contrast, a flat or sharply negative outcome would break a six-for-six winning streak in this specific midterm-year window and could signal that shifting policy priorities, changing demand patterns or evolving investor preferences are reshaping how energy trades around the election cycle.
Sources
- [1] Seeking Alpha, "Cantor Fitzgerald doesn’t believe in Wall Street’s recent reprieve rally," Mar 21, 2025.
- [2] Seeking Alpha, "Fed rate cuts likely to support U.S. equities, but with muted gains: BMO’s Belski," Sep 14, 2025.
- [3] CNBC, "Stocks making the biggest moves premarket," Oct 22, 2025.
- [4] Seeking Alpha, "Exxon Mobil Q3: Guyana, Permian, And Capital Strength Confirm A Bullish Breakout (XOM)," Nov 5, 2025.
- [5] MarketBeat, "Endeavour Silver (NYSE:EXK) Announces Earnings Results," Nov 8, 2025.
- [6] MarketBeat, "HudBay Minerals Inc $HBM Stock Holdings Raised by Franklin Resources Inc.," Dec 1, 2025.
- [7] MarketBeat, "Lundin Mining (OTCMKTS:LUNMF) Shares Gap Up - Here's What Happened," Nov 8, 2025.
- [8] CNBC, "Energy due for a bounce? Trading for a comeback in the sector using options," Oct 3, 2025.
- [9] CNBC, "Buy energy stocks for a prospective breakout, says Carter Worth," Nov 14, 2025.
- [10] Forbes, "The Top-Performing Energy Stocks Of Q3 2025," Oct 2, 2025.
- [11] MarketBeat, "Ur-Energy (TSE:URE) Stock Passes Below 50-Day Moving Average - Should You Sell?," Dec 11, 2025.
- [12] MarketBeat, "NexMetals Mining Corp. (NASDAQ:NEXM) Short Interest Up 106.5% in October," Nov 1, 2025.
- [13] MarketBeat, "La Mancha Investments S.à R.L. Sells 253,572 Shares of Endeavour Mining (TSE:EDV) Stock," Oct 11, 2025.
- [14] MarketBeat, "Investors Purchase High Volume of Call Options on Endeavour Silver (NYSE:EXK)," Jun 7, 2025.