Weak Consumer Sentiment Pressures Home Sales at PulteGroup (PHM) Despite Lower Rates
PulteGroup is nearing a midterm-year stretch that has historically favored downside moves even as the stock trades around recent highs, putting the homebuilder’s election-cycle pattern in focus for investors watching housing demand and consumer confidence.

Key takeaways
- PulteGroup is approaching a 228-day seasonal window starting Feb 26 that has historically aligned with weaker price action in midterm election years.
- The pattern is constructed from the last 10 midterm election years and is oriented to a short trade direction, reflecting a tendency for the stock to drift lower over the span.
- Across those 10 historical windows, all years were profitable for the short setup, with 100% Percent Profitable, 10 winners and 0 losers, and an average profit of 22.03%.
- The TradeWave Ratio of 2.86 indicates that price has typically traveled meaningfully in the trade direction within the window, independent of where it finished.
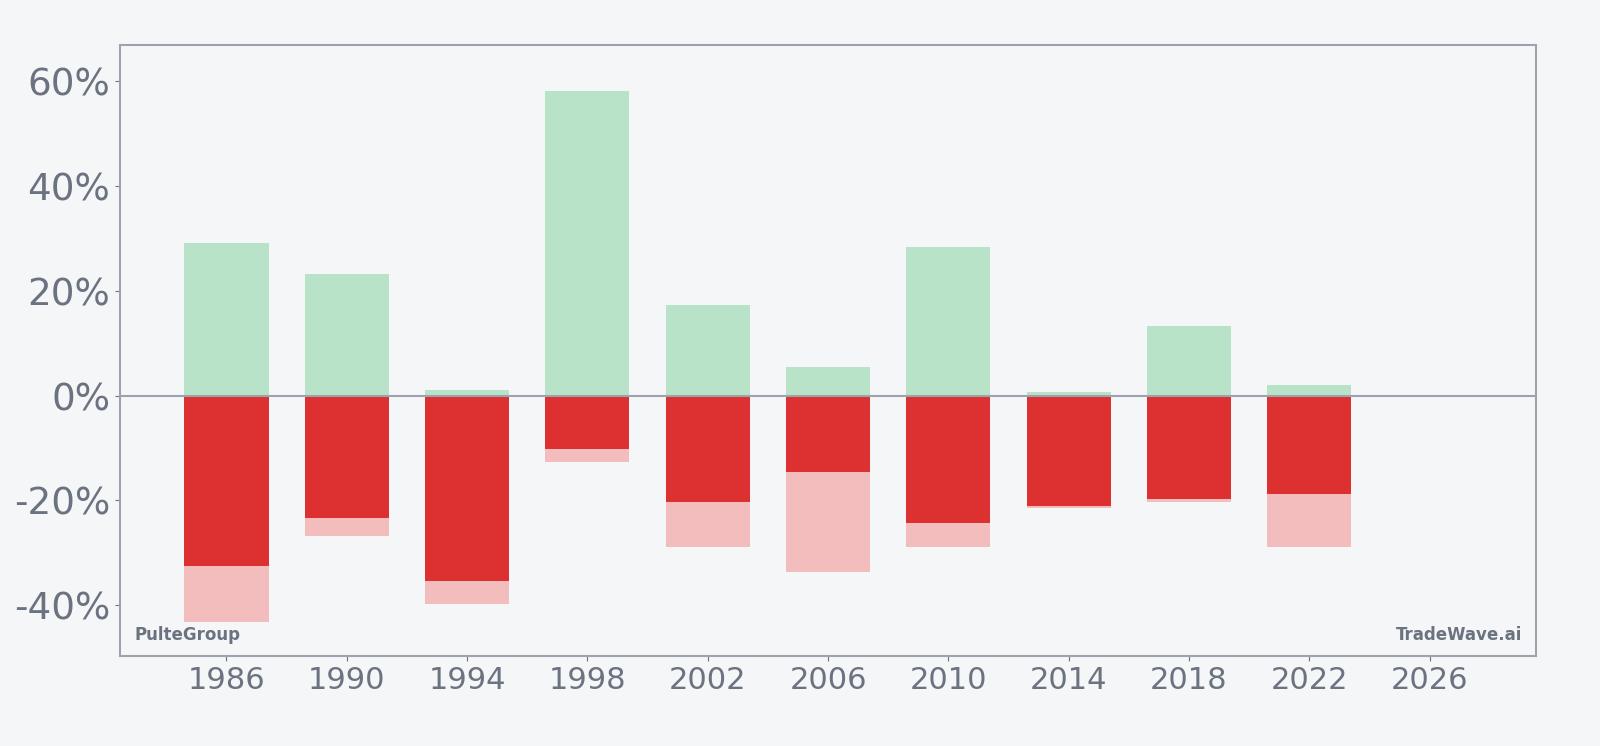
- Intraperiod swings have been sizable, with years such as 1986 and 1994 showing deep adverse excursions before ultimately resolving in favor of the short pattern.
- The window spans the heart of the midterm election year and runs into the following pre-election year, a phase when policy shifts and housing-sensitive macro data can amplify volatility for homebuilders.
According to historical data from TradeWave.ai, this upcoming stretch for PulteGroup sits inside a well-defined election-cycle pattern for homebuilder stocks, and the next section looks at how that backdrop has behaved in prior midterm years.
Seasonal window
This seasonal window begins on Feb 26, 2026 and spans 228 trading days, and it has historically been a weak stretch for PulteGroup when grouped by midterm election years. PulteGroup shares last closed at 140.02, up 0.3% on the day, leaving the stock trading near the upper end of its recent range without a clear 52-week reference point in the available data.[2]
Grouping results by the presidential election cycle means this pattern is built from the last 10 midterm election years rather than from 10 consecutive calendar years. That approach is relevant for a homebuilder like PulteGroup because policy, rates and housing incentives often move in distinct phases across the four-year cycle, with midterm years frequently featuring debates over fiscal priorities and regulation that can affect construction activity and buyer sentiment.
Within this framework, the trade direction for the window is short, indicating that in prior midterm election years PulteGroup has tended to deliver negative returns over this span that would have been favorable for a bearish position. The summary statistics show 100% Percent Profitable, with 10 winners and 0 losers, meaning every historical instance in the sample produced a net decline in the stock price over the 228-day window when viewed from the perspective of a short trade. The average profit across those winning short trades is 22.03%, which reflects the mean percentage drop in PulteGroup’s price from entry to exit over the window.
Because all years in the sample were winners for the short setup, the average profit across all years is effectively the same as the average profit figure, and there is no separate drag from losing years to dilute the result. The median profit of 20.64% sits close to the average, suggesting that the typical outcome has been a moderate double-digit decline rather than a pattern dominated by a single outlier year. The annualized return of 21.82% and Sharpe ratio of 2.6 point to a historically strong risk-adjusted profile for the short pattern when evaluated purely on end-of-window outcomes.
The TradeWave Ratio, or TWR, for this pattern is 2.86. TradeWave Ratio (TWR) is defined as how far price typically travels in the trade direction within the window, independent of the final close. A value above 2 implies that, on average, PulteGroup has tended to move substantially in favor of the short direction at some point during the window, offering meaningful intraperiod excursions even in years where the final net move was closer to the median.
Looking at individual years helps illustrate the range of behavior. In 1994, for example, the stock’s net return over the window was a decline of 35.36%, which would have been a strong outcome for a short position, but the worst intraperiod drawdown from the entry point reached 39.82% against the trade before the move ultimately resolved lower. In 1998, by contrast, the net return was a more modest 10.25% decline, yet the maximum favorable move during the window reached 58.22%, showing that even in less dramatic net years there were sizable swings that could matter for timing and risk management.
The maximum favorable excursion, or MFE, represents the best point-to-peak move in the trade direction within each window, while the maximum adverse excursion, or MAE, captures the worst drawdown from the entry price before the trade recovered or the window ended. Years such as 1986, with an MFE of 29.04% and an MAE of 43.32%, underline that even historically successful short windows have included periods where the stock moved sharply higher before rolling over. That combination of large MFE and large MAE points to a high-variance environment where both rallies and declines have been pronounced.
Across the 10 midterm-year samples, the trend metrics show a consistent bias in favor of the short direction. The “Trend Long” and “Trend Long1” measures both register at 100, while “Trend Short” and “Trend Short1” are at 0, which in this context indicates that the cumulative pattern of returns has been persistently aligned with the short trade rather than oscillating between bullish and bearish tendencies. In practical terms, that means the historical path within the window has more often featured a grinding or stair-step decline than a choppy sideways pattern.
The cumulative return profile for the window, which aggregates the average path of returns across all 10 midterm election years, reinforces this picture. The typical pattern shows PulteGroup weakening over the course of the 228 days, with losses accruing over time rather than being confined to a single brief shock. That kind of structure can matter for investors who are thinking about the interaction between seasonal tendencies and fundamental catalysts such as earnings or macro data releases that fall inside the window.
Because this window begins in the early part of the midterm election year and runs into the following pre-election year, it also overlaps a phase when policy debates around housing, infrastructure and fiscal support can intensify. Historically, that has meant that PulteGroup’s seasonal weakness in this window has unfolded against a backdrop of shifting expectations for interest rates, mortgage affordability and government support for construction, all of which can influence how deeply the stock has traded into its adverse excursions before re-aligning with the broader pattern.

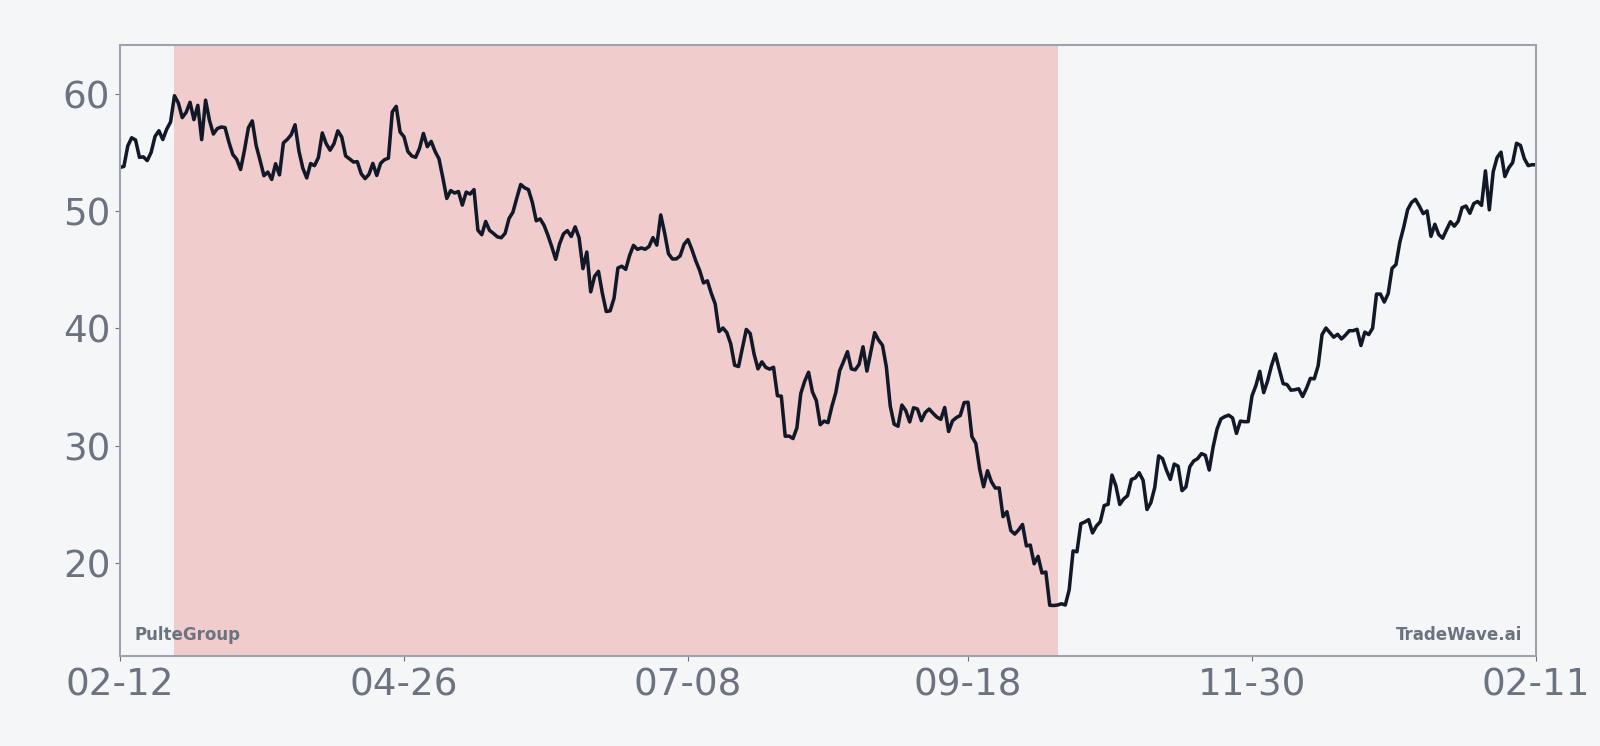
A combined view of net returns with peak favorable and adverse moves illustrates how deeply PulteGroup has swung within this window before settling at its final outcome.
History does not guarantee future results, and maximum adverse excursions can be large even in windows that have been profitable in the past.
Taken together, the historical pattern defines the quantitative seasonal backdrop for the current period as PulteGroup moves toward a midterm-year window that has repeatedly aligned with weaker price action over the past four decades.
Price and near-term drivers
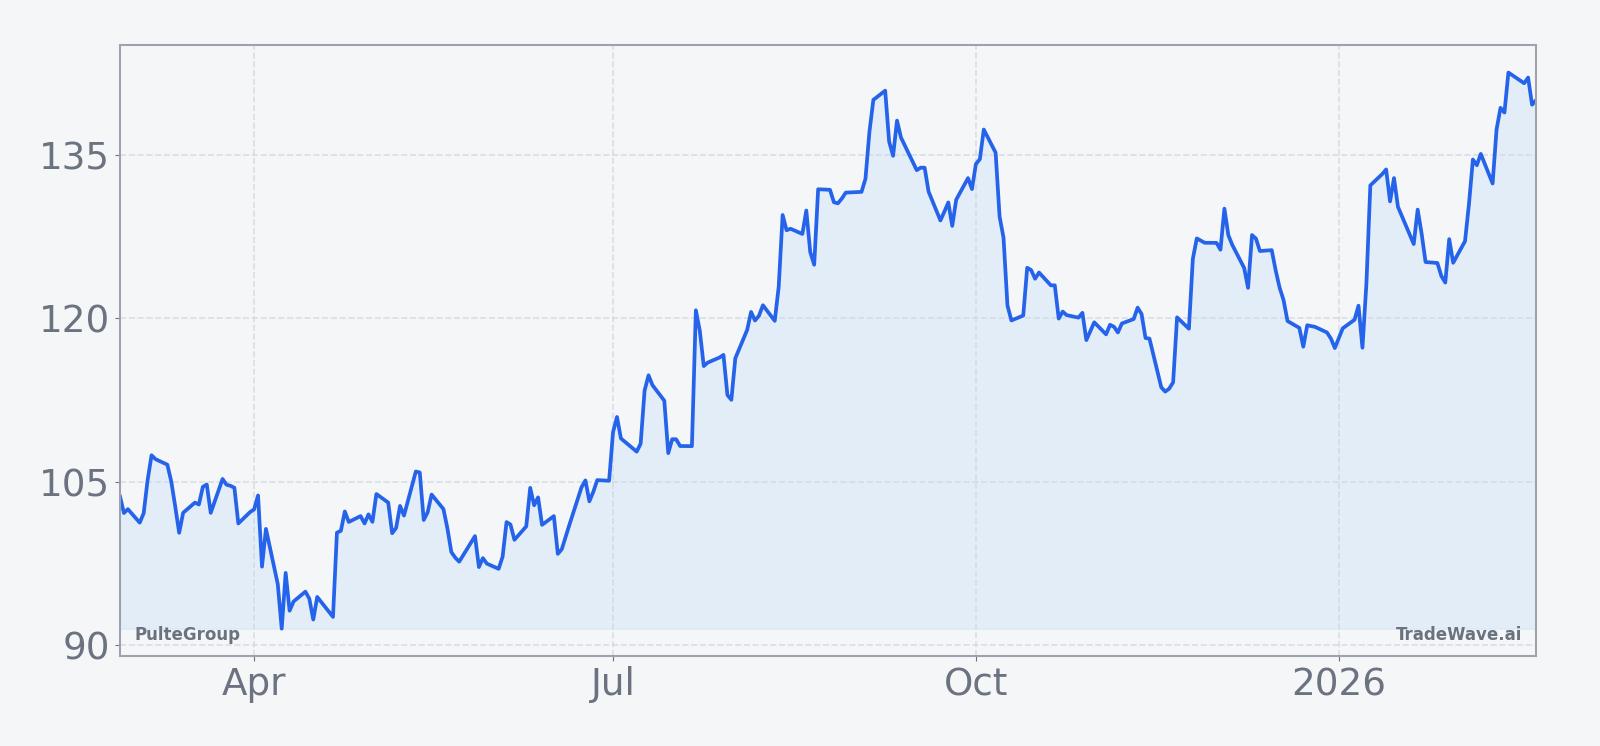
PulteGroup closed at 140.02 on Feb 21, edging 0.3% higher on the day in relatively steady trading, with the stock lacking a clearly defined 52-week high or low in the available data but sitting near the upper end of its recent range.[2] That price action follows a stretch in which the homebuilder has traded through mixed fundamental news, including a fourth-quarter earnings report on Jan 29 that showed profit declining as weaker consumer sentiment weighed on homebuying demand.[2]
In that Jan 29 report, PulteGroup’s home sale gross margin for the quarter was 24.7%, down from 27.5% in the same period a year earlier, while closings slipped 3% to 7,821 homes.[2] The company did not provide specific forward guidance in the sources available, leaving investors to infer the trajectory of demand from commentary around consumer confidence and the broader housing backdrop. The combination of softer margins and slightly lower closings has kept attention on how quickly buyers might return if sentiment stabilizes or mortgage conditions improve.
The current setup also follows a different tone from mid-2025, when PulteGroup and peers rallied after a surprise earnings beat. In July 2025, Barron’s reported that PulteGroup shares jumped alongside D.R. Horton after stronger-than-expected results, highlighting how quickly sentiment toward homebuilders can swing when earnings surprise to the upside.[1] That earlier episode underscores the sensitivity of the group to quarterly data and suggests that upcoming reports during the seasonal window could either reinforce or counteract the historical pattern depending on how demand evolves.
Macro conditions remain a key part of the story. The Wall Street Journal has noted that weak consumer sentiment and lagging confidence are weighing on homebuyer demand, even as lower interest rates and better pricing dynamics offer some support.[2] For PulteGroup, that means the tug-of-war between affordability improvements and buyer caution is likely to remain central as the stock enters a period that has historically been associated with downside pressure in midterm election years.
The chart below situates the latest move in its recent multi-month context.
Macro and election-cycle backdrop
The upcoming window takes place as markets move deeper into the midterm election year, a phase that often brings renewed debate over fiscal priorities, housing policy and regulatory oversight. For homebuilders, shifts in expectations around infrastructure spending, zoning rules or tax incentives can influence land development plans and buyer behavior, even before any legislation is finalized. That policy uncertainty can interact with the seasonal tendency identified in the data, potentially amplifying volatility if investors reassess the sector’s earnings power.
At the same time, the 228-day span runs into the following pre-election year, which has historically been associated with a more supportive risk backdrop in many asset classes as policymakers seek to stabilize growth ahead of the presidential race. For PulteGroup, that transition from midterm-year uncertainty to pre-election positioning could shape how the latter part of the window behaves relative to its early months, especially if consumer confidence and housing affordability show signs of improvement.
What to watch as the window unfolds
As PulteGroup approaches this historically weak seasonal window, investors will be watching several concrete markers. First, upcoming earnings reports and any updated commentary on order trends, cancellation rates and pricing power will be critical for gauging whether the fundamental backdrop is deteriorating in a way that aligns with the historical midterm-year pattern or instead offsets it with stronger-than-expected demand.[2]
Second, the behavior of the stock around key technical levels during the window will matter. A sustained break lower from the recent range would be more consistent with the historical short-oriented pattern, while a decisive move higher that holds through typical intraperiod drawdown zones would represent a departure from prior midterm-year behavior. Given the large maximum adverse excursions seen in some historical windows, traders may pay particular attention to how deep any countertrend rallies run before momentum shifts.
Third, the policy calendar bears close monitoring. Developments around housing-related legislation, infrastructure initiatives or changes in mortgage-market support could influence sentiment toward homebuilders and either reinforce or blunt the seasonal tendency. Because the window bridges the midterm election year and the start of the pre-election year, any shift from policy uncertainty toward clearer fiscal or regulatory direction could mark an inflection point for the stock.
Finally, the broader macro backdrop for consumer confidence and mortgage affordability will remain central. If surveys and spending data show confidence stabilizing or improving, and if lower rates translate into better affordability, that could provide a counterweight to the historical pattern by supporting demand for new homes.[2] Conversely, a renewed slide in sentiment or a stall in housing activity would be more in line with the past midterm-year windows in which PulteGroup has tended to weaken over this 228-day span.