Venezuela Policy Turn Could Unlock More Barrels for Chevron (CVX) as U.S. Steps In
Chevron has entered an 84-day midterm-year stretch that has historically delivered solid gains, as shares hover near recent highs and investors weigh record output against shifting Venezuela policy and energy demand.

Key takeaways
- Chevron has just begun an 84-day seasonal window tied to the last 12 midterm election years, during which the stock has historically trended higher.
- The pattern has been long-directed with a 100% win rate across 12 historical instances, with 12 winners and 0 losers and an average profit of 11.04%.
- Intraperiod swings have featured meaningful upside, with several years showing double-digit maximum favorable moves, but adverse excursions have at times reached mid-single digits.
- The seasonal window overlaps a period when policy and regulation around global supply, including Venezuela, have often been in focus for Chevron’s fundamentals.[4][9]
- Today’s move leaves CVX trading around $182.64 after a 1.16% gain, keeping the stock near the upper end of its 12‑month range as investors digest record production and updated cash flow guidance.[4]
According to historical data from TradeWave.ai, this part of the calendar has shown a distinct pattern for Chevron in past midterm election years, and the next several weeks sit inside that regime rather than a typical trading range.
Seasonal window
This seasonal window is currently underway, spanning 84 days, and has historically been a strong stretch for Chevron in the last 12 midterm election years. Today the stock closed at $182.6405, up 1.16% on the session, leaving it trading near the upper end of its recent range even as broader energy markets remain sensitive to policy and demand headlines.[4]
Grouping results by the presidential election cycle matters here because midterm years often feature shifting policy priorities, regulatory reviews and budget debates that can alter the outlook for large energy producers more than in quieter parts of the cycle. For a company like Chevron, whose fortunes are closely tied to capital spending, global supply access and environmental rules, those mid-cycle adjustments can line up with recurring patterns in investor positioning and price behavior.
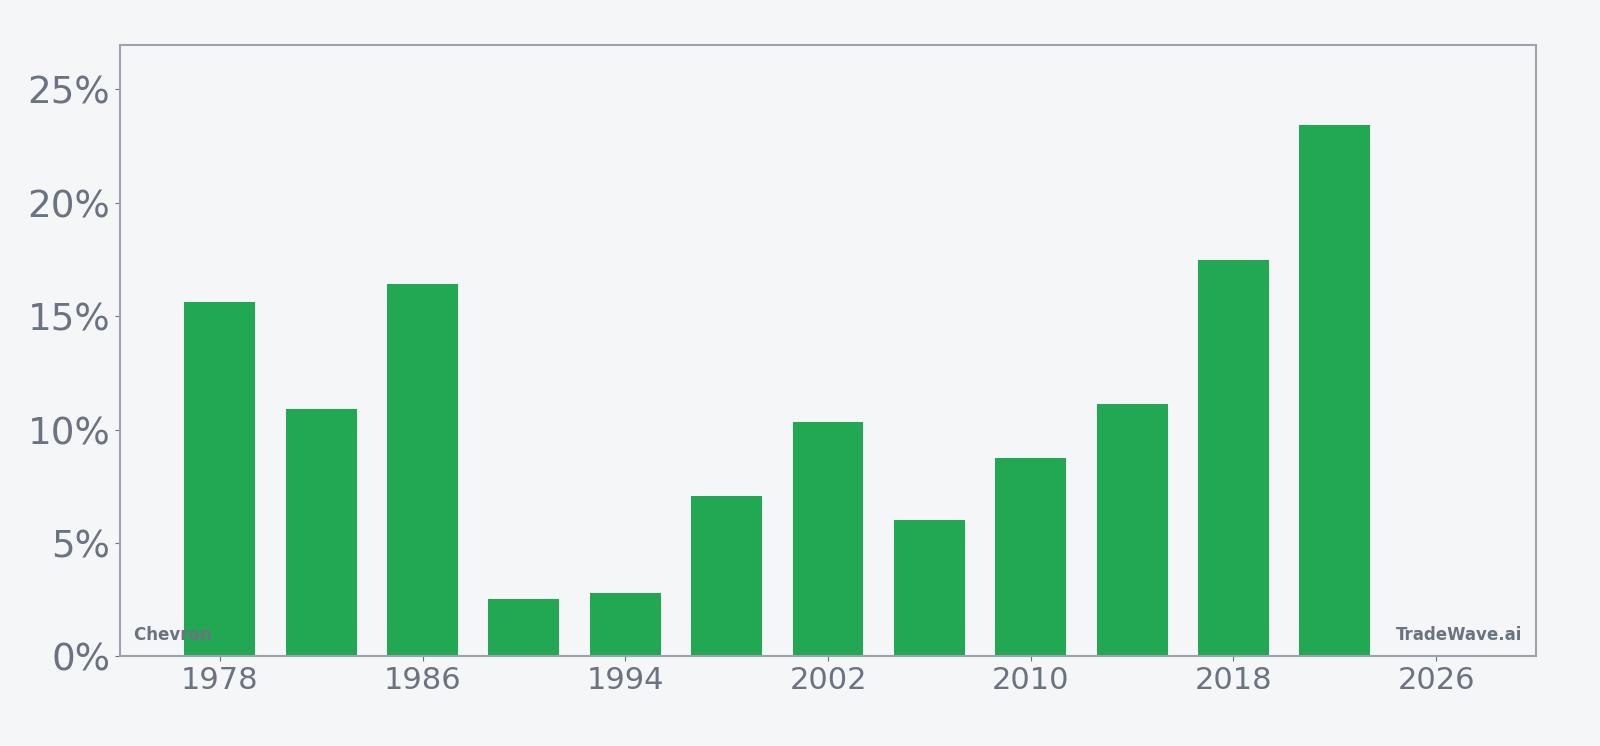
Across the last 12 midterm election years, the pattern has been consistently positive for a long bias, with 12 winners and 0 losers and a Percent Profitable reading of 100%. The average profit across all years is 11.04%, with a median outcome of 10.64%, which points to a relatively tight cluster of double-digit gains rather than a profile dominated by a single outlier year.
The per-year breakdown shows that some of the strongest instances came in 2018 and 2022, when Chevron logged net returns of 17.49% and 23.45% respectively during this window, while the softest outcomes, such as 1990 and 1994, still finished modestly positive at 2.53% and 2.79%. In other words, even the weaker midterm-year versions of this pattern have historically preserved the long-direction bias, though with much smaller payoffs.
Intraperiod swings have been meaningful. Maximum favorable moves have ranged from mid-single digits to more than 30%, with 2022 standing out for a 30.98% peak run-up during the window before settling at a 23.45% gain. On the downside, the worst drawdowns from entry have at times been notable, with years like 1990 and 2006 seeing adverse excursions of -8.12% and -7.15% respectively, underscoring that even historically successful windows have included uncomfortable pullbacks along the way.
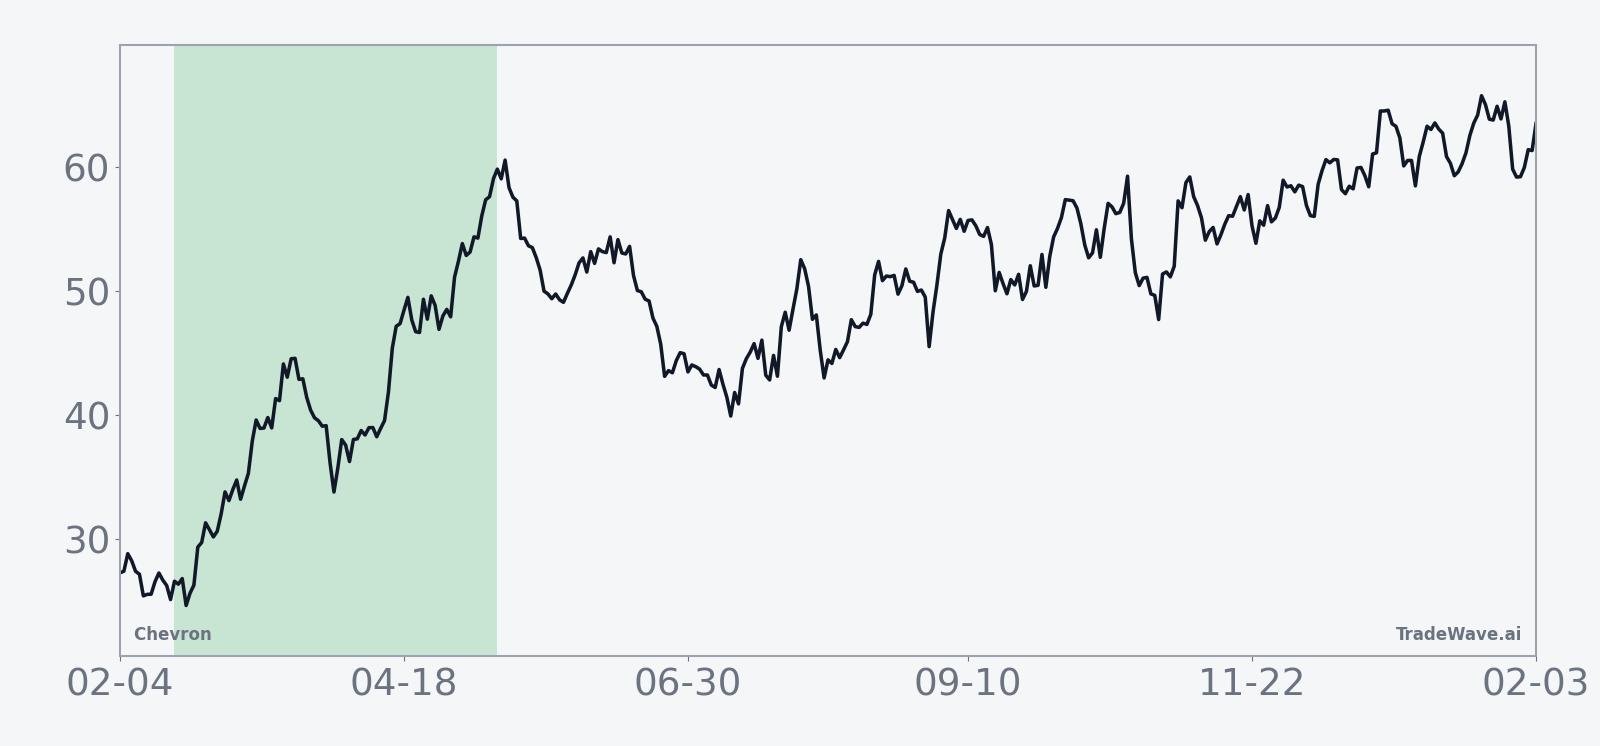
The historical seasonal trend line suggests that gains have tended to build relatively steadily through the window rather than arriving in a single burst, with a bias toward stronger performance in the middle portion of the period. That profile is consistent with a market that gradually prices in evolving policy and macro information rather than reacting to a single binary event.
A combined view of net returns alongside peak run-ups and worst drawdowns helps clarify how upside and downside have coexisted in this window.
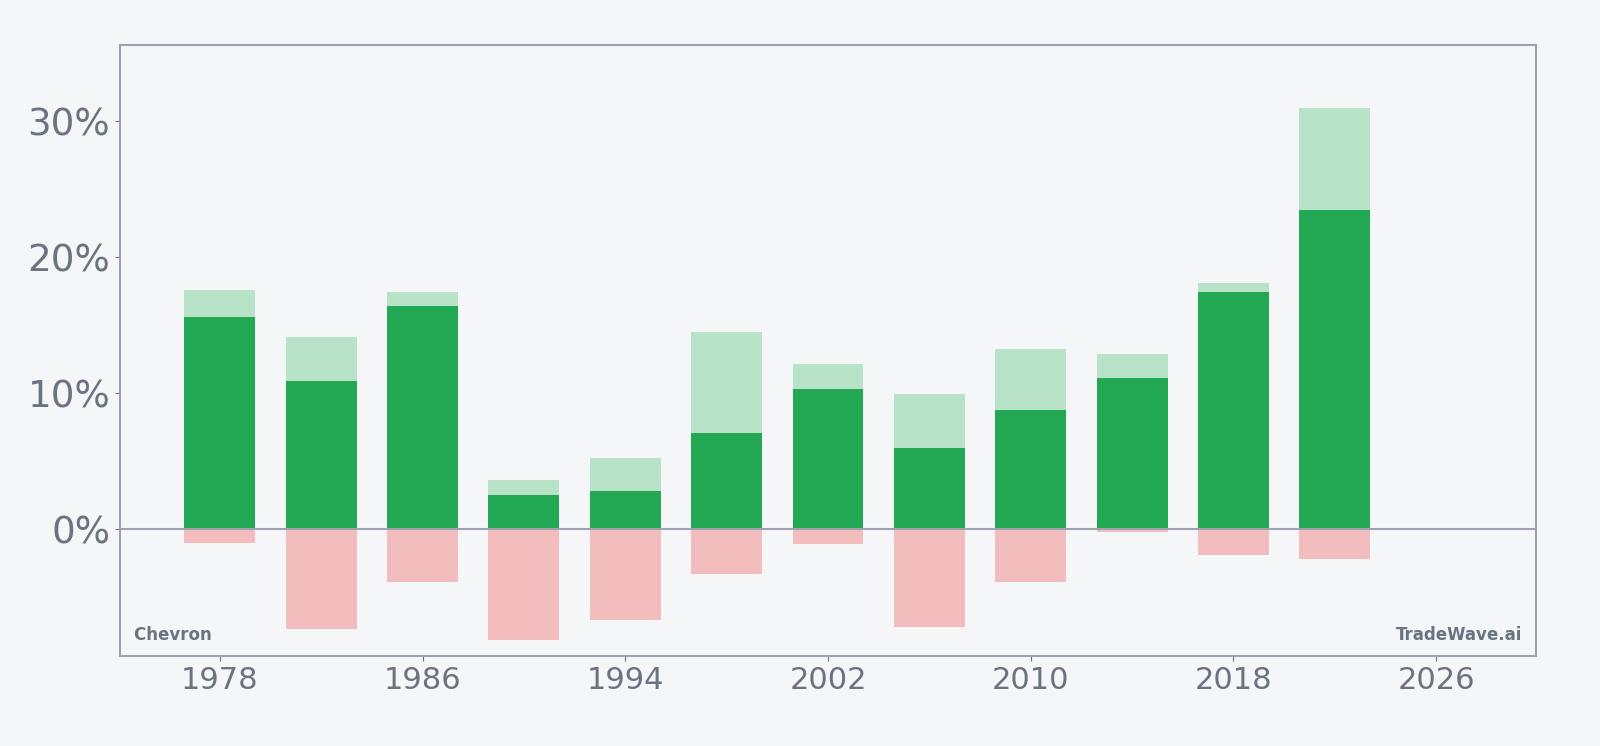
The stacked bars showing net results alongside maximum favorable and adverse excursions highlight a pattern where upside potential has often exceeded downside risk, but where mid-single-digit drawdowns have been common even in years that ultimately finished strongly higher. Taken together, the historical pattern defines the quantitative seasonal backdrop for the current period.
History does not guarantee future results, and adverse excursions can be large even in winning windows.
Price and near-term drivers
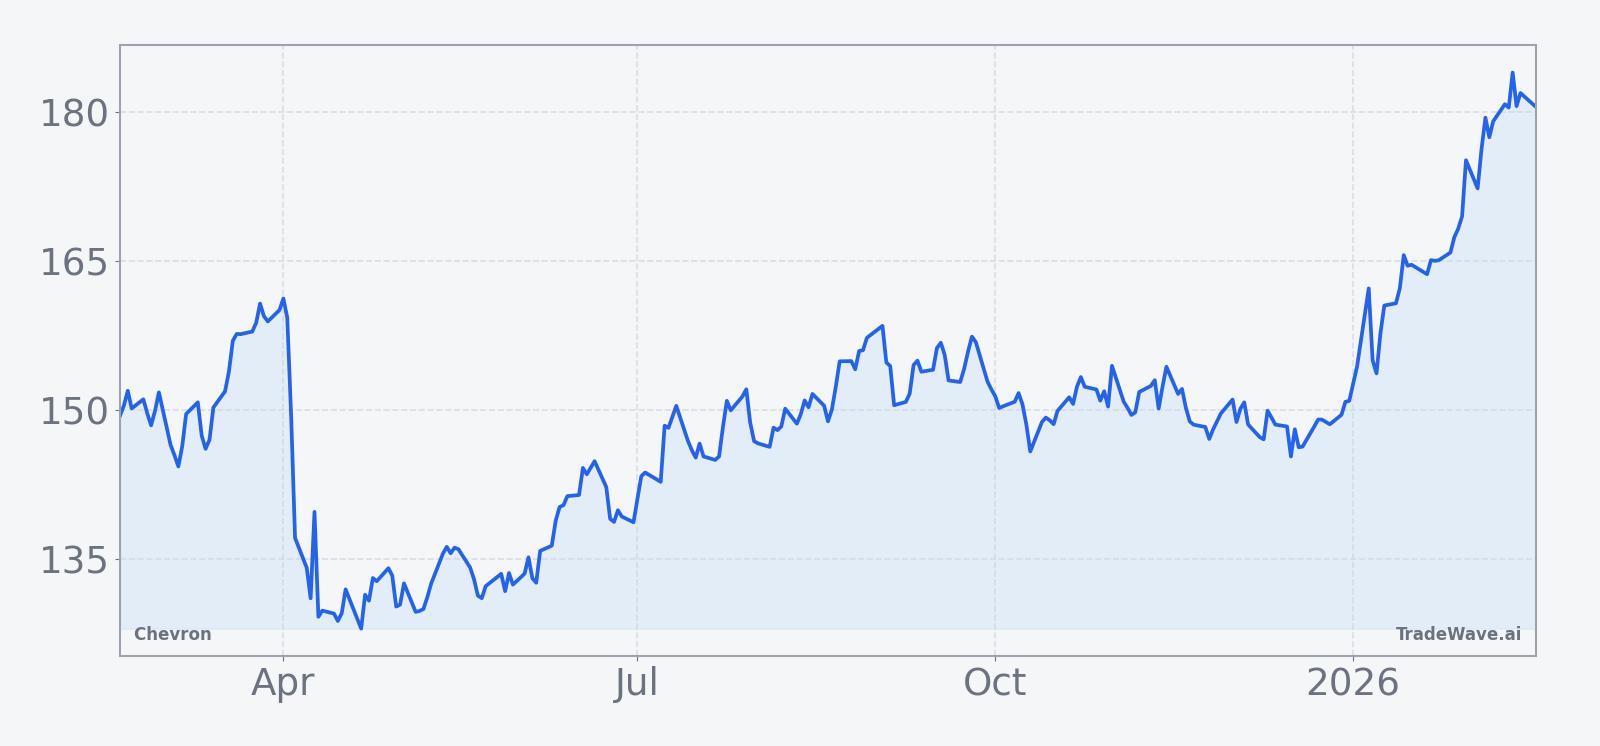
Chevron shares finished Wednesday at $182.6405, up 1.16% on the day, extending a climb that has left the stock near the top of its 12‑month range as investors digest a run of strong operational updates and shifting geopolitical headlines.[4] The latest leg higher follows a fourth-quarter report on Jan 30 in which Chevron delivered adjusted earnings per share of $1.52 versus expectations of $1.45 and reported record production of 4.05 million barrels of oil equivalent per day, even as revenue came in slightly below forecasts at $46.87 billion.[4]
That earnings beat capped a 2025 in which Chevron consistently met or exceeded profit expectations, with Q2 adjusted earnings of $3.1 billion topping estimates and Q1 results matching Wall Street forecasts as refining margins recovered from earlier weakness.[2][5] Alongside the results, management raised 2026 free cash flow guidance to $12.5 billion and signaled plans for $11.5 billion to $13 billion in share repurchases for 2025, reinforcing a capital-return story that has been central to the stock’s appeal.[4]
Macro and policy developments have added another layer. In early January, The Wall Street Journal highlighted that U.S. intervention and the ouster of Venezuelan leader Nicolás Maduro could open the door for Chevron to expand production in the country, potentially easing some restrictions that had constrained output and cash flows from the region.[9] CNBC reporting around the same time underscored that investors see upside from Venezuela as part of a broader narrative in which Chevron is positioned as a key U.S. major with room to grow volumes while maintaining discipline on spending.[4]
Those opportunities sit against a more complex regulatory backdrop. In March 2025, Seeking Alpha relayed Bloomberg reporting that Chevron had paid hundreds of millions of dollars to Venezuela under a secret arrangement with the Biden administration, despite a license that formally prohibited such payments, highlighting the degree to which policy risk and diplomatic shifts can influence the company’s operating environment.[1] For traders watching the current seasonal window, that mix of strong fundamentals and policy sensitivity helps explain why midterm election years, with their focus on budgets and foreign policy, can be particularly active periods for the stock.
On the sentiment side, Seeking Alpha’s analyst survey in January described Chevron as one of the more attractive oil stocks, with a consensus rating of Buy, reflecting confidence in the company’s balance sheet, dividend and leverage to any sustained upturn in crude prices.[11] Short interest has remained relatively contained, with one report citing a 3.57% short-interest level, suggesting that while there is some skepticism, the stock is not heavily targeted by bearish positioning.[1]
The chart below situates the latest move in its recent multi-month context.
Macro and political backdrop
The broader macro environment remains a key variable for Chevron as the seasonal window unfolds. Energy markets are balancing concerns about global growth with ongoing supply discipline from OPEC+ and U.S. shale producers, while investors watch central bank policy for clues on the path of interest rates and the dollar, both of which can influence commodity prices and capital flows into the sector.
Within that context, Venezuela has emerged as a focal point. The Wall Street Journal’s early January roundup noted that political change in Caracas could allow Chevron to boost production, potentially adding barrels to the global market at a time when supply from other regions faces constraints.[9] Any acceleration in Venezuelan output would likely be gradual and subject to regulatory approvals, but it underscores how midterm-year policy shifts can intersect with corporate strategy in ways that matter for both earnings and investor sentiment.
At the same time, Chevron’s role as a major U.S. integrated oil company means it is sensitive to domestic regulatory debates around emissions, drilling permits and pipeline infrastructure. While those issues are not unique to midterm election years, the legislative calendar and committee oversight typical of this phase can bring them to the forefront, potentially contributing to the kind of intraperiod volatility that the historical seasonal data captures.
What to watch as this window unfolds
For the remainder of this 84-day midterm-year window, traders and longer-term investors alike will be watching how Chevron trades around several key themes. First, the stock’s ability to hold recent gains near the upper end of its 12‑month range will be an important gauge of whether the historical pattern of steady, double-digit advances can reassert itself or whether macro headwinds interrupt the trend.[4]
Second, developments around Venezuela and broader supply policy will be closely monitored. Any concrete steps that expand Chevron’s operating flexibility in the country, or conversely any setbacks on the diplomatic front, could influence how closely this year’s path tracks the historical midterm-year template that has often been shaped by policy news.[4][9]
Third, the earnings and cash-flow narrative will remain central. Follow-through on the company’s raised 2026 free cash flow guidance, the pace of share repurchases within the $11.5 billion to $13 billion range, and any updates on capital spending plans will help determine whether investors continue to reward the stock with a premium multiple during a seasonally strong stretch.[4]
Finally, positioning and sentiment indicators such as short interest and analyst commentary will be worth tracking. A meaningful shift in short interest away from the roughly 3.57% level cited in prior reporting, or a change in the consensus Buy stance among analysts, would signal that the balance of opinion is moving, which could either reinforce or counteract the historical seasonal tendency depending on the direction of that shift.[1][11]
Taken together, the seasonal backdrop, policy calendar and company-specific catalysts frame an 84-day period in which Chevron’s price action has historically been constructive but not without volatility, giving investors a structured lens through which to interpret each new headline.
Sources
- Seeking Alpha: Chevron paid hundreds of millions to Venezuela in secret deal with Biden - Bloomberg (Mar 23, 2025)
- Reuters: Chevron beats Wall Street profit estimates with record output (Aug 1, 2025)
- CNBC: Chevron earnings beat as production hits record with upside expected in Venezuela (Jan 30, 2026)
- Reuters: Chevron meets Wall Street profit estimates as refining recovers from previous quarter (May 2, 2025)
- The Wall Street Journal: Energy & Utilities Roundup: Market Talk (Jan 5, 2026)
- Seeking Alpha: SA Asks: What are the most attractive oil stocks right now? (Jan 11, 2026)