Heavier Selling as Investors Reassess Midterm Election Risk for Automatic Data Processing (ADP)
Automatic Data Processing is moving through a historically strong 21-day midterm-election-year window as shares pull back from recent highs and investors weigh policy and rate uncertainty.

Key takeaways
- Automatic Data Processing is in a 21-day seasonal window that has historically been strong for the stock during midterm election years, with a long trade direction.
- The pattern covers the last 10 midterm election years and has produced winning outcomes in all 10 instances, with 100% Percent Profitable, 10 winners and 0 losers.
- Average profit across those years is 3.37%, with a cumulative gain of 39% and a Sharpe ratio of 3.5, indicating a historically favorable risk-adjusted profile.
- The TradeWave Ratio of 3.44 suggests that price has typically traveled meaningfully in the trade direction within the window, even though intraperiod swings can be sizable.
- Maximum favorable and adverse moves in individual years show that upside has often developed early in the window, while occasional drawdowns have tested investors’ tolerance before recovering.
- With ADP recently sliding 2.7% in a single session, the interaction between this pullback and the historically strong window will be closely watched by systematic and discretionary traders alike.
According to historical data from TradeWave.ai, this part of the calendar has shown a distinct pattern for Automatic Data Processing in past midterm election years, and that backdrop is now in focus as the stock trades through the current window.
Seasonal window
This seasonal window is currently underway, spanning 21 days, and has historically been a strong stretch for Automatic Data Processing in midterm election years. ADP last closed at $211.67 after a 2.7% decline in the latest session, leaving the stock consolidating below its recent highs as investors reassess valuations and macro risk.
Grouping the data by the presidential election cycle matters here because midterm election years often feature shifting expectations around fiscal policy, regulation and interest rates, which can affect payroll and HR outsourcers like Automatic Data Processing differently than in quieter parts of the cycle. This window is drawn from the last 10 midterm election years, so it reflects how ADP has behaved in comparable policy and liquidity backdrops rather than across all calendar years.
Across those 10 midterm election years, the pattern has a long trade direction, with 100% Percent Profitable, 10 winners and 0 losers. Average profit for the window is 3.37%, and the cumulative return across all 10 instances is 39%, which aligns with a Sharpe ratio of 3.5 that points to relatively consistent outcomes for this specific stretch of the calendar.
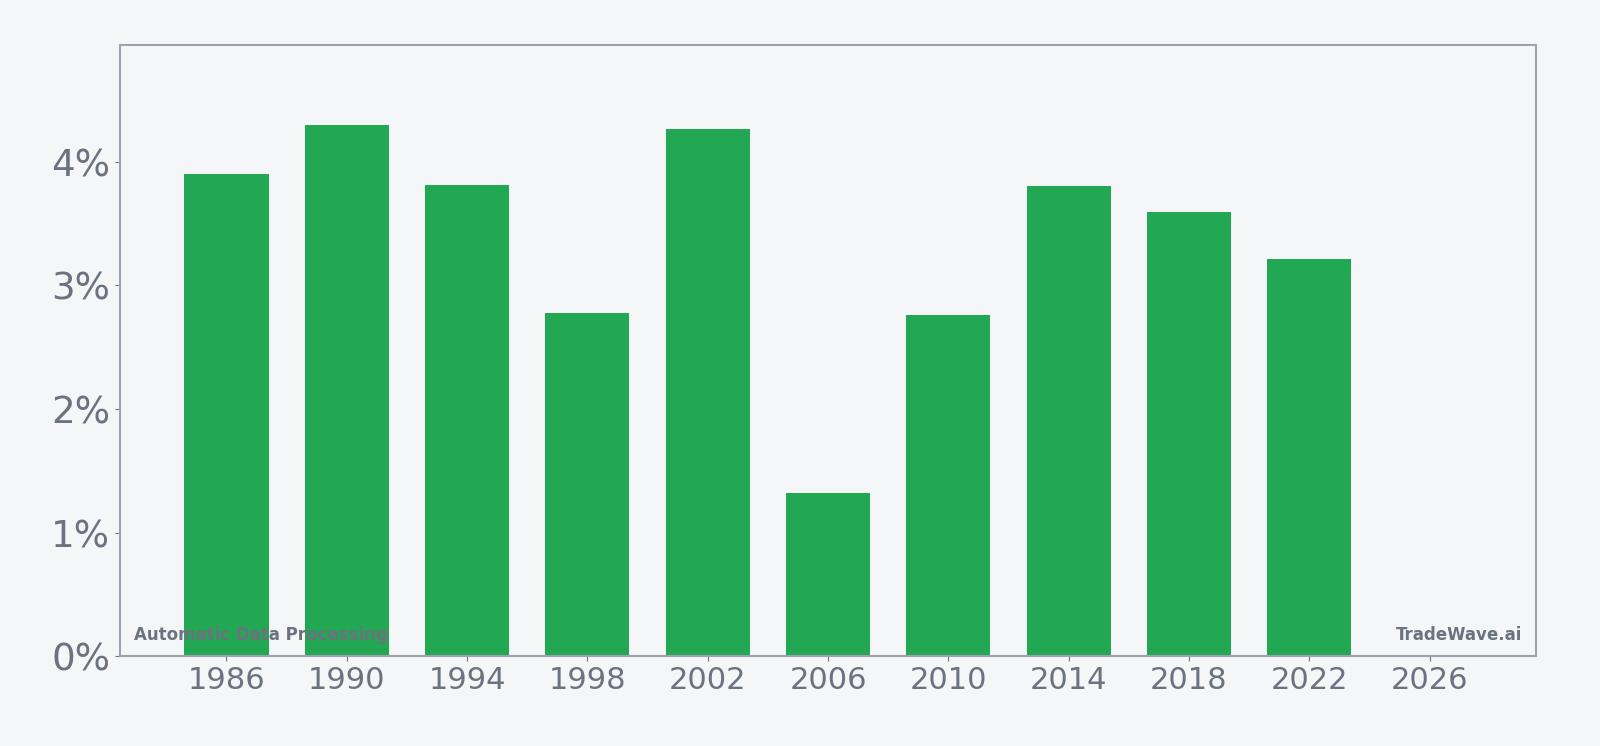
The per-year table shows that individual net returns have ranged from a modest 1.32% gain in 2006 to stronger advances such as 4.3% in 1990 and 4.26% in 2002. In 2018, the stock gained 3.59% over the window, while in 2022 it rose 3.21%, suggesting that the pattern has persisted into more recent cycles as well.
Intraperiod swings have been meaningful even in winning years. Maximum favorable moves have reached as high as 6.74% in 2018 and 5.57% in 1990, highlighting the potential for upside bursts within the 21-day span. At the same time, maximum adverse moves have occasionally been deep, including intraperiod drawdowns of -4.81% in 2022 and -4.35% in 2002, underscoring that the path to a positive close has not always been smooth.
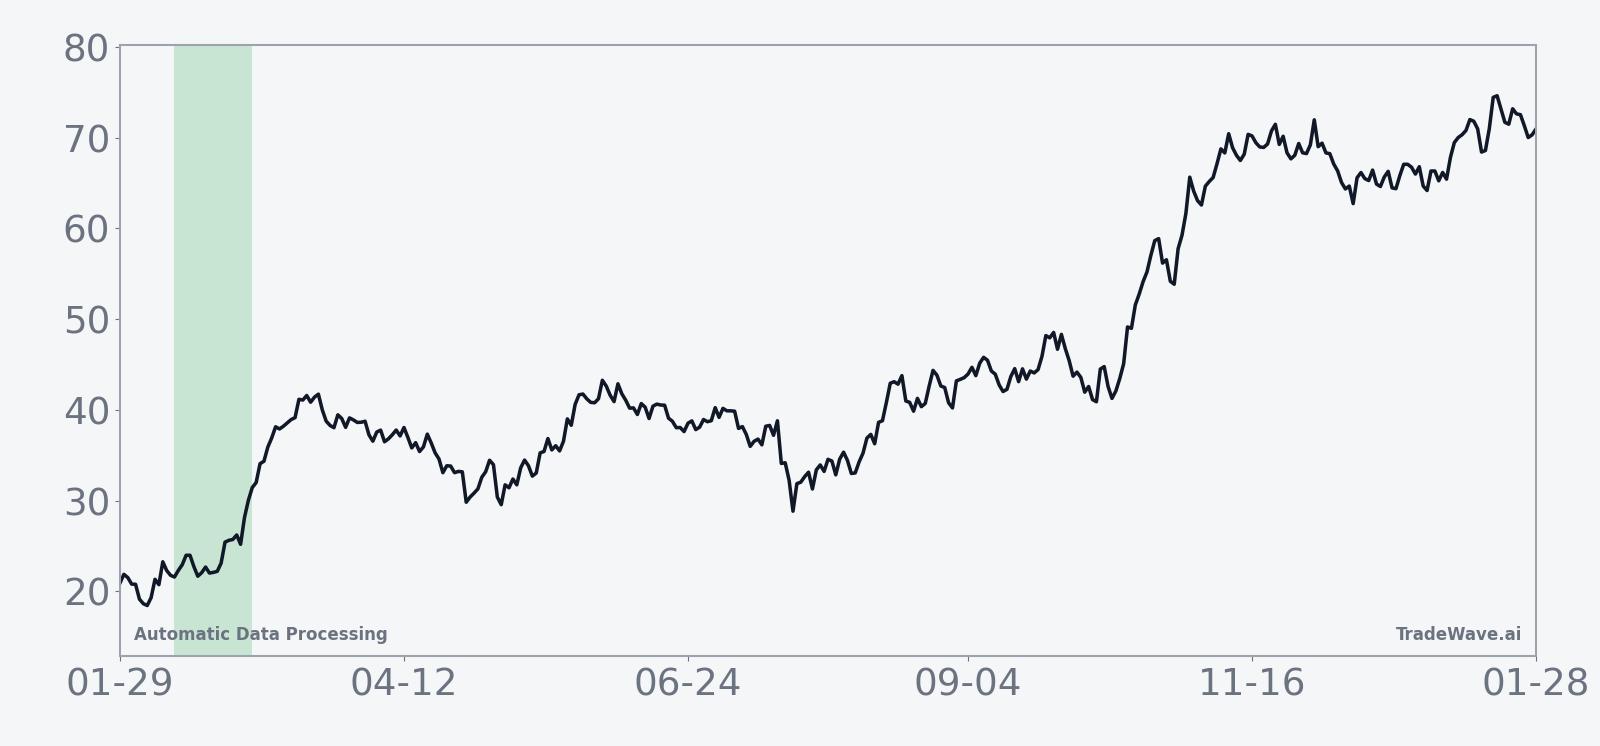
The historical seasonal trend chart for this window suggests that gains have tended to build gradually rather than in a single spike, with a bias toward strength emerging as the window progresses. That pattern is consistent with the idea that investors often recalibrate midterm-year risk early in the year, then lean back into quality large caps like ADP as policy signals and earnings visibility improve.
A combined view of net returns with peak favorable and worst adverse moves helps frame both upside potential and typical drawdown risk.

The combined net, maximum favorable and maximum adverse excursions show that while every historical instance has finished higher, several years experienced notable downside before recovering, and the strongest years often saw early rallies that extended through the window. Taken together, the historical pattern defines the quantitative seasonal backdrop for the current period.
History does not guarantee future results, and adverse excursions can be large even in winning windows, so traders typically treat this pattern as context rather than a standalone signal.
Price and near-term drivers
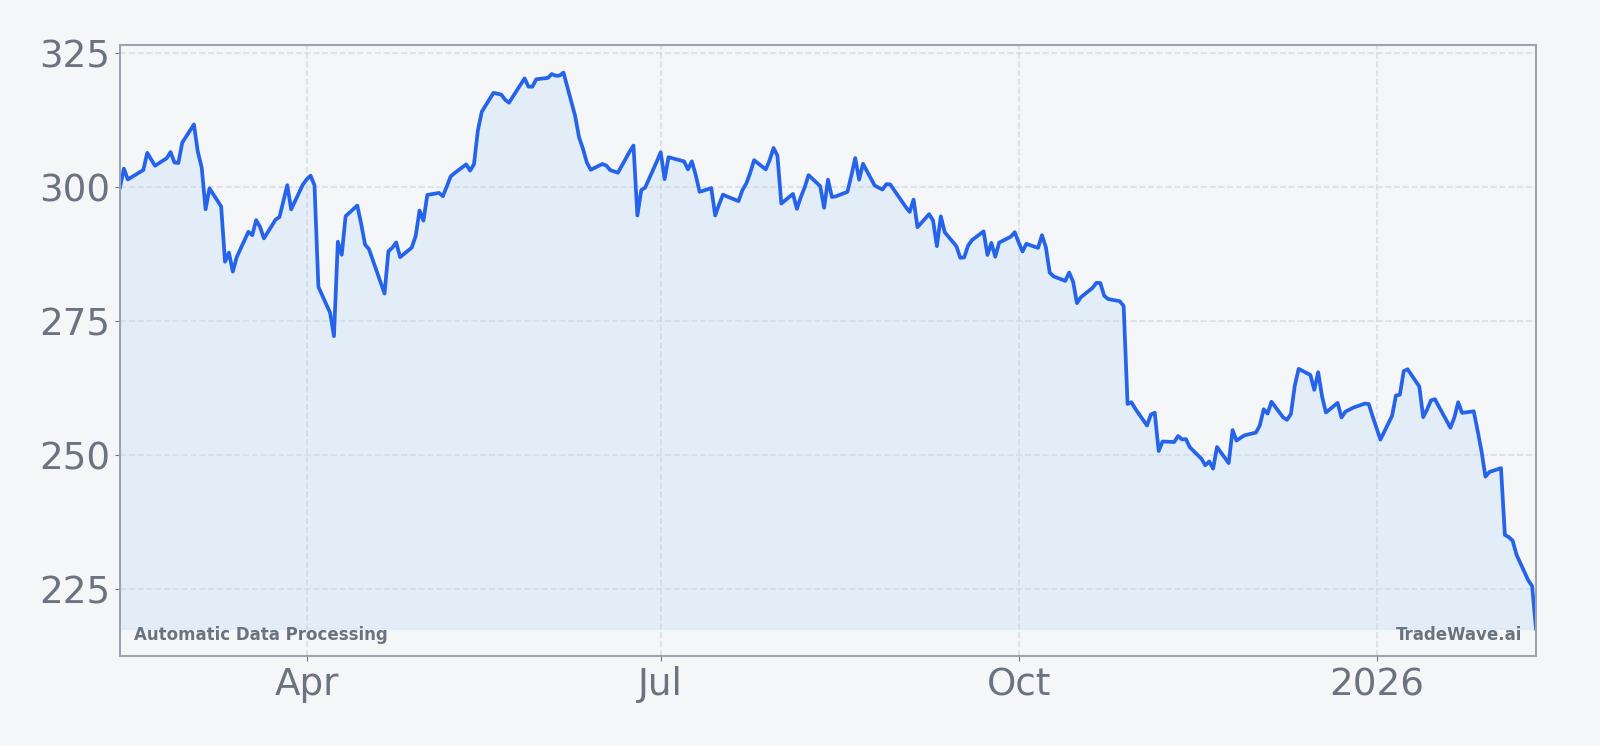
Automatic Data Processing last closed at $211.67, down 2.7% on the day, as the stock pulled back from recent highs in heavier trading and investors weighed the outlook for corporate hiring and wage growth against a backdrop of lingering rate uncertainty.
The chart below situates the latest move in its recent multi-month context.
Macro and election-cycle backdrop
The current year marks the midterm election year in the U.S. presidential cycle, a phase that often brings shifting expectations around fiscal priorities, regulatory focus and the path of interest rates. For a payroll and HR services provider like Automatic Data Processing, those forces can influence client hiring plans, wage dynamics and demand for outsourced services, which in turn shape revenue visibility and margin expectations.
Historically, midterm election years have displayed a two-part structure in broader markets, with choppier conditions early in the year followed by a tendency toward stronger performance as policy uncertainty clears and investors look ahead to the pre-election year. The 21-day window beginning Feb 12 sits in the early part of that midterm year, so the strong historical pattern for ADP in this stretch suggests that the stock has often been treated as a relative safe harbor or quality growth exposure as investors navigate the first wave of policy and macro headlines.
Looking ahead, the transition from the midterm election year into the year before the presidential election has often coincided with a more constructive tone for risk assets, particularly for companies with durable cash flows and recurring revenue. If that broader pattern holds, the current seasonal window for ADP could be part of a larger shift in how investors position around policy risk and corporate spending plans, although the usual caveats about historical tendencies apply.
What to watch
For this 21-day window, traders will be watching whether Automatic Data Processing can stabilize above recent support levels and begin to rebuild momentum consistent with its historical midterm-year pattern. A move that sees early volatility followed by a grind higher would align with the average seasonal trend, while a sustained break lower through the window would mark a clear departure from the last 10 cycles.
Macro-wise, upcoming data on employment, wage growth and business sentiment will be important for gauging how corporate clients might adjust hiring and payroll budgets, which are key drivers for ADP’s volumes. Any shifts in expectations for central bank policy or fiscal priorities as the midterm year unfolds could also influence how investors value steady cash-flow generators relative to higher-beta growth names.
From a levels perspective, traders are likely to focus on how the stock behaves around its recent pullback lows and prior resistance near the recent highs, using those zones to judge whether dip-buying demand is consistent with the historically strong seasonal window. Persistent weakness or unusually deep intraperiod drawdowns during this stretch would signal that other forces are overpowering the seasonal tendency, while a pattern of higher lows and improving momentum would be more in line with the long-biased historical profile.