W. R. Berkley Corporation (WRB) Rides Demand for Tariff-Insulated Earnings, Forbes Rates Buy
W. R. Berkley Corporation is easing in early February trading even as it moves through an 88-day midterm-election-year window that has historically aligned with steady double-digit gains for the insurer’s stock.

Key takeaways
- W. R. Berkley Corporation is in an 88-day seasonal window that began Feb 8 and has historically been a strong stretch for the stock in midterm election years.
- The pattern is long-directed, with a 100% Percent Profitable record across 10 winning years and 0 losing years in this election-cycle grouping.
- Average profit across those winning years is 12.25%, with a cumulative return of 216% and a Sharpe ratio of 3.88, indicating historically strong risk-adjusted outcomes.
- Intraperiod swings have been meaningful, with years such as 2006 and 1986 showing large peak run-ups alongside notable temporary drawdowns.
- WRB shares last closed at 69.13, down 1.8% on the day, giving investors a fresh entry point as the seasonal window progresses.
- Investors should treat the pattern as context rather than a forecast, since adverse moves have still occurred within otherwise profitable years.
According to historical data from TradeWave.ai, this part of the calendar has shown a distinct seasonal tendency for W. R. Berkley during past midterm election years, providing a quantitative backdrop for today’s price action.
Seasonal window
This seasonal window is currently underway, spanning 88 days from Feb 8, 2026, and has historically been a strong stretch for W. R. Berkley Corporation in the last 10 midterm election years. WRB last closed at 69.13, down 1.8% in the latest session, leaving the stock trading modestly below recent highs without clear 52-week reference points in the available data.
Grouping the data by the presidential election cycle means this pattern reflects how WRB has behaved in the early part of midterm election years, a phase that often coincides with shifting expectations for regulation, capital requirements and catastrophe exposure across the insurance industry. Instead of averaging across every calendar year, the analysis isolates the last 10 midterm election years, which can matter for a regulated financial stock whose fortunes are tied to policy and macro risk appetite.
The trade direction for this pattern is long, and historically every one of the 10 midterm-year windows in the sample finished with a gain. Percent Profitable stands at 100%, with 10 winners and 0 losers, and the average profit across those winning years is 12.25%, compared with a cumulative return of 216% over the full history of the pattern. The median profit of 11.63% and a Sharpe ratio of 3.88 underline that the gains have not only been positive but also relatively consistent on a risk-adjusted basis.
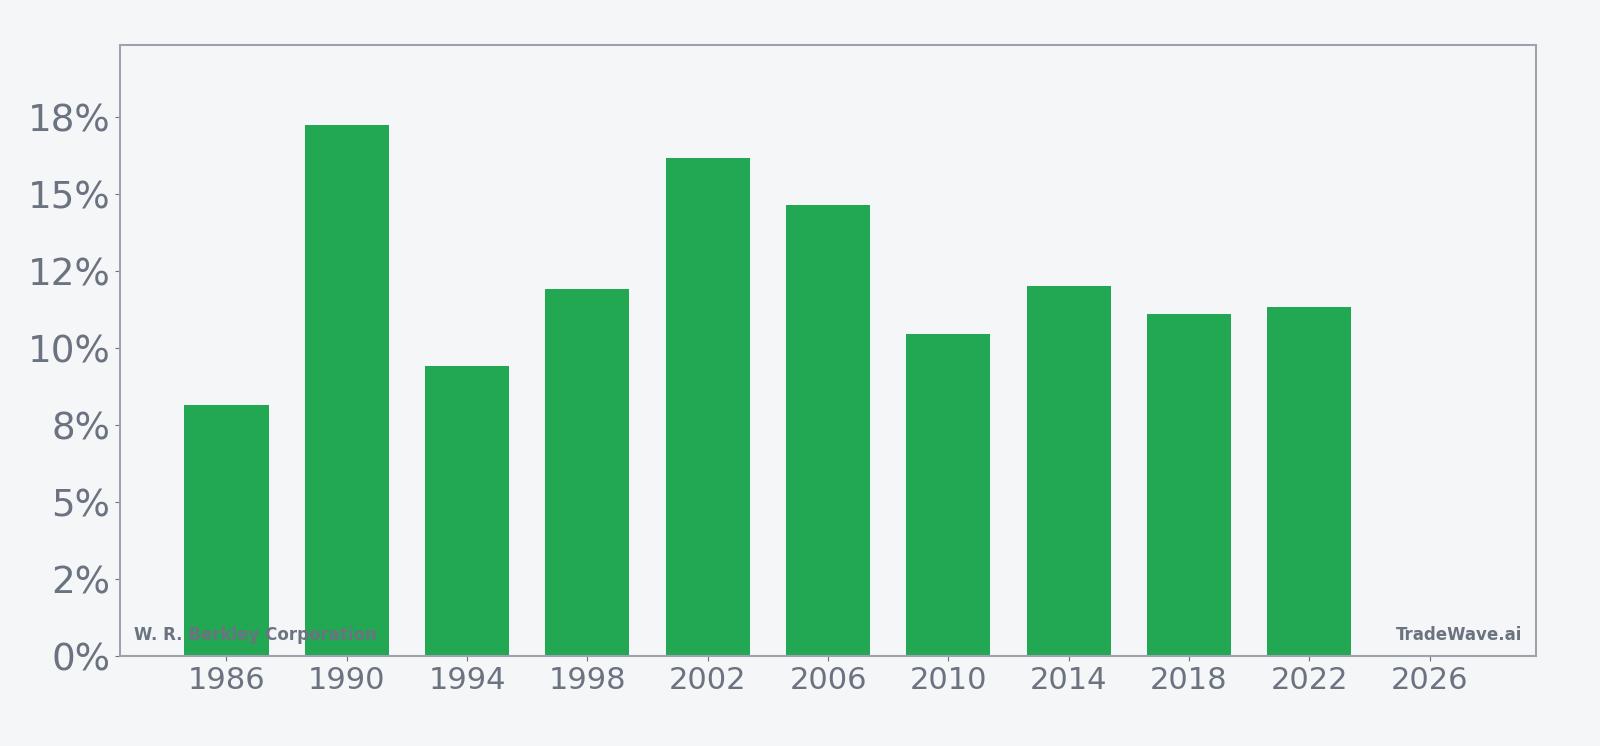
Looking at individual years, the strongest net return in the sample came in 1990, when WRB gained 17.25% over the window, while 1986 sits at the lower end of the range with an 8.17% advance. In 2006 the stock rose 14.64% during the window, but the maximum favorable move within that period reached 27.57%, illustrating how intraperiod rallies can overshoot the final close before consolidating. Even in 2022, a challenging year for markets more broadly, WRB logged an 11.34% gain in this window, with a peak run-up of 15.79% before giving back some ground.
Intraperiod risk has still been present. In 1986 the worst drawdown from entry during the window reached an adverse move of 7.85%, and in 2022 the maximum adverse excursion was similar at 7.94%, even though both years ultimately finished higher. By contrast, several years such as 2002 and 2014 saw relatively shallow worst-case pullbacks of less than 1% while still delivering double-digit gains, highlighting that the downside profile has varied from cycle to cycle.

The historical seasonal trend chart suggests that gains in this window have tended to build steadily rather than arriving in a single burst, with the average path showing a gradual climb as the days progress. There are periods of consolidation along the way, but the overall slope of the line is upward, consistent with the long-directed bias and the high share of winning years.
Year-by-year bars that combine net results with peak rallies and worst drawdowns help clarify how much WRB has typically moved inside the window before settling at its final outcome.
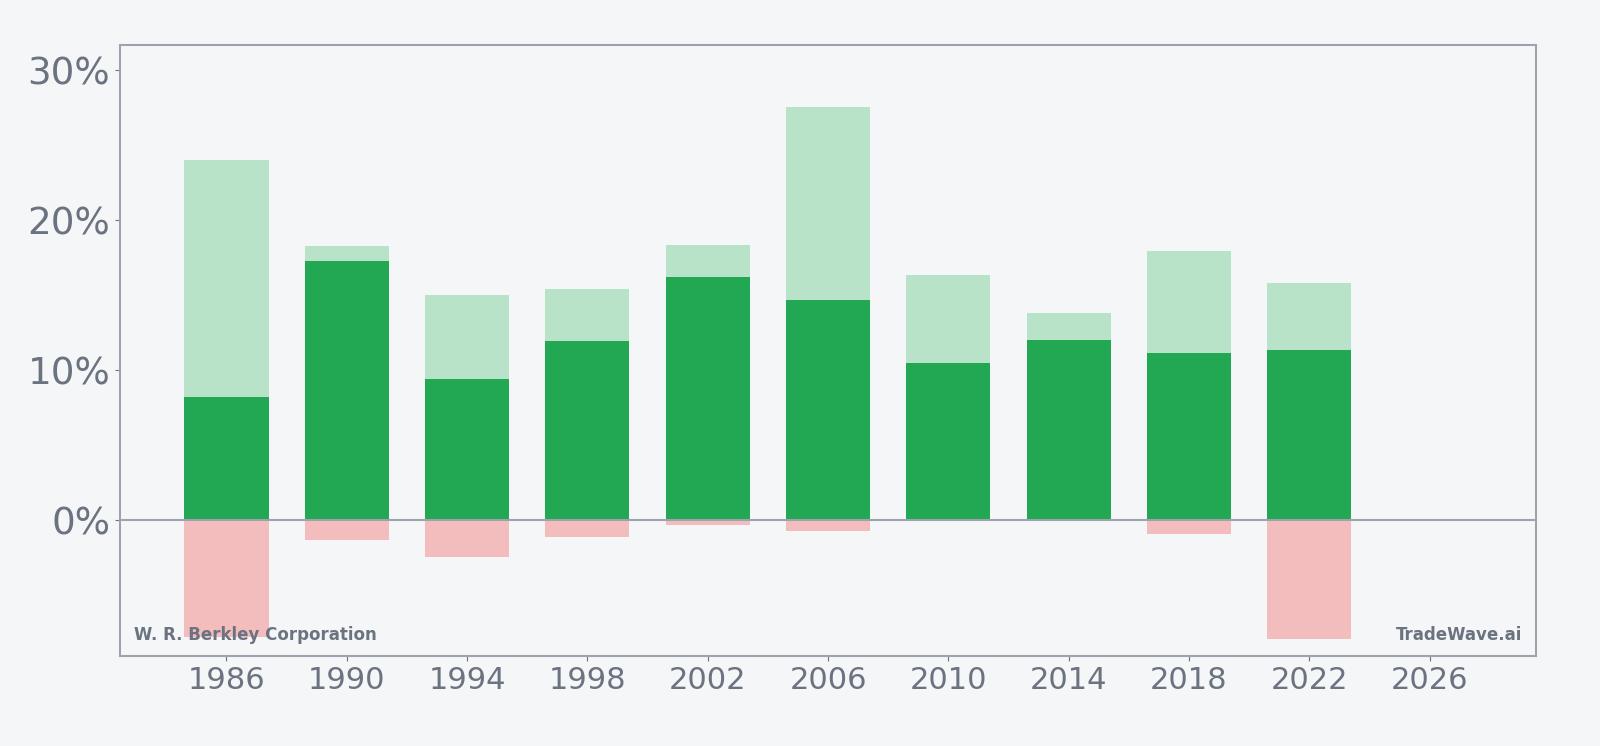
The combined net, peak favorable and worst adverse bars show that while the typical year has offered meaningful upside potential, the stock has also experienced notable swings within the window, with some years seeing double-digit rallies from entry alongside mid-single-digit temporary pullbacks. Taken together, the historical pattern defines the quantitative seasonal backdrop for the current period.
History does not guarantee future results, and adverse excursions can still be large within an otherwise profitable seasonal window.
Price and near-term drivers
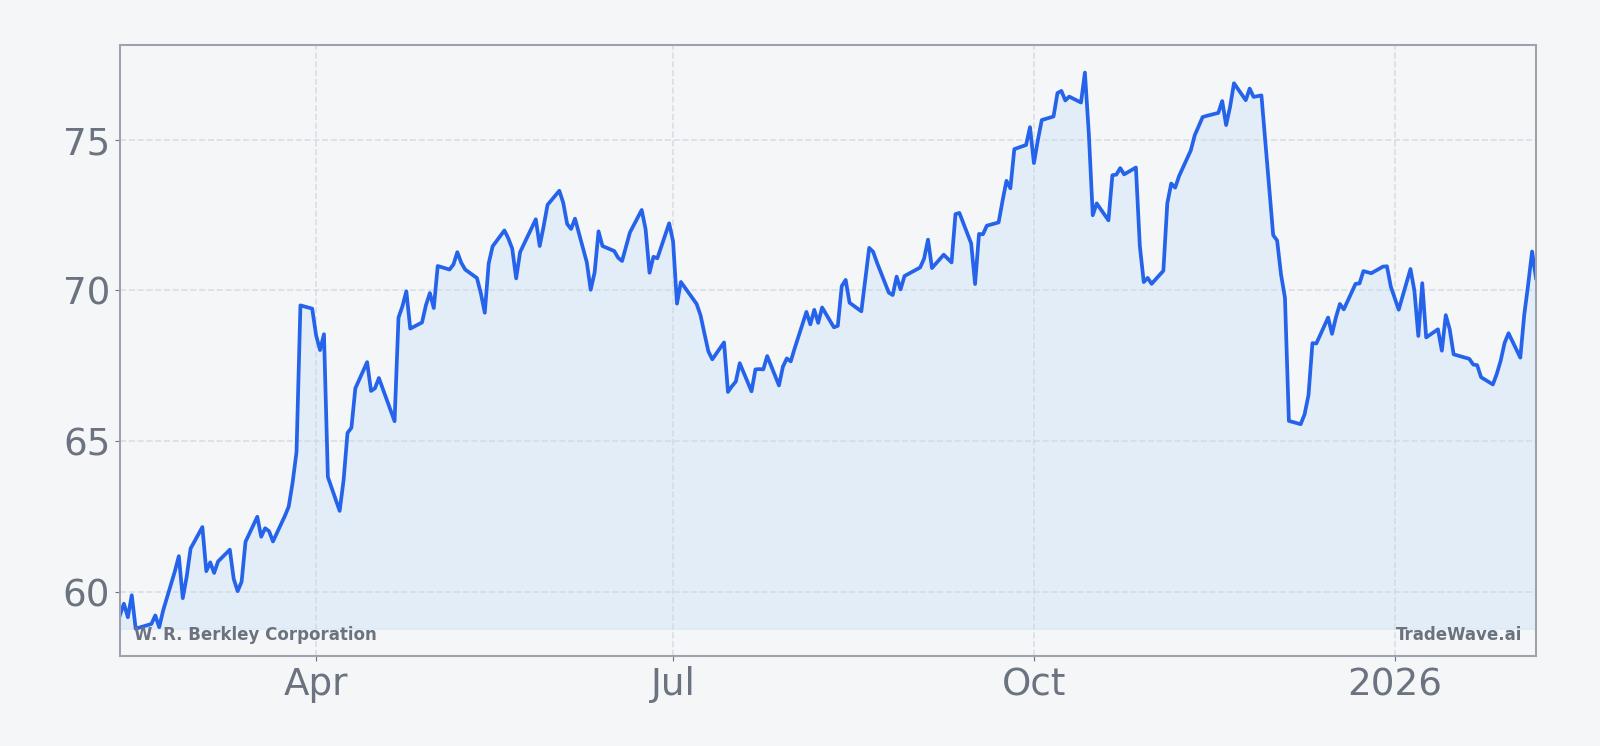
WRB shares last closed at 69.13, down 1.8% on the day, as the stock continues to trade without a clear read on its 52-week high or low from the available data. The latest move comes after a period in which the insurer has been supported by solid underwriting and investment income, even as catastrophe losses and macro uncertainty have remained in focus.[1]
The chart below situates the latest move in its recent multi-month context.
In July 2025, W. R. Berkley reported that second-quarter profit for common stockholders rose to $401.3 million, or $1 per share, from $371.9 million, or 92 cents, a year earlier, helped by a 7.2% increase in net written premiums and higher investment income.[1] The combined ratio ticked up slightly to 91.6% from 91.1%, while catastrophe losses climbed 10.7% to $99.2 million, underscoring the tension between strong core profitability and rising weather-related claims.[1]
Analysts at Forbes characterized the stock as a “buy” in 2025, highlighting W. R. Berkley as an overachiever within the property and casualty space, though no specific consensus price target is available in the current dataset.[2] That constructive view has been supported by investors’ search for companies perceived as relatively insulated from tariff-related trade risks, with insurance names like WRB seen as less directly exposed to shifting trade policy than manufacturers or exporters.[1]
At the same time, the sector faces structural challenges. Insurers have been absorbing heavy losses from frequent natural disasters such as hurricanes and wildfires, which can pressure earnings and capital even when underwriting discipline remains strong.[1] For a stock trading inside a historically favorable seasonal window, the balance between these macro and sector forces and the company’s own execution will likely shape how closely the current year tracks the historical pattern.
Macro and policy backdrop
The current phase of the presidential election cycle is the midterm election year, a period that often brings heightened debate over fiscal priorities, regulation and trade policy. For financials and insurers, this can translate into shifting expectations around capital standards, climate-related disclosure rules and the federal response to catastrophe risk, all of which can influence valuations and risk appetite.
In the context of W. R. Berkley, investors have previously gravitated toward the stock as a way to participate in earnings growth while sidestepping some of the direct fallout from tariff disputes and trade negotiations.[1] If trade policy uncertainty intensifies again during this midterm year, that dynamic could re-emerge, potentially reinforcing the historical tendency for the stock to perform well in this part of the cycle.
However, the same macro forces that support the business can also introduce volatility. Higher interest rates can boost investment income on insurers’ bond portfolios, but they can also weigh on broader equity valuations and increase the cost of capital. Meanwhile, a backdrop of more frequent and severe natural disasters raises questions about pricing power, reinsurance availability and the sustainability of loss trends, which can all affect how investors interpret quarterly results.[1]
What to watch in this window
For the remainder of this 88-day midterm-election-year window, investors watching W. R. Berkley may want to focus on a few concrete markers. First, the company’s next earnings update and any commentary on catastrophe losses, pricing and investment income will be important for gauging whether the fundamental story continues to align with the historically strong seasonal backdrop.[1] Second, price behavior around recent support and resistance levels on the chart will help indicate whether the stock is tracking the typical gradual climb seen in prior midterm years or diverging from it.
Third, sector and policy headlines around trade, regulation and climate risk could influence sentiment toward insurers more broadly, either reinforcing or offsetting the historical pattern that has favored WRB in this part of the cycle.[1] Finally, intraperiod volatility bears watching: in past years, even winning windows have included temporary drawdowns of several percentage points, so how the stock behaves during any pullbacks may offer clues about whether investors are using weakness to add exposure or stepping back from the name.
If WRB continues to show resilient price action in the face of macro and catastrophe headlines, that would be consistent with the long-directed, high win-rate seasonal profile. A sharper or more persistent break lower, by contrast, would signal that current fundamentals or policy risks are overpowering the historical tendency, reminding investors that seasonality is a guide rather than a guarantee.
Sources
- [1] Reuters, “W. R. Berkley second-quarter profit rises on strong underwriting,” Jul 21, 2025.
- [2] Forbes, “Unmasking W. R. Berkley: The Overachiever You're Missing,” Apr 16, 2025.