5G Fixed Wireless Pressure Builds on Comcast (CMCSA) Broadband Ahead of Q3 Earnings
Comcast has just entered a 39-day stretch that has historically leaned lower in midterm election years, as investors balance competitive broadband pressures with a solid long-run track record for the stock.

Key takeaways
- Comcast is in a 39-day seasonal window that, in the last 9 midterm election years, has historically favored downside moves for the stock.
- The pattern is short-directed, with 89% of historical years classified as profitable for that stance, including 8 winners and 1 loser.
- Average gains in winning years are 6.34%, while the all-years average, including the lone losing year, is 5%.
- The historical profile shows sizable intraperiod swings, with both strong favorable moves and notable adverse excursions before the window closes.
- Grouping results by presidential election cycle highlights how policy and regulatory uncertainty in midterm years has often coincided with choppier trading for Comcast.
- Investors should treat this as a context signal rather than a forecast, given the potential for large drawdowns even in historically “winning” years.
According to historical data from TradeWave.ai, this part of the calendar has shown a distinct pattern for Comcast in past midterm election years, and that backdrop is now in focus as the new window gets underway.
Seasonal window
Comcast’s current seasonal window began on Jan 18, 2026 and spans 39 trading days, a period that has historically been a weak stretch for the stock in midterm election years. With the shares trading through the early days of this regime, investors are watching how price action lines up against a pattern that has often rewarded a short bias in the past. The setup sits inside a broader presidential election cycle framework, where midterm years have tended to feature more policy uncertainty and uneven sector leadership than the surrounding phases.
In this framework, the pattern phase is defined as “the last 9 midterm election years,” while the calendar phase is the current midterm election year itself, in its early part. Grouping results by the presidential election cycle matters because policy decisions, regulatory shifts and fiscal debates often cluster differently in election years, the year after, midterm years and the year before the next election, and those macro rhythms can shape how a stock like Comcast trades around its core broadband, media and theme-park businesses.
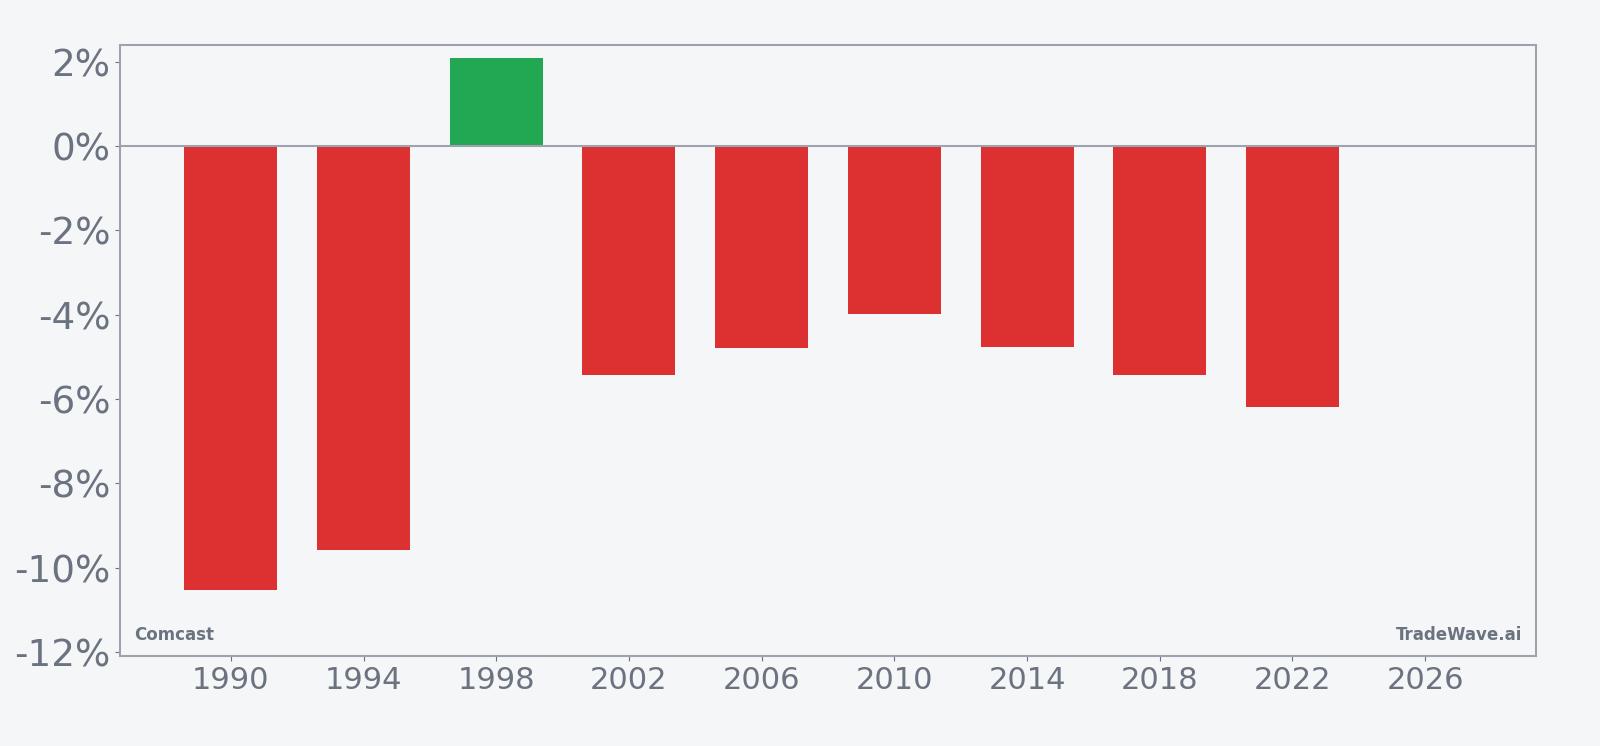
Historically, this 39-day window has favored a short stance in Comcast, with 89% of the sampled midterm years ending profitably for that direction and only 1 losing outcome across the nine observations. Average profit in the winning years is 6.34%, while the average across all years, including the lone loss, is 5%, which points to a relatively consistent negative drift for the stock during this stretch when viewed through a short lens. The median profit of 5.42% reinforces that the typical outcome has been meaningfully in favor of the short side rather than a marginal move.
The TradeWave Ratio of 2.78 indicates that, within the window, price has historically traveled a substantial distance in the trade direction before the period ends, even when the final close does not capture the full swing. That aligns with the pattern’s Sharpe ratio of 1.39, which reflects a relatively strong risk-adjusted profile based on end-of-window returns for this short setup. For traders who focus on intraperiod behavior, this combination suggests that the window has often delivered sizable moves rather than flat, low-volatility trading.
Looking at individual years, the weakest outcome for the short pattern came in 1998, when Comcast posted a net return of 2.09% during the window, meaning the short stance lost money even though the maximum adverse move against the trade reached 8.19% at one point. By contrast, 1990 stands out as one of the strongest years for the pattern, with a net return of -10.53% for the stock and a worst intraperiod drawdown from the short seller’s perspective of 12.28%, underscoring how quickly the trade could move in favor of the short direction once selling pressure took hold.
The historical seasonal trend chart shows that, on average, the short-favorable behavior tends to build gradually rather than in a single sharp break, with weakness often emerging after the first part of the window and persisting into the later days. That pattern suggests a tendency toward grinding downside rather than a one-day shock, although individual years have still featured abrupt moves. The cumulative return profile across the sample years points to a steady accrual of gains for the short stance, with relatively few reversals that fully erase earlier progress.
Year-by-year bars that combine net results with best and worst intraperiod swings help clarify how much room Comcast has historically given both sides of the tape during this window.

The combined net / maximum favorable excursion / maximum adverse excursion bars show that even in years where the short stance ultimately worked, Comcast often experienced sizable countertrend rallies before resuming its historical pattern. In several midterm years, the maximum favorable move for the short side was accompanied by a notable adverse swing earlier in the window, highlighting that timing and risk management have mattered as much as direction. Taken together, the historical pattern defines the quantitative seasonal backdrop for the current period.
History does not guarantee future results, and maximum adverse excursions can be large even in years that ultimately finish as winners for the pattern.
Price and near-term drivers
Comcast enters this midterm-year seasonal stretch with investors still digesting a strong 2025 performance narrative that has drawn renewed interest in the stock.[2] In late December 2025, Forbes highlighted Comcast as a potential opportunity, pointing to improving fundamentals and a constructive setup after a period of underperformance, which has helped frame expectations heading into 2026.[2]
That optimism follows a year in which Comcast’s operations showed resilience across several business lines. In July 2025, the company reported second-quarter revenue of $30.31 billion, ahead of Wall Street estimates, with adjusted earnings per share of $1.25 also topping forecasts, helped by the opening of its Epic Universe theme park and continued growth in wireless subscribers.[3][5][6] Management emphasized steady free cash flow generation for 2025 despite ongoing broadband challenges, reinforcing the idea that the company could fund both investment and shareholder returns even in a tougher competitive landscape.[5][6]
At the same time, Comcast faces structural headwinds that could shape how the stock trades during this seasonal window. The cable and media industry has been grappling with stagnating broadband growth, as fixed wireless offerings from 5G providers such as T-Mobile have intensified competition for home internet customers, pressuring subscriber additions and pricing power.[1] Sector-wide, that has pushed incumbents like Comcast and Charter to lean more heavily on mobile, streaming and theme parks to drive incremental growth, a shift that can introduce new capital needs and execution risks.[1]
Strategic moves on the media side are also in focus. In early December 2025, Bloomberg reported that Comcast was exploring a bid to merge its NBCUniversal unit with Warner Bros., a potential deal that would reshape the streaming and content landscape if it were to proceed.[7] Any renewed headlines around large-scale media consolidation, regulatory review or asset sales could add volatility to Comcast’s shares during the current seasonal window, particularly given the heightened scrutiny that often accompanies major transactions in a midterm election year.
Investor positioning has been active as well. Forbes analysis in late December noted that Comcast’s stock had attracted attention from investors looking for value and recovery potential, reflecting a shift in sentiment after earlier skepticism about the company’s growth prospects.[2] That backdrop means the seasonal pattern is intersecting with a market that is already engaged with the name, which can amplify both follow-through and reversals as new information arrives.
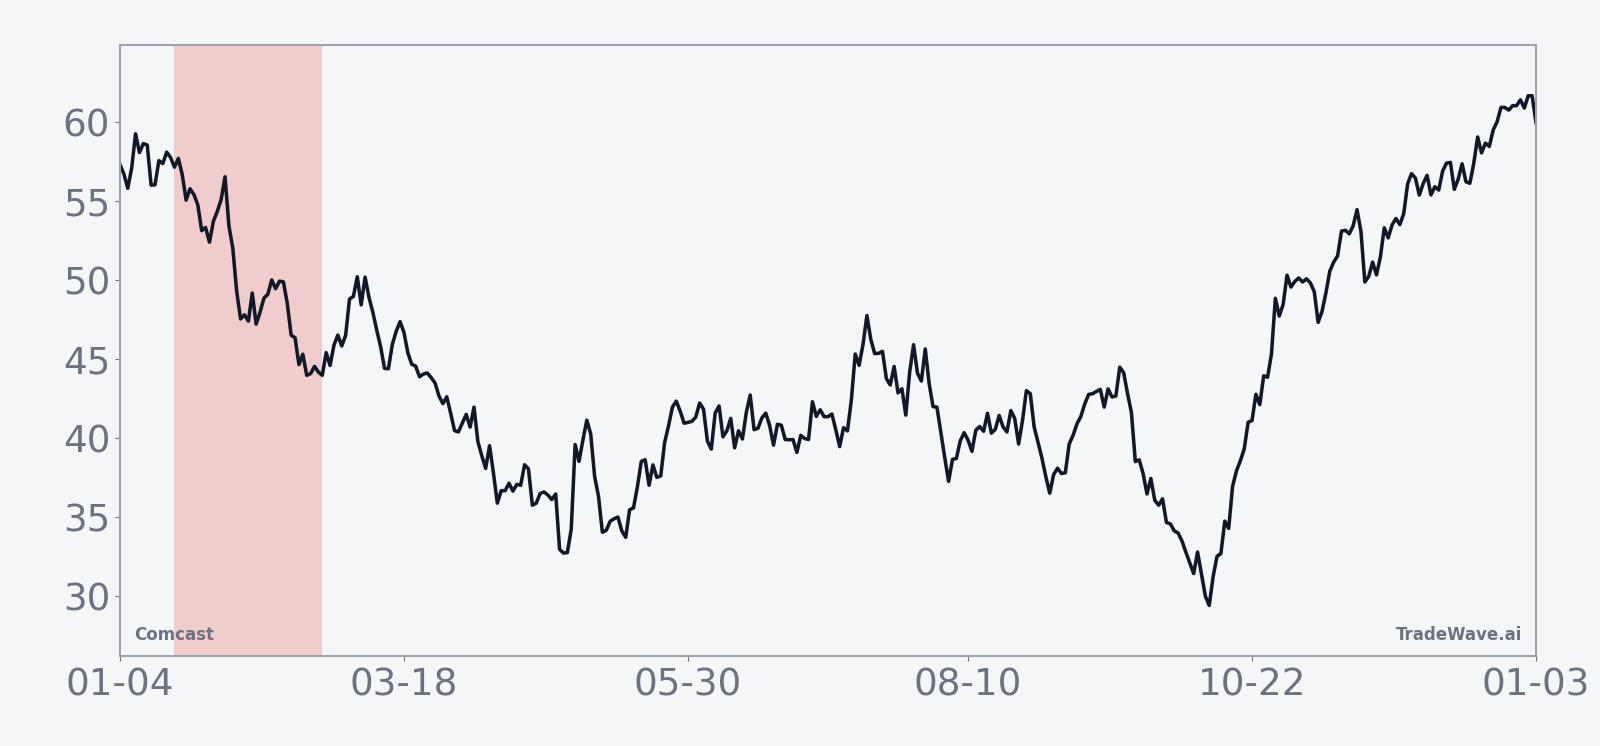
The chart below situates Comcast’s latest trading behavior within its recent multi-month path.
Macro and political backdrop
The current midterm election year adds another layer to Comcast’s setup. Historically, midterm years have featured more contentious policy debates over issues such as broadband regulation, media consolidation and spectrum allocation, all of which can influence sentiment toward large communications and media companies. For Comcast, whose businesses span cable, streaming, wireless and theme parks, shifts in regulatory tone or antitrust enforcement can affect both strategic options and investor risk appetite.
Industry dynamics are also evolving as 5G fixed wireless continues to gain traction. CNBC’s preview of Comcast’s third-quarter 2025 earnings noted that Wall Street was watching how competition from wireless providers would affect broadband subscriber trends, even as mobile growth and theme parks provided offsets.[1] That tension between mature broadband markets and newer growth engines is likely to remain a central theme through this midterm year, particularly if economic growth slows or consumer spending patterns change.
From a policy-calendar perspective, investors will be monitoring any developments around infrastructure spending, digital inclusion initiatives and media ownership rules, which can all influence Comcast’s long-term investment plans. Midterm years often see legislative pushes ahead of the next presidential race, and for a company with Comcast’s footprint, even incremental changes in regulation or tax treatment can alter the risk-reward calculus that underpins how traders interpret seasonal patterns.
What to watch in this window
For the remainder of this 39-day midterm-year window, traders will be watching whether Comcast’s price action aligns with the historical tendency toward weakness that has favored a short stance in 8 of the last 9 comparable years. A sustained drift lower, particularly if it develops after brief countertrend rallies, would be consistent with the average seasonal profile, while a firm, low-volatility grind higher would mark a clear departure from past behavior.
On the fundamental side, broadband subscriber trends and any fresh commentary on competition from 5G fixed wireless providers will be key, especially as investors look ahead to Comcast’s next earnings updates and any guidance revisions.[1] Signals around theme-park performance and streaming engagement will also matter, given their growing role in offsetting pressure in legacy cable businesses.[3][5][6]
Policy and deal headlines could be another swing factor. Any renewed discussion of a potential NBCUniversal combination with Warner Bros., or broader media consolidation, would likely intersect with regulatory scrutiny that tends to intensify in midterm years, potentially adding volatility to the stock.[7] Traders will be gauging whether such news flow reinforces or disrupts the historical seasonal pattern.
Finally, investors may compare Comcast’s behavior to the broader communications and media sector, where stagnating broadband growth and shifting consumer habits remain central themes.[1] If the stock underperforms peers during this window, it would fit the historical short-favorable pattern; if it proves more resilient, that divergence could signal that company-specific drivers are starting to outweigh the usual midterm-year seasonal forces.
Sources
- [1] CNBC, "Comcast reports earnings before the bell. Here's what to expect" (Oct 30, 2025)
- [2] Forbes, "Is This Your Chance To Make Money In Comcast Stock?" (Dec 29, 2025)
- [3] Reuters, "'Epic' boost drives Comcast's quarterly results" (Jul 31, 2025)
- [4] Forbes, "Is Comcast Stock Finally A Buy?" (Oct 23, 2025)
- [5] The Wall Street Journal, "Comcast Posts Revenue Growth, With Theme Park and Xfinity Mobile Gains" (Jul 31, 2025)
- [6] The Wall Street Journal, "Comcast Sales Climb with More Streaming Subscribers, Mobile Customers" (Jul 31, 2025)
- [7] Bloomberg, "Comcast’s Bid Seeks to Merge NBCUniversal Unit With Warner Bros." (Dec 02, 2025)