Target (TGT) Trades Well Below 52-Week High as Weak Q1 Earnings Outlook Weighs
TGT is trading well below its 52-week high as it approaches a historically strong 82-day midterm-election-year seasonal window, giving investors a structured way to think about potential upside and volatility into the spring.

Key takeaways
- TGT is heading into an 82-day seasonal window starting Feb 8 that has historically been favorable for long positions in midterm election years.
- The pattern shows TGT profitable in 85% of years, with 11 winners and 2 losers across the sample.
- Average gains in winning years are 13.75%, while the all-years average, including losers, is 11%.
- Historical paths feature meaningful rallies but also intraperiod drawdowns, with both best-case and worst-case excursions that traders need to respect.
- The window sits in the early part of the midterm election year, a phase that often reflects shifting expectations around policy, rates and consumer demand.
- With TGT trading well below its 52-week high, the upcoming seasonal tendency offers a contrasting backdrop to the stock’s recent weakness.
According to historical data from TradeWave.ai, this part of the calendar has shown a distinct pattern for TGT in prior midterm election years, and the next section looks at how that backdrop lines up with today’s setup.
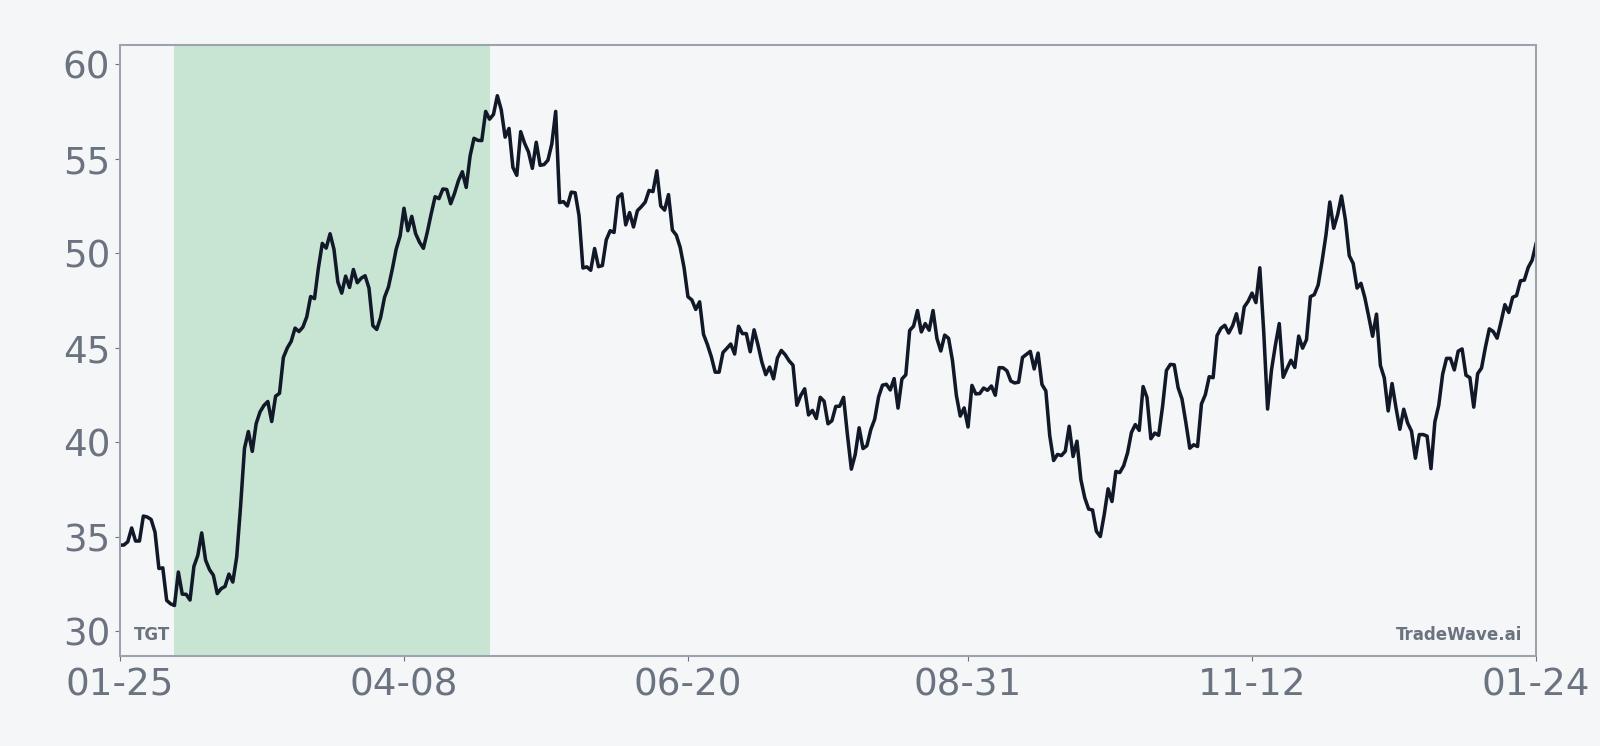
Seasonal window
This seasonal window begins on Feb 8, 2026 and spans 82 days. Today TGT trades at $94.30, leaving it about 35.0% below its 52-week high of $145.08 and roughly 13.0% above its 52-week low of $83.44, so the stock is entering this phase from the lower half of its one-year range.[2]
The analysis groups history by the presidential election cycle and focuses on midterm election years, which is the phase the market is entering in 2026. Grouping returns this way matters because policy debates, fiscal decisions and regulatory shifts often follow a four-year rhythm, and consumer-facing names like TGT can feel those shifts in traffic, pricing power and investor sentiment more acutely during mid-cycle years.
Historically, during this midterm-year window TGT has shown a strong upside tendency aligned with a long trade direction. The pattern has been profitable in 85% of years, with 11 winners and 2 losers, indicating that positive outcomes have dominated but not been universal. Average profit in winning years is 13.75%, while the average across all years, including the losing ones, is 11%, which suggests that down years have tended to be smaller in magnitude than the stronger rallies.
Avg Profit reflects winners only, while Avg Profit - All includes every year in the sample, so the gap between the two gives a sense of how much the losing years have dragged on the overall average. In this case the difference is modest, which points to a pattern where the typical winning year is not dependent on a single outlier but instead reflects a cluster of solid advances.
The historical volatility profile is captured by the maximum favorable and maximum adverse excursions within the window, often abbreviated as MFE and MAE. Maximum favorable excursion represents the best point-to-peak move in the trade direction during the window, while maximum adverse excursion is the worst drawdown from the starting point before any recovery. In strong years such as 1986 and 1994, TGT saw sizable peak run-ups with limited downside, whereas in years like 2006 and 2022 the stock experienced deeper adverse moves even when the final result was positive.
The TradeWave Ratio (TWR) for this pattern is 2.02, which describes how far price typically travels in the trade direction within the window, independent of the final close. Combined with a Sharpe ratio of 1.06, a risk-adjusted average return measure based on end-of-window outcomes, the data points to a window that has historically offered meaningful upside relative to its volatility, though not without periods of discomfort along the way.
Looking at individual years, 1986 stands out as one of the strongest, with a net return of 24.99% and a maximum favorable excursion of 36.94% while avoiding any meaningful drawdown during the window. By contrast, 2006 delivered a small loss of 1.54% and saw a maximum adverse move of 6.32%, illustrating that even in a generally constructive pattern, some midterm years have produced choppy or negative outcomes for TGT.
The historical seasonal trend chart for this window shows that gains have often built gradually rather than in a single burst. In many years, TGT has tended to firm up early in the window, consolidate, and then add to gains into the later weeks, although the exact timing of peaks and pullbacks has varied from cycle to cycle.
The cumulative return profile across the sample reinforces this picture of steady, if uneven, progress. The average path slopes higher over the 82 days, with periods of sideways movement and occasional dips that reflect the intraperiod drawdowns captured by the adverse excursion data.
From a risk perspective, the bars that combine net results with both maximum favorable and maximum adverse excursions highlight the trade-off. Many years show sizable upside potential alongside non-trivial downside swings, which means that even historically successful windows have included stretches where TGT moved against the prevailing pattern before recovering.
Taken together, the historical pattern defines the quantitative seasonal backdrop for the current period, offering context rather than a forecast as TGT approaches this midterm-year window.
A second view combines yearly net results with best and worst intraperiod swings to show how upside and drawdown have interacted in past cycles.
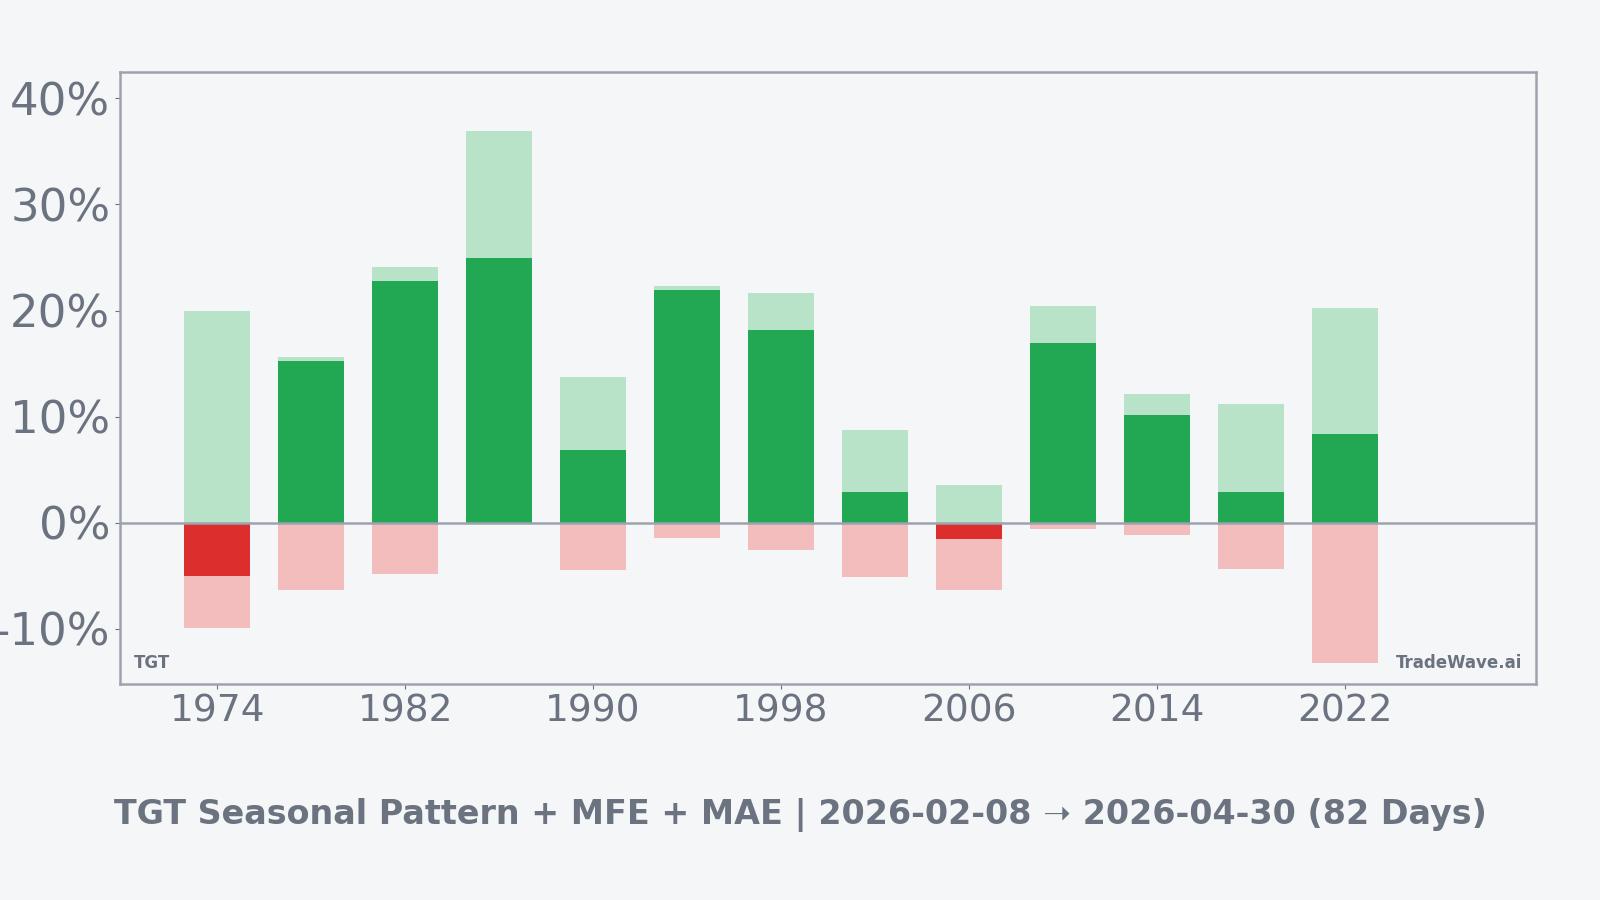
History does not guarantee future results, and adverse excursions can be large even in winning windows.
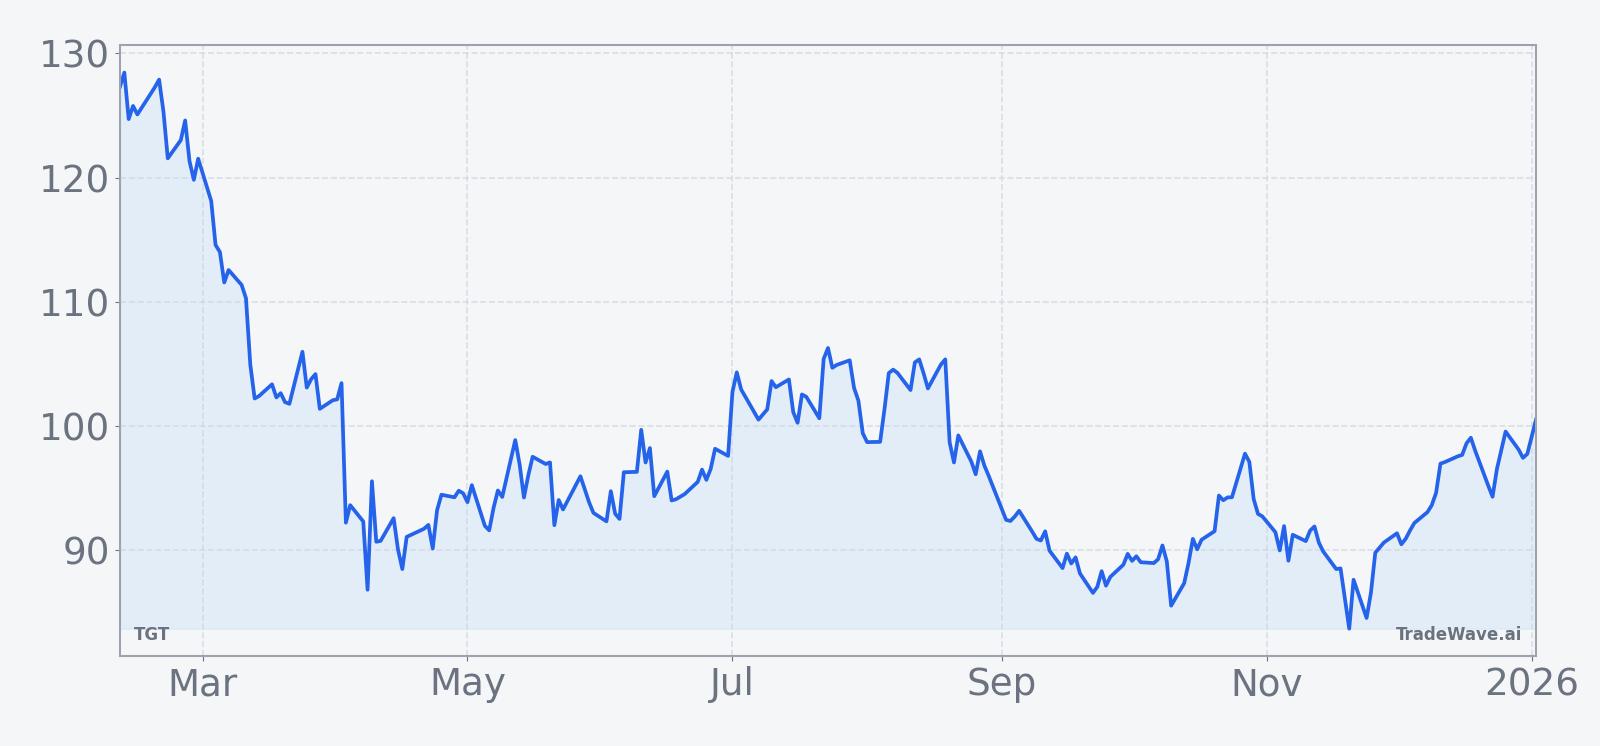
Price and near-term drivers
TGT last traded at $94.30, down 0.95% on the day, leaving the stock well below its 52-week high of $145.08 and modestly above its 52-week low of $83.44 as investors weigh the outlook for big-box retail and consumer spending.[2] The stock’s position in the lower half of its one-year range means that any seasonal tailwind would be acting on a name that has already seen substantial compression from prior peaks.
The chart below situates the latest move in its recent multi-month context.
Fundamentally, investors are looking ahead to TGT’s next scheduled earnings report on Mar 2, 2026, when the company is expected to discuss results for its fiscal fourth quarter of 2025.[1] Earlier commentary around the 2025 earnings cycle highlighted expectations for softer profit growth as TGT navigated shifting consumer demand and competitive pressures, and those themes remain central as the retailer moves through the current economic environment.[1]
Longer-term context also includes the fallout from TGT’s 2023 Pride campaign, which drew consumer backlash and contributed to a rare decline in sales after several years of growth.[8] That episode underscored how quickly sentiment can swing for large retailers when brand, politics and consumer behavior intersect, a dynamic that may again be relevant as the United States moves deeper into the current presidential cycle.
Macro and political backdrop
The upcoming seasonal window unfolds in the midterm election year of the current presidential cycle, a phase that has historically featured shifting expectations around fiscal policy, regulation and interest rates. For retailers like TGT, this environment can influence everything from wage costs and credit conditions to consumer confidence, which in turn shapes traffic and ticket size.
In midterm years, markets often grapple with debates over spending priorities and potential changes in regulatory focus, including labor standards and data privacy. While the specific policy mix in 2026 will depend on developments in Washington, the broader pattern of mid-cycle uncertainty helps explain why some stocks show distinct seasonal behavior tied to this phase of the election calendar.
For TGT, the combination of a historically constructive midterm-year window and a share price that is still well below its prior 52-week high creates a nuanced setup. The seasonal pattern suggests that this stretch of the calendar has often coincided with improving performance, yet the macro and political backdrop can still inject volatility, particularly if consumer spending or policy expectations shift abruptly.
What to watch as the window approaches
With the 82-day window set to begin on Feb 8, investors will be watching how TGT trades in the weeks leading up to and through the period relative to its historical pattern. One focal point will be whether the stock can hold above its recent lows and begin to build a base, or whether renewed pressure pushes it closer to the 52-week trough before the seasonal window fully opens.[2]
On the fundamental side, the Mar 2 earnings report will arrive early in the window and could act as a key catalyst, either reinforcing or challenging the historical tendency toward strength.[1] Commentary on holiday-season performance, inventory levels and margin trends will be especially important for gauging whether the business backdrop is aligned with the constructive seasonal statistics.
Policy and macro developments will also matter. Any shifts in expectations around consumer spending, labor markets or fiscal policy during the midterm election year could influence how closely TGT’s actual path tracks its historical mid-cycle pattern. Stronger-than-expected consumer data might support the kind of steady advance seen in many prior midterm-year windows, while negative surprises could bring the larger adverse excursions that have occasionally appeared in the sample.
Ultimately, the seasonal window provides a quantitative frame rather than a script. Traders and longer-term investors alike may use it as one input among many, monitoring whether price action, earnings commentary and macro signals confirm or contradict the historical tendency as the midterm-year window unfolds.