Dow Jones Industrial Average
The Dow Jones Industrial Average tracks 30 prominent blue-chip companies listed on U.S. stock exchanges. It is one of the oldest and most-watched indices in the world.
A sharp divergence defines the Dow's seasonal setup right now. The trailing 10-year pattern turns strongly bullish over 90 days, projecting a 19.97% gain to 59,127 with a 90% win rate. But midterm election years tell a starkly different story: 90-day win rates collapse to 38.9%, with an average return of negative 2.44% and a projected target near 45,446.
That gap is the key tension to watch. Midterm years historically punish the Dow through the summer, with 60-day win rates hitting just 33.3% and average losses near 3%. The broader 10-year trend offers optimism, but the presidential cycle overlay carries significant weight. Investors should treat any near-term rally with skepticism until the midterm seasonal headwind clears.
Seasonal Price Projections
Select a historical basis and projection horizon to see where seasonal patterns suggest Dow Jones Industrial Average may be headed.
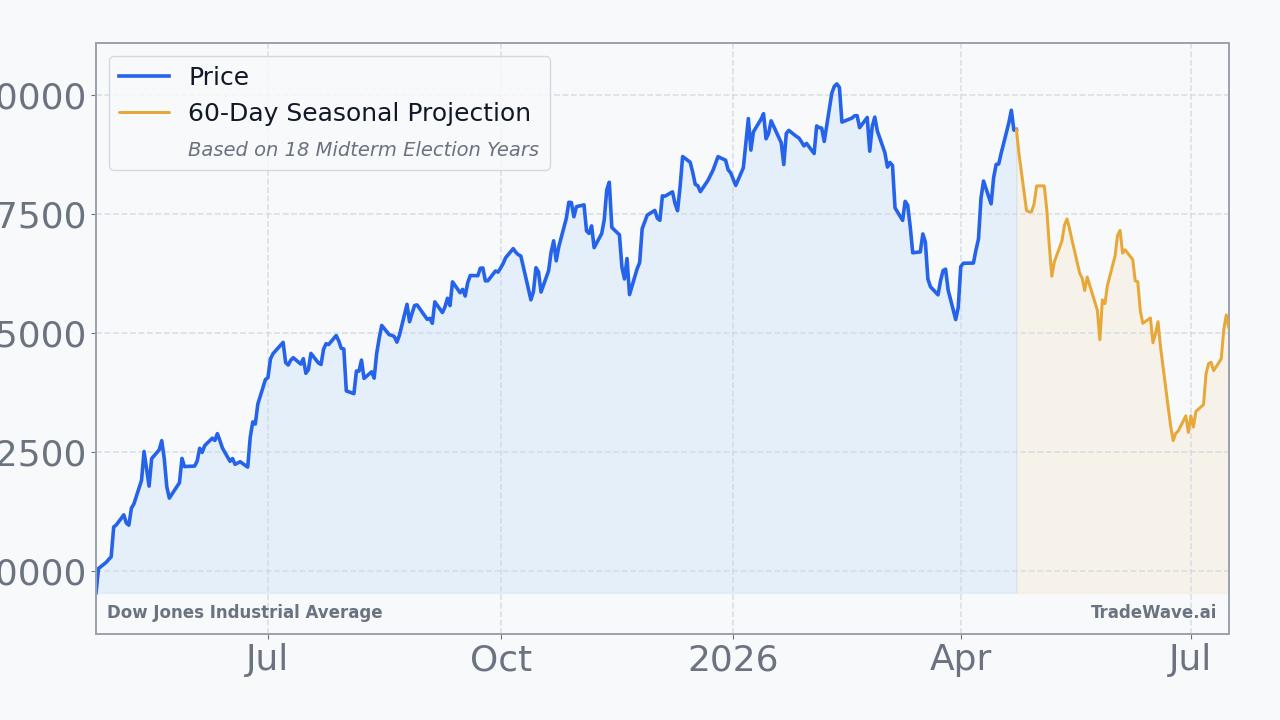
Projection as of Apr 24, 2026 from closing price $49,310.32
How to Use This Data
Seasonal projection data for the Dow Jones Industrial Average reflects how the index has historically performed during this same calendar period across past years. The consecutive pattern shows a 70.0% win rate, meaning the DJIA finished higher in 70 out of every 100 comparable historical periods. The midterm election year pattern tells a notably different story, with only a 33.3% win rate.
When the two bases diverge as they do here, pointing in opposite directions with projected returns of +12.7% and -8.5% respectively, it signals that the election cycle has historically produced meaningfully different conditions than the broader seasonal trend. The median return is often more useful than the average because it reduces distortion from extreme outlier years, making it a steadier reference point.
Historical patterns cannot account for sudden shifts in monetary policy, geopolitical developments, earnings surprises, or breaking macroeconomic news. A 70.0% win rate still leaves a 30.0% historical frequency of losses, and no win rate eliminates uncertainty in any individual year. These figures describe tendencies across many years, not predictions for the current one.
Seasonal data serves as one contextual layer that market participants can weigh alongside fundamental analysis, technical signals, and broader economic conditions. It can help frame expectations about historical tendencies during a given period without substituting for a complete analytical picture.
This information is provided for educational purposes only and does not constitute financial advice, a recommendation, or a solicitation to buy or sell any security. Seasonal patterns are based on historical data and do not guarantee future performance. All investment decisions carry risk. Consult a qualified financial advisor before making investment decisions.
Understanding Seasonal Projections
Seasonal projections estimate future price movement based on how Dow Jones Industrial Average has historically performed during the same calendar period. These are statistical baselines derived from decades of market data, not predictions.
Consecutive Years (Last 10)
Uses the most recent 10 years of data regardless of market regime. This captures the broadest recent behavior, including all economic and political environments. Over the next 60 trading days, this pattern has been positive 7 of 10 times with an average return of +1.3%.
Midterm Election Years (18 Available)
Uses only years that fall in the same position within the 4-year U.S. presidential election cycle. 2026 is a midterm election year. Markets often exhibit distinct patterns tied to fiscal and monetary policy shifts within this cycle. In 18 historical midterm election years, this 60-day window was positive 6 times with an average return of -3.0%.
Seasonal patterns reflect historical tendencies and do not guarantee future results. All projections are based on past performance and should be used as one input among many in your investment decision-making process. Data provided by TradeWave.ai.
Latest News
Recent headlines related to Dow Jones Industrial Average, sourced from major financial news outlets with AI sentiment analysis.
- Markets Recover With Focus on Big Tech Earnings Over Iran. Stock Futures Rise.
- Review & Preview: Earnings Storm
- Stock market today: Dow, S&P 500, Nasdaq futures hold steady after Israel and Lebanon announce three-week ceasefire extension
- Stocks close lower on fading hopes for quick Iran deal
- Hercules Capital (HTGC) Sees a More Significant Dip Than Broader Market: Some Facts to Know
- Dropbox (DBX) Dips More Than Broader Market: What You Should Know
- Why the Market Dipped But Enviri (NVRI) Gained Today
- Consolidated Water (CWCO) Increases Despite Market Slip: Here's What You Need to Know
- Garmin (GRMN) Registers a Bigger Fall Than the Market: Important Facts to Note
- BigBear.ai Holdings, Inc. (BBAI) Registers a Bigger Fall Than the Market: Important Facts to Note
Explore More
Other markets with seasonal analysis and recent pattern articles.