Infrastructure and Manufacturing Trends Drive Demand Debate Around W. W. Grainger (GWW)
W. W. Grainger is moving through an 82-day midterm-year pattern that has historically delivered steady gains, giving investors a seasonal backdrop as they watch the stock’s next stretch of trading in a shifting policy environment.

Key takeaways
- W. W. Grainger is in an 82-day seasonal window that begins Jan 28 and is tied to the midterm election year phase of the presidential cycle.
- Across the last 12 midterm election years, this window has been profitable in 100% of cases, with 12 winners and 0 losers for a long trade.
- Average profit in those winning years is 8.71%, with a median gain of 8.52%, pointing to a historically steady upside bias.
- The TradeWave Ratio of 3.2 indicates that price has typically traveled meaningfully in the trade direction within the window, beyond just the final closing result.
- Intraperiod swings have included sizable drawdowns in some years, even when the window ultimately finished higher, underscoring the need to respect downside volatility.
- The pattern sits in the early part of the midterm election year, when policy uncertainty and rate expectations can amplify moves in industrial names like W. W. Grainger.
According to historical data from TradeWave.ai, this part of the calendar has shown a distinct seasonal tendency for W. W. Grainger in past midterm election years. The next section looks at how that pattern has behaved and what it implies for the current window.
Seasonal window
This seasonal window is currently underway, spanning 82 days, and has historically been a strong stretch for W. W. Grainger during the midterm election year phase of the presidential cycle. With no fresh public price data available for the stock today, the focus for investors is on how this historically constructive pattern lines up with the broader policy and rate backdrop that typically shapes industrial demand in this part of the cycle.
Grouping the data by presidential election cycle matters here because industrial demand, capital spending and regulatory expectations often move with the policy calendar, and midterm years can look very different from pre-election or post-election years. For a company like W. W. Grainger that sits at the intersection of maintenance, repair and operations spending across the economy, those shifts in fiscal stance and business confidence can show up in a repeatable seasonal pattern.
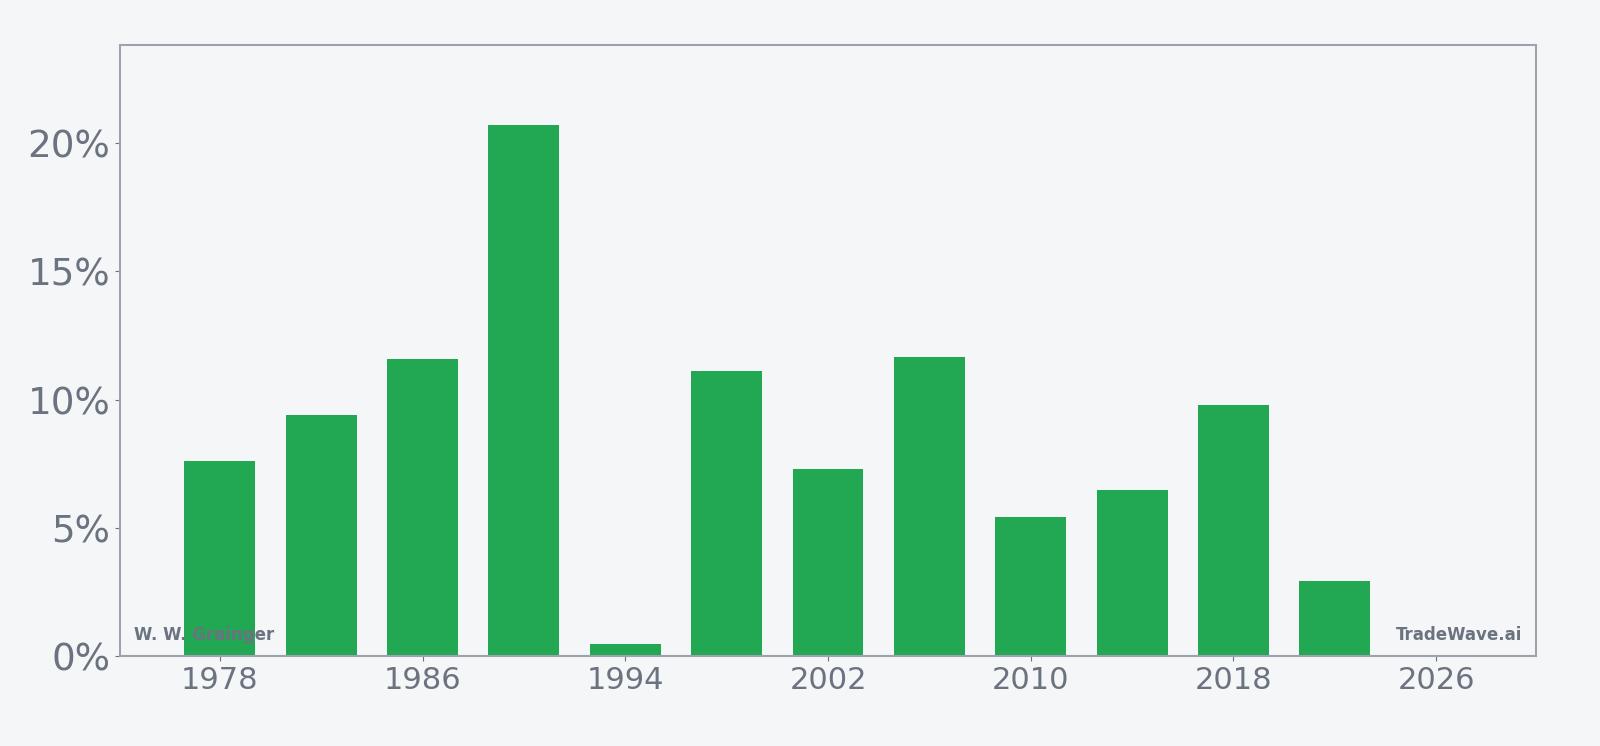
In this window, the trade direction is explicitly long, and historically every one of the last 12 midterm election years in the sample has produced a positive outcome by the end of the 82 trading days. The average profit of 8.71% and median gain of 8.52% indicate that results have clustered around a mid‑single to high‑single digit advance, rather than relying on a single outsized year to carry the statistics.
The distribution of individual years shows both strong and modest outcomes. The best net return in the sample came in 1990, when the stock gained 20.7% from entry to exit, while one of the softer years was 1994, which still finished slightly higher with a 0.49% gain. Even in more challenging macro backdrops such as 2022, the pattern window closed with a 2.92% advance, underscoring the consistency of the historical tendency.
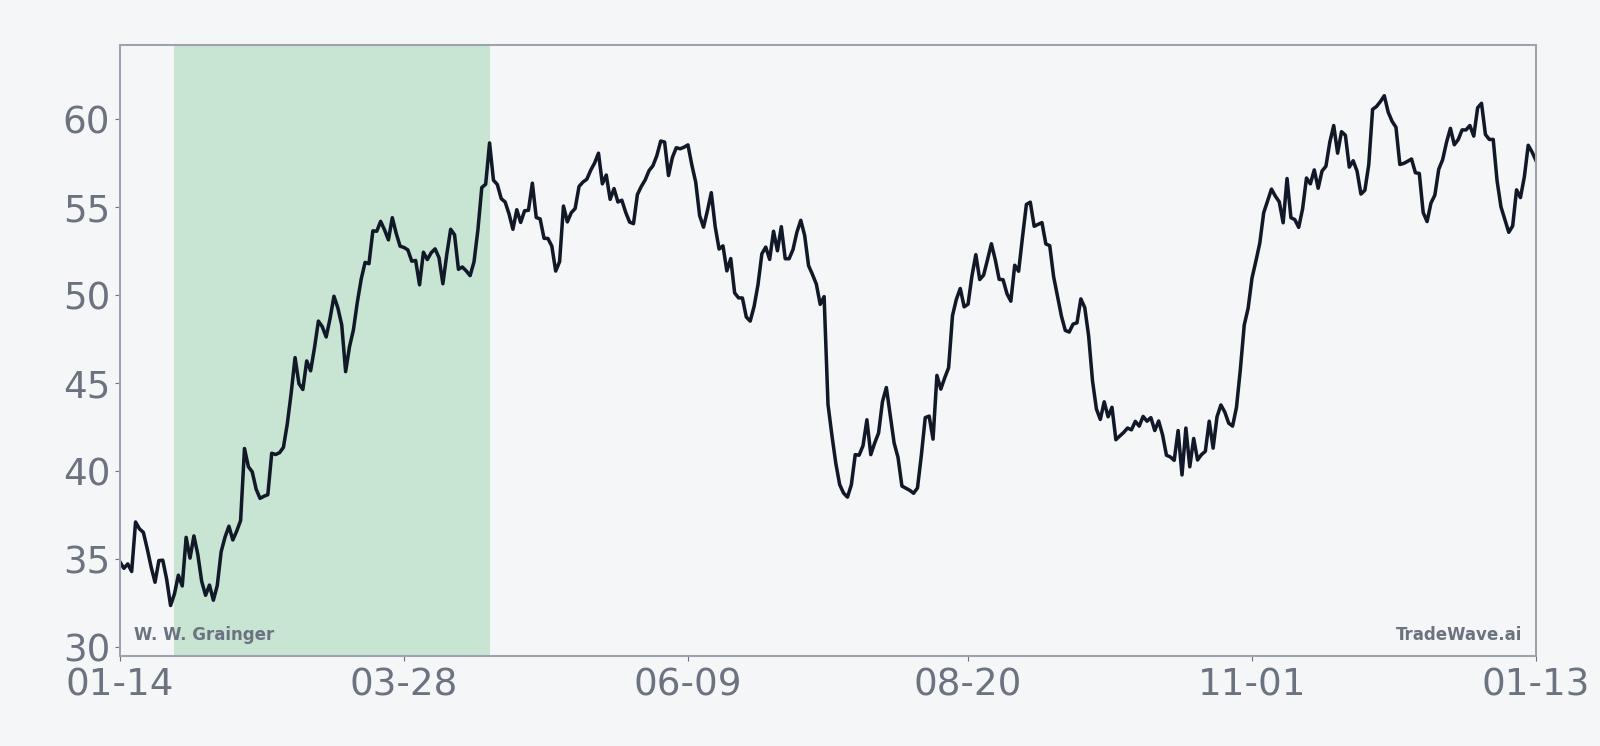
The historical seasonal trend line suggests that gains have tended to build relatively steadily through the window rather than arriving in a single late surge. In several years, including 1986, 1998 and 2006, the stock advanced by roughly 7% to 12% with limited mid-window giveback, while years like 2010 and 2014 showed more moderate net gains but still followed an upward-sloping path overall.
A closer look at yearly net results alongside intraperiod swings highlights how upside and downside have interacted within this pattern.
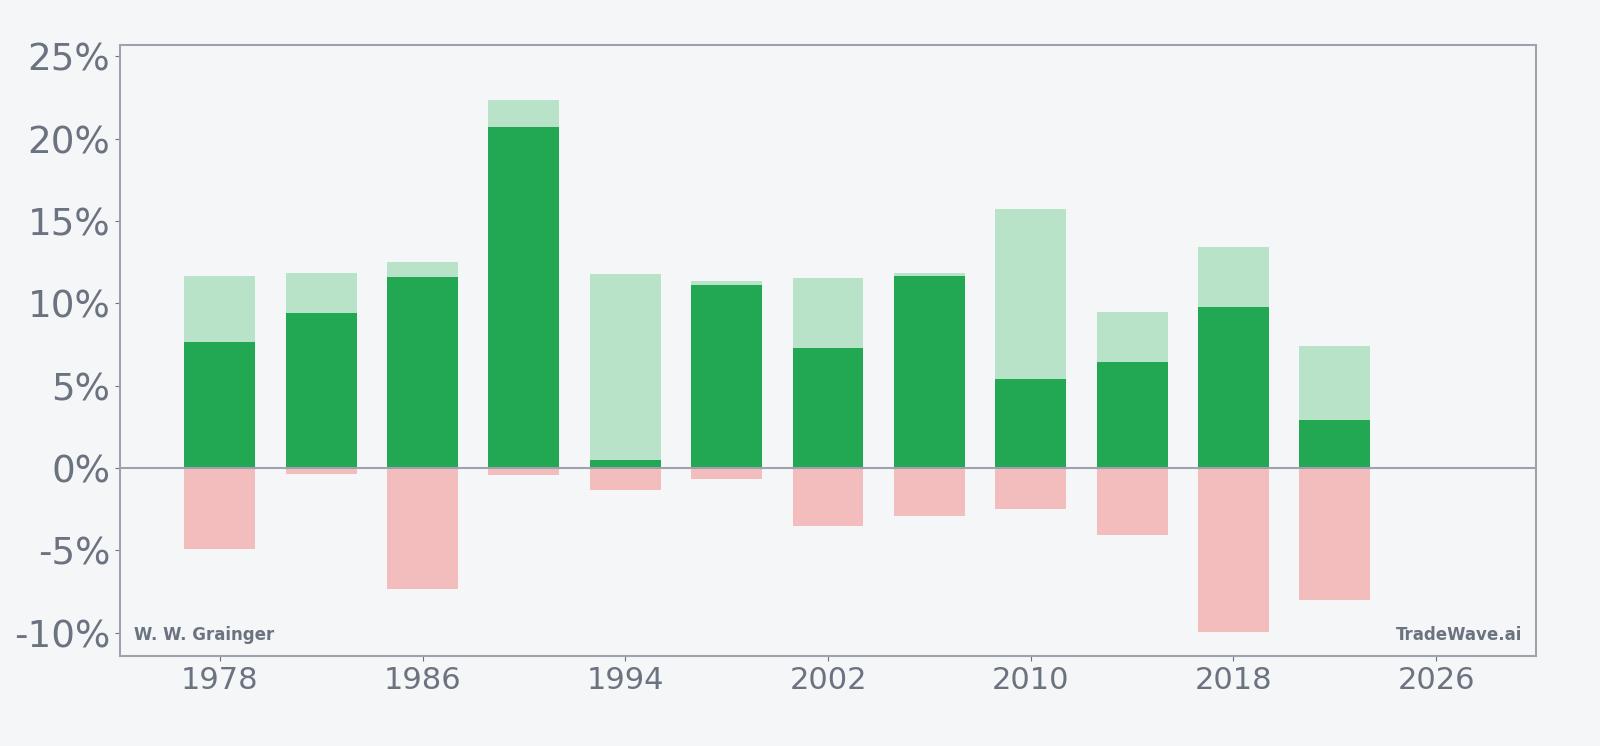
The combined net, maximum favorable move and maximum adverse move profile shows that while upside potential has often been substantial, drawdowns inside the window have at times been meaningful. For example, in 2018 the stock ultimately gained 9.8%, but the worst intraperiod drawdown reached about 9.95% before recovering, and in 2022 the maximum adverse move was about 8.03% even though the window finished higher. By contrast, years like 1990 and 1998 paired strong net gains with relatively contained downside, reflecting a smoother ride for long positions.
The cumulative return statistics reinforce this picture of a constructive but not risk‑free pattern. A cumulative return of 169% across the sample and an annualized return of 8.6% sit alongside a standard deviation of 5.12% and a Sharpe ratio of 1.53, which together point to a historically favorable risk‑adjusted profile for this specific midterm‑year window.
History does not guarantee future results, and even in windows where all past years were profitable, adverse excursions can be large enough to challenge risk management before the pattern plays out.
Taken together, the historical pattern defines the quantitative seasonal backdrop for the current period.
Price and near-term drivers
With no up-to-date quote, volume or 52-week range data available for W. W. Grainger, investors are watching this seasonal window against a backdrop of broader equity markets that have continued to see individual stocks make fresh highs, break below key moving averages or post sharp single-day moves in late 2025 and early 2026.[9][11][12] In December 2025, for example, Global Self Storage traded 4% higher in a single session, while Generation Mining hit a new 52-week high, and in the same period Ur-Energy slipped below its 50-day moving average, illustrating how quickly sentiment can rotate across sectors even without company-specific headlines.[9][11][12]
The chart below situates W. W. Grainger’s recent path over the past year, providing context for how the stock entered this seasonal window.
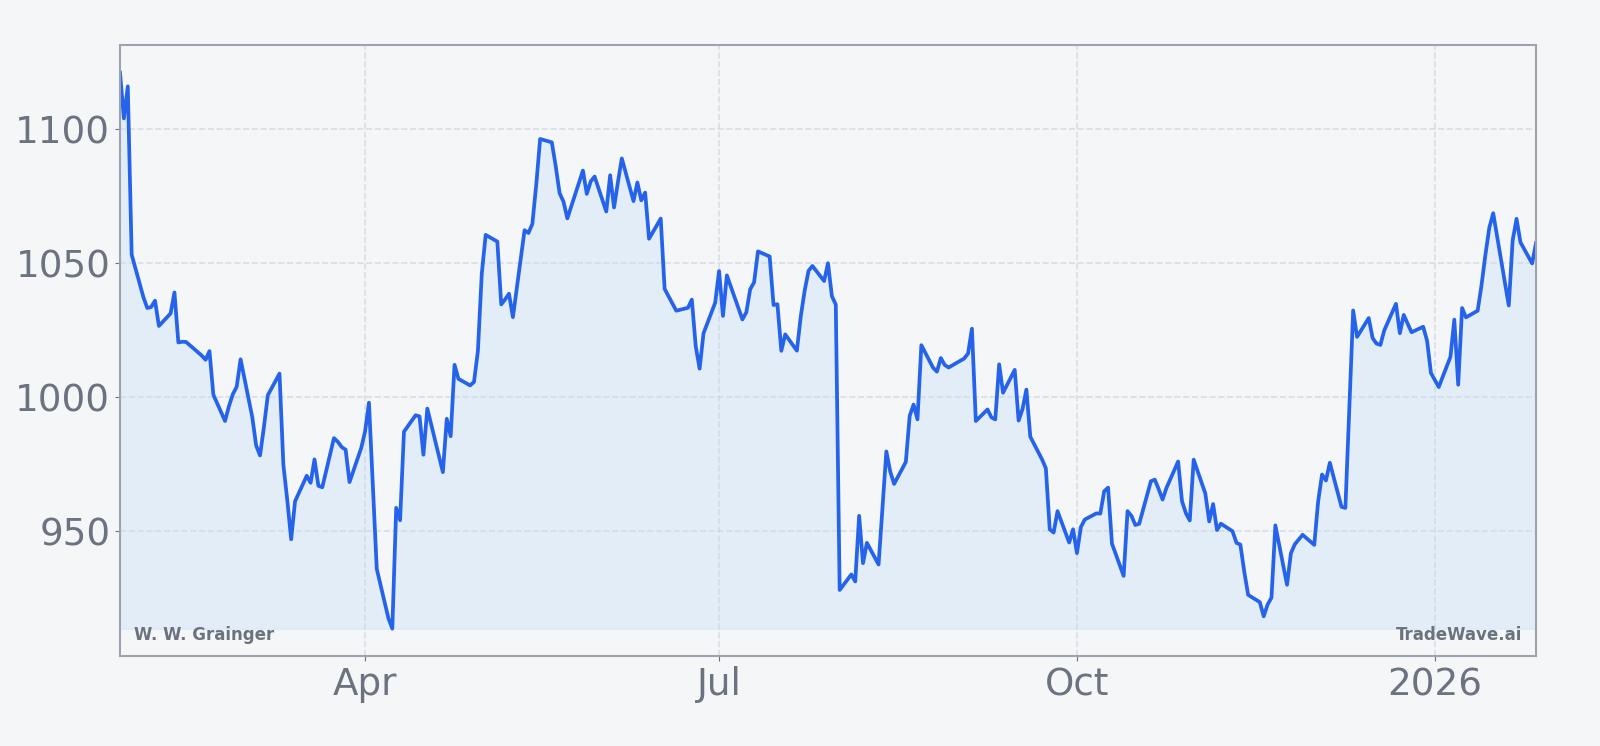
Although the recent news flow cited here centers on other companies, it highlights a market environment where technical levels such as 50-day moving averages and 52-week highs have been active reference points for traders.[9][11][12] For W. W. Grainger, which is sensitive to industrial spending and broader risk appetite, that context matters as the stock moves through a window that has historically rewarded long exposure but has also featured notable intraperiod volatility in several years.
Macro and policy backdrop
The current calendar phase is the midterm election year, which often brings a different mix of policy uncertainty and legislative activity compared with the presidential election year or the year before it. Historically, midterm years have seen debates over spending priorities, regulatory direction and, at times, shifts in expectations for interest rates, all of which can influence capital expenditure plans and maintenance budgets that feed into W. W. Grainger’s end markets.
In this framework, the 82-day window beginning Jan 28 sits in the early part of the midterm year, before the campaign season fully accelerates but after markets have had time to digest the first year of a presidential term. For industrial suppliers, that period can coincide with companies reassessing budgets, responding to any changes in tax or regulatory policy and adjusting to the prevailing rate environment, which in turn can affect order patterns and investor sentiment toward the sector.
Looking ahead, the transition from the midterm year into the year before the presidential election has historically been associated with a more constructive tone for risk assets in many cycles. The fact that W. W. Grainger’s current seasonal window bridges this midterm-year phase and leans toward the subsequent pre-election environment adds another layer to the pattern, suggesting that investors may be watching not only company fundamentals but also how the broader policy calendar evolves over the coming quarters.
What to watch
For this 82-day window, the key items to monitor are how W. W. Grainger trades around any upcoming macro data or policy headlines, whether the stock respects or challenges recent technical levels visible on the one-year chart, and how intraperiod swings compare with the historical pattern of sizable but ultimately recoverable drawdowns. A continuation of the long-term tendency toward positive outcomes would likely show up as a series of higher lows and constructive reactions to bouts of volatility, while a sharp and persistent break from that behavior would signal that this midterm-year window is diverging from its historical script.
Sources
- MarketBeat, “Goldbank Mining (CVE:GLB) Stock Price Down 1.1% - Here's Why,” Nov 9, 2025.
- MarketBeat, “Endeavour Silver (NYSE:EXK) Receives Sell (D-) Rating from Weiss Ratings,” Oct 25, 2025.
- MarketBeat, “Gateley (LON:GTLY) Shares Pass Below 50 Day Moving Average After Insider Selling,” Nov 2, 2025.
- Yahoo Finance, “Narwal Flow Debuts: Advanced Self-Clean Track-Mopping AI Robot Vacuum,” Aug 7, 2025.
- Seeking Alpha, “Woodward stock jumps after beating Q4 profit, revenue forecasts,” Nov 24, 2025.
- MarketBeat, “Gates Industrial (NYSE:GTES) Upgraded at Wells Fargo & Company,” Nov 16, 2025.
- MarketBeat, “Entree Gold (OTCMKTS:ERLFF) Trading Down 0.1% - What's Next?,” Jul 19, 2025.
- MarketBeat, “Murata Manufacturing (OTCMKTS:MRAAY) Shares Gap Up - Should You Buy?,” Jul 12, 2025.
- MarketBeat, “Global Self Storage (NASDAQ:SELF) Trading 4% Higher - Here's Why,” Dec 24, 2025.
- MarketBeat, “Ur-Energy (TSE:URE) Stock Passes Below 50-Day Moving Average - Should You Sell?,” Dec 11, 2025.
- MarketBeat, “Generation Mining (TSE:GENM) Hits New 52-Week High - Still a Buy?,” Dec 24, 2025.
- MarketBeat, “Murata Manufacturing (OTCMKTS:MRAAY) Shares Gap Down - Here's Why,” Jul 22, 2025.
- MarketBeat, “Murata Manufacturing (OTCMKTS:MRAAY) Shares Gap Up - Should You Buy?,” Jun 27, 2025.