Atmos Energy (ATO) Trades Near Highs as Investors Weigh Midterm-Year Policy Risk
Atmos Energy is approaching an 87-day midterm-election-year stretch that has delivered consistently positive returns in past cycles, even as the stock trades near recent highs and investors weigh the policy and rate backdrop.

Key takeaways
- Atmos Energy is heading into an 87-day seasonal window starting Feb 7 that has historically been strong during midterm election years.
- Across the last 8 comparable cycles, the pattern has been profitable in 100% of years, with 8 winners and 0 losers.
- Average profit in those winning years was 12.04%, with a cumulative gain of 147% over the sample.
- The window is aligned with a long trade direction, with a TradeWave Ratio of 2.83 and a Sharpe ratio of 2.71, indicating historically favorable risk-adjusted returns.
- Intraperiod swings have included meaningful drawdowns in some years, so adverse moves have been part of the path even when the final outcome was positive.
- The setup unfolds as the United States moves deeper into the midterm election year, when policy and rate expectations can amplify sector moves.
According to historical data from TradeWave.ai, this upcoming stretch for Atmos Energy sits inside a well-defined election-cycle pattern for the stock. The next section looks at how that seasonal backdrop has behaved in prior midterm election years and what it may signal about the risk profile of the months ahead.
Seasonal window
Grouping Atmos Energy’s performance by the presidential election cycle shows that the last 8 midterm election years have shared a distinct, historically strong pattern for the 87 trading days starting Feb 7. Today the stock closed at 165.73, edging down 0.16% on light volume, with limited context available on its 52-week range or year-to-date performance.[6]
Using the presidential election cycle as an organizing frame matters here because utility stocks often respond to shifts in regulation, infrastructure policy and rate expectations that tend to cluster around mid-cycle political debates. By isolating only midterm election years, the pattern focuses on periods when Washington’s agenda and investor positioning have historically looked most similar to the environment developing in 2026.
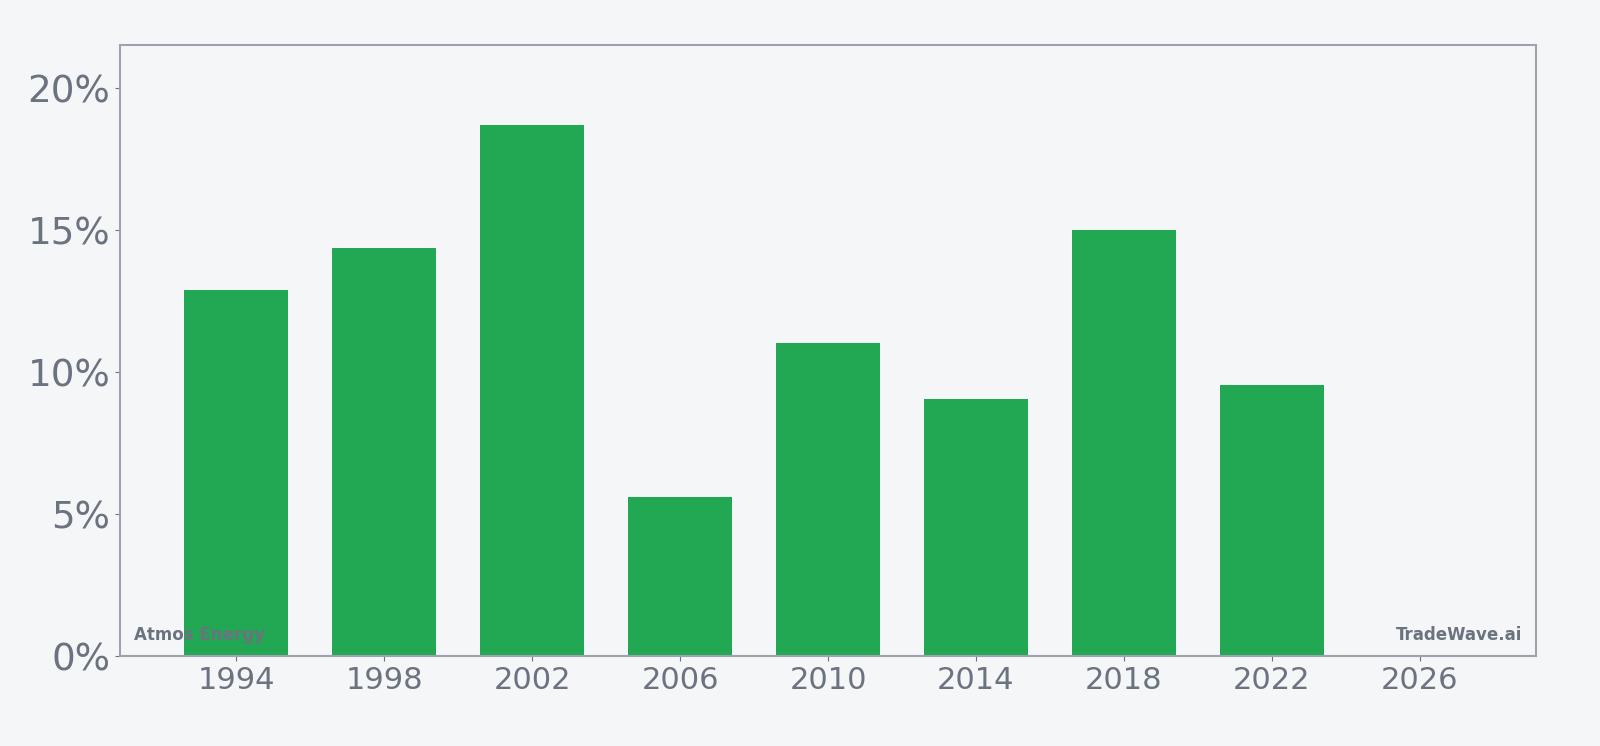
This seasonal window begins on 2026-02-07 and spans 87 days. Historically, during this period, Atmos Energy has shown a strong upside tendency aligned with a long trade direction. Across the last 8 midterm election years in this pattern, the stock finished higher in every case, producing a Percent Profitable reading of 100% with 8 winners and 0 losers. Average profit in those winning years was 12.04%, contributing to a cumulative gain of 147% over the sample.
The distribution of outcomes has been relatively tight for a directional pattern. The median profit of 11.96% sits close to the average, and the standard deviation of 4.09% suggests that most years clustered around a low double-digit gain rather than swinging between extremes. The Sharpe ratio of 2.71 indicates that, based on end-of-window results, the historical reward per unit of volatility has been high for this specific setup.
TradeWave Ratio (TWR) is defined as how far price typically travels in the trade direction within the window, independent of the final close. For this Atmos Energy pattern, the TradeWave Ratio of 2.83 points to meaningful intraperiod follow-through in the long direction, consistent with the idea that rallies during the window have often extended beyond the eventual closing gain before consolidating.
Looking at individual years highlights both the strength and the path. In 2002, for example, Atmos Energy gained 18.73% over the window, with a best point-to-peak move (maximum favorable excursion) of 22.79% and a modest worst drawdown (maximum adverse excursion) of 0.79% from the entry. By contrast, 2014 delivered a smaller net gain of 9.08% but saw a deeper intraperiod setback, with a worst drawdown of 6.21% before the stock recovered into the close.
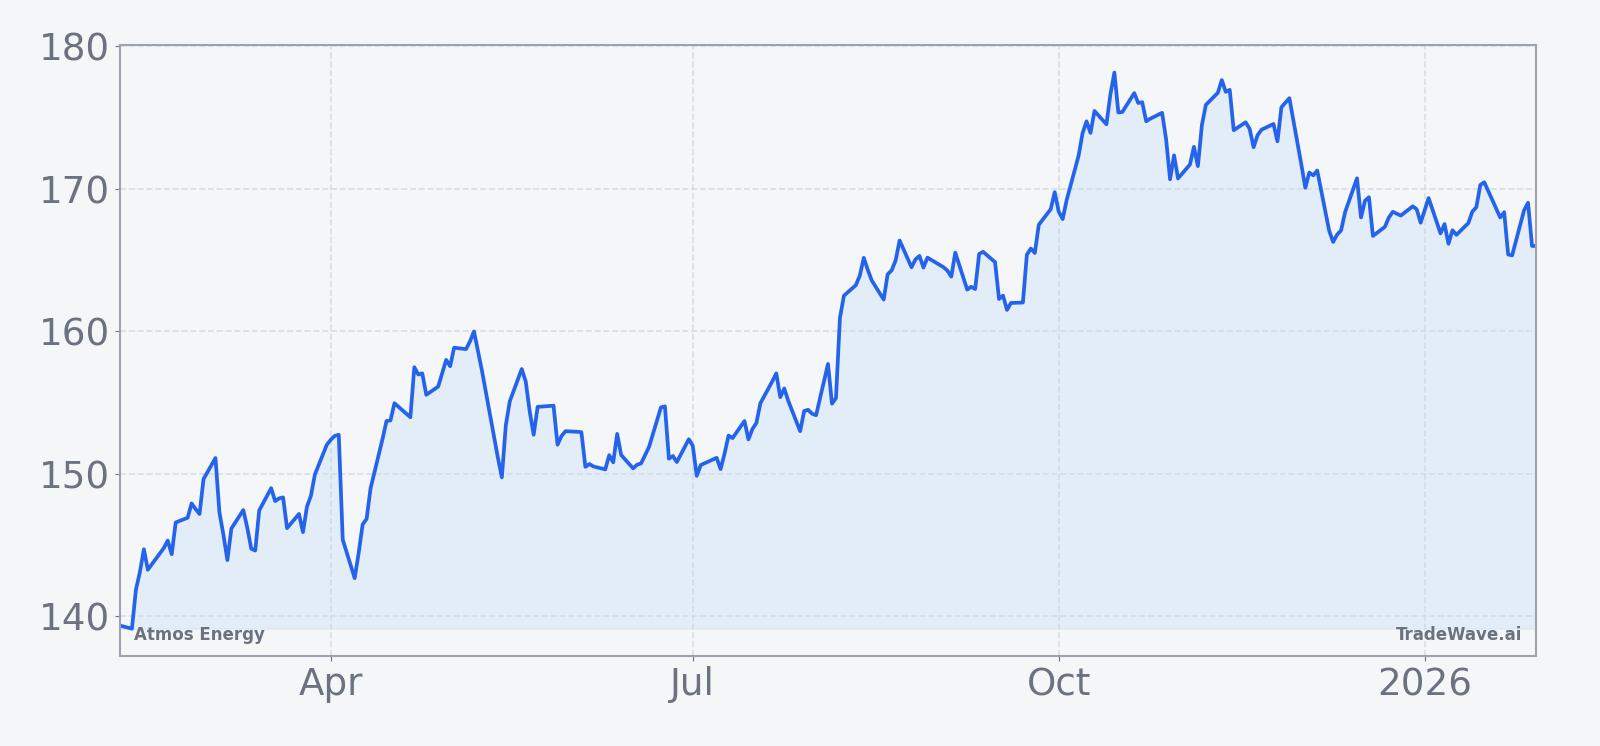
The historical seasonal trend chart for this window shows a generally upward-sloping average path, with gains tending to build steadily rather than arriving in a single burst. Early weeks often see a constructive but measured climb, followed by a more pronounced acceleration in the middle of the window and some tendency for consolidation toward the end as prior advances are digested.
The cumulative return profile across the eight midterm election years reinforces that impression. When returns are stacked year by year, the line rises in a relatively smooth fashion, with no losing years pulling the average back below zero at any point in the window. That consistency is unusual for a single-stock pattern and underscores how tightly clustered the outcomes have been in this particular phase of the election cycle.
Year-by-year net results and intraperiod swings help frame both upside potential and typical drawdowns.
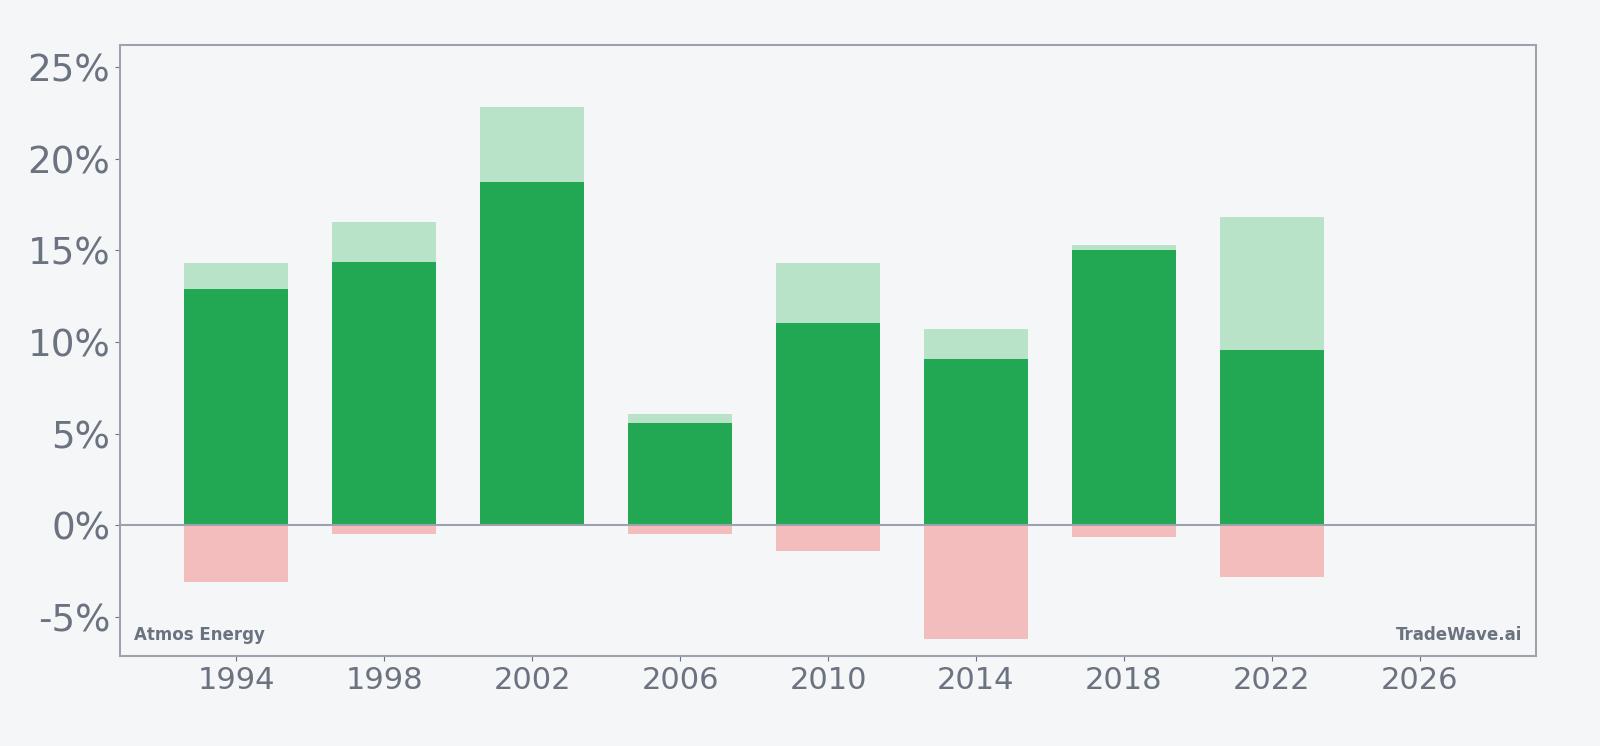
History does not guarantee future results; adverse excursions (MAE) can be large even in winning windows.
Price and near-term drivers
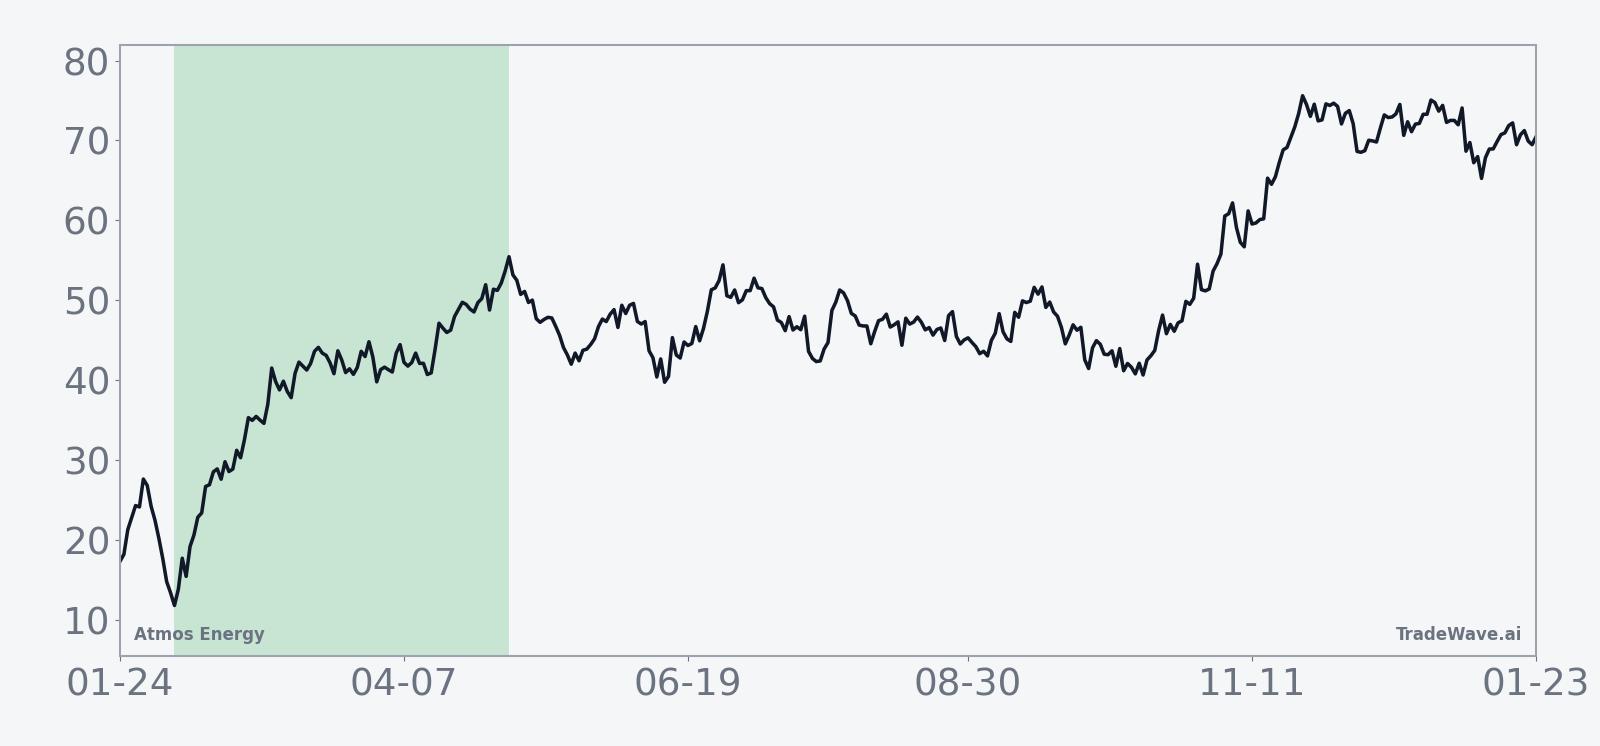
Atmos Energy shares finished Jan 30 at 165.73, slipping 0.27 points on the day as trading volume of 8,717 shares remained subdued relative to typical large-cap turnover.[6] With limited public data on its 52-week range, average volume or moving averages in the current snapshot, investors are largely left to infer positioning from the stock’s steady climb into early 2026 and the broader backdrop for regulated utilities.
The chart below situates the latest move in its recent multi-month context.
Macro and policy backdrop
While there is little Atmos-specific news in the latest data set, the stock trades against a backdrop where energy and resource names have periodically drawn attention. In December 2025, for example, MarketBeat highlighted new 52-week highs in Generation Mining, underscoring how investors have been willing to reward stable cash-flow stories in the broader resources space when fundamentals line up.[12] Earlier that month, MarketBeat also flagged institutional positioning shifts in HudBay Minerals, another reminder that capital has been rotating within the real-asset complex as investors reassess rate paths and commodity demand.[7]
For utilities such as Atmos Energy, the midterm election year can be particularly sensitive because regulatory agendas, infrastructure spending plans and rate-case expectations often become clearer as the political calendar advances. Although the sources here focus on other tickers, they collectively point to an environment where investors are paying close attention to balance-sheet strength, dividend durability and exposure to policy risk across energy and materials names.[2][5][13]
What to watch as the window opens
As the Feb 7 seasonal window approaches, traders and longer-term investors may focus on a few practical markers. First, price behavior in the opening weeks of the window will be important: in prior midterm election years, stronger outcomes often featured early and persistent follow-through in the trade direction, while choppier starts sometimes preceded deeper intraperiod drawdowns before the stock recovered. Second, any updates on regulatory proceedings, capital spending plans or rate-case outcomes could interact with the historical pattern by either reinforcing or offsetting the typical mid-cycle tailwind for regulated utilities.
Third, the broader policy calendar bears watching. Midterm election years frequently bring heightened debate over energy infrastructure, environmental rules and fiscal priorities, all of which can influence sentiment toward gas distribution companies such as Atmos Energy.[13] If the stock holds its recent gains and responds constructively to any policy or rate headlines during the 87-day window, that would be consistent with the historical pattern of steady, low double-digit advances. Conversely, a failure to participate in any broader utility or energy strength, or an unusually deep drawdown relative to past midterm-year experience, would signal that other forces are overwhelming the seasonal tendency.
Taken together, the historical pattern defines the quantitative seasonal backdrop for the current period. The next several months will show whether Atmos Energy’s price action in this midterm election year continues to rhyme with its past election-cycle behavior or carves out a different path.
Sources
- MarketBeat, "Andrada Mining (LON:ATM) Releases Earnings Results," Nov 28, 2025.
- CNBC, "Top Wall Street analysts are upbeat on these 3 dividend-paying stocks," Oct 19, 2025.
- MarketBeat, "JPMorgan Chase & Co. Issues Positive Forecast for Antofagasta (LON:ANTO) Stock Price," Oct 11, 2025.
- MarketBeat, "Atria Investments Inc Purchases Shares of 5,272 Modine Manufacturing Company $MOD," Nov 10, 2025.
- Seeking Alpha, "Exxon Mobil Q3: Guyana, Permian, And Capital Strength Confirm A Bullish Breakout (XOM)," Nov 5, 2025.
- CNBC, "Check out AOT Software Platform ETF's stock price (AOTS) in real time," Dec 27, 2025.
- MarketBeat, "HudBay Minerals Inc $HBM Stock Holdings Raised by Franklin Resources Inc.," Dec 1, 2025.
- MarketBeat, "Andrada Mining (LON:ATM) Trading Up 8.2% - Here's Why," Nov 22, 2025.
- MarketBeat, "Andrada Mining (LON:ATM) Trading Down 2.8% - What's Next?," Dec 19, 2025.
- MarketBeat, "Andrada Mining (LON:ATM) Trading Down 8.4% - Time to Sell?," Jan 16, 2026.
- MarketBeat, "Generation Mining (TSE:GENM) Hits New 52-Week High - Still a Buy?," Dec 24, 2025.
- Bloomberg, "Winter Finally Gives US Natural Gas Room to Run," Feb 25, 2025.