Pulte Homes (PHM) Jumps Nearly 12% After Earnings Beat Despite Softer Closings
Pulte Homes has entered a midterm-election-year stretch that has historically favored downside in the stock, even as shares hold near recent highs and homebuilding demand faces pressure from cautious buyers.

Key takeaways
- Pulte Homes has just moved into a 236-day seasonal window that aligns with the last 10 midterm election years and has historically favored a short, or bearish, trade direction.
- Across those 10 midterm-year windows, the pattern shows a 100% success rate for the short side, with 10 winners and 0 losers and an average profit of 19.78% in the trade direction.
- The TradeWave Ratio of 2.34 indicates that price has typically traveled meaningfully in the trade direction within the window, independent of where it finished.
- Individual years have seen sizable swings, with historical best-case rallies and worst-case drawdowns inside the window pointing to elevated volatility around the prevailing trend.
- The window begins as Pulte Homes trades at about $142.60 following a profit decline tied to softer homebuyer demand and weaker consumer sentiment.
- Investors will be watching how policy, rates and housing affordability evolve through this midterm-election-year stretch, given the stock’s tendency to weaken during similar phases in prior cycles.
According to historical data from TradeWave.ai, this midterm-election-year window for Pulte Homes has shown a distinct directional bias in past cycles, providing a quantitative backdrop for the months ahead.
Seasonal window
This seasonal window is currently underway, spanning 236 trading days from Feb 18, 2026, and has historically been a weak stretch for Pulte Homes when viewed through a short trade lens. Today the stock closed at $142.60, up 0.7% on the session, leaving it elevated after a strong multi-year run even as the broader housing backdrop has turned more challenging for builders.[2]
Because this analysis groups only the last 10 midterm election years, it is designed to capture how Pulte Homes has behaved when policy, rates and fiscal debates tend to sit in the middle of a presidential cycle rather than at its beginning or end. Midterm years often coincide with shifting expectations around regulation, housing incentives and infrastructure spending, all of which can influence homebuilder margins and order trends in ways that differ from election years or the year before an election.
This seasonal window begins on 2026-02-18 and spans 236 days. Historically, during this period, Pulte Homes has shown a strong tendency to move lower, with the pattern defined as a short trade across the last 10 midterm election years. The historical stats show a 100% Percent Profitable outcome for the short side, with 10 winners and 0 losers, meaning that in each of those midterm-year windows the stock finished the period below its starting level in terms of the short trade’s net return. The average profit in those winning short trades was 19.78%, which reflects the typical magnitude of decline captured by the pattern when it worked in the intended direction.
Because all years in this sample were profitable for the short side, the average profit across all years is effectively the same as the average profit in winners, and there is no separate average loss figure to dilute the result. The Sharpe ratio of 1.93 indicates that, based on end-of-window outcomes, the risk-adjusted return for this short pattern has been relatively strong compared with its volatility. The TradeWave Ratio of 2.34 measures how far price has typically traveled in the trade direction within the window, regardless of where it ultimately closed, underscoring that intraperiod swings have often been meaningful even when the final net move was smaller.
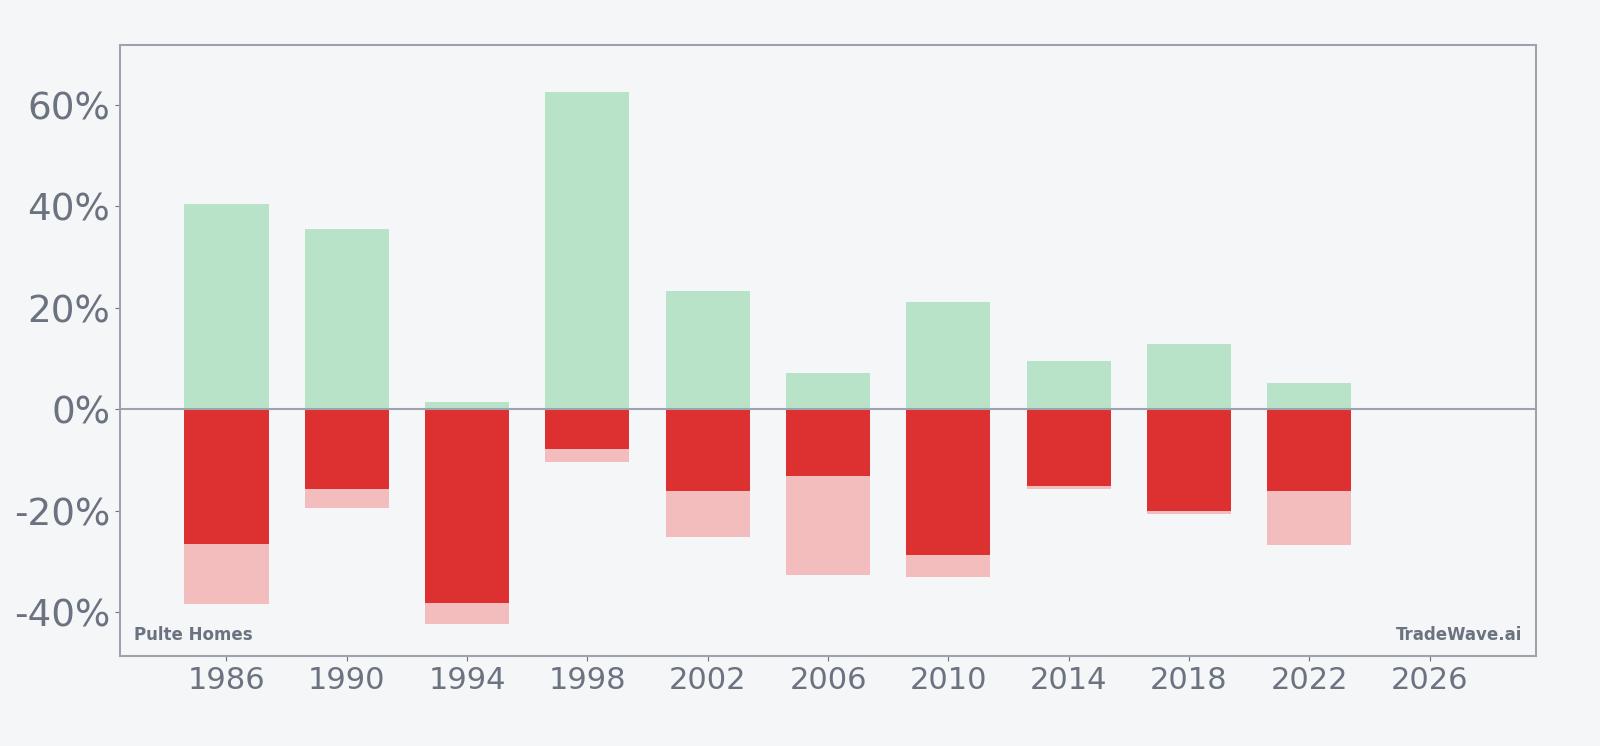
Looking at individual years, the weakest outcome for Pulte Homes in this window came in 1994, when the short pattern recorded a net return of -38.10% for the stock, meaning that year was particularly favorable for the short side as the share price fell sharply from entry to exit. By contrast, 1998 was the least favorable year for the pattern, with a net return of -7.86%, still a winning outcome for the short trade but with a more modest decline from entry to exit. These bookends highlight that while the direction has been consistent, the depth of the move has varied across cycles.
The intraperiod behavior has also been volatile. In 1986, for example, the best point-to-peak move within the window, known as the maximum favorable excursion, reached 40.34%, while the worst drawdown from entry, or maximum adverse excursion, was -38.36%, illustrating that the stock experienced both large rallies and deep pullbacks before ultimately finishing lower. In 2010, the pattern saw a net return of -28.72% for the stock, with a maximum adverse excursion of -32.99%, again showing that even in years where the short side ultimately benefited, there were sizable countertrend moves along the way.
On average, the seasonal trend chart for this window shows Pulte Homes tending to weaken over the course of the 236 trading days, with the bulk of the downside accruing gradually rather than in a single sharp break. The historical seasonal average suggests that the stock has often experienced choppy trading early in the window, followed by more persistent pressure later in the period as midterm-year policy debates and macro conditions evolve.
The cumulative return profile across the last 10 midterm election years reinforces this picture, with the average path sloping steadily in favor of the short side and relatively few instances of sustained countertrend rallies that fully reverse the pattern. While individual years have deviated from the average, the clustering of negative net returns for the stock within this specific election-cycle phase stands out compared with more mixed behavior in other parts of the four-year cycle.

A second view combines yearly net results with the best and worst intraperiod swings to show how far Pulte Homes has tended to move in both directions during this window.
History does not guarantee future results, and past windows show that adverse excursions can be large even in years that ultimately finish in line with the pattern.
Taken together, the historical pattern defines the quantitative seasonal backdrop for the current period.
Price and near-term drivers
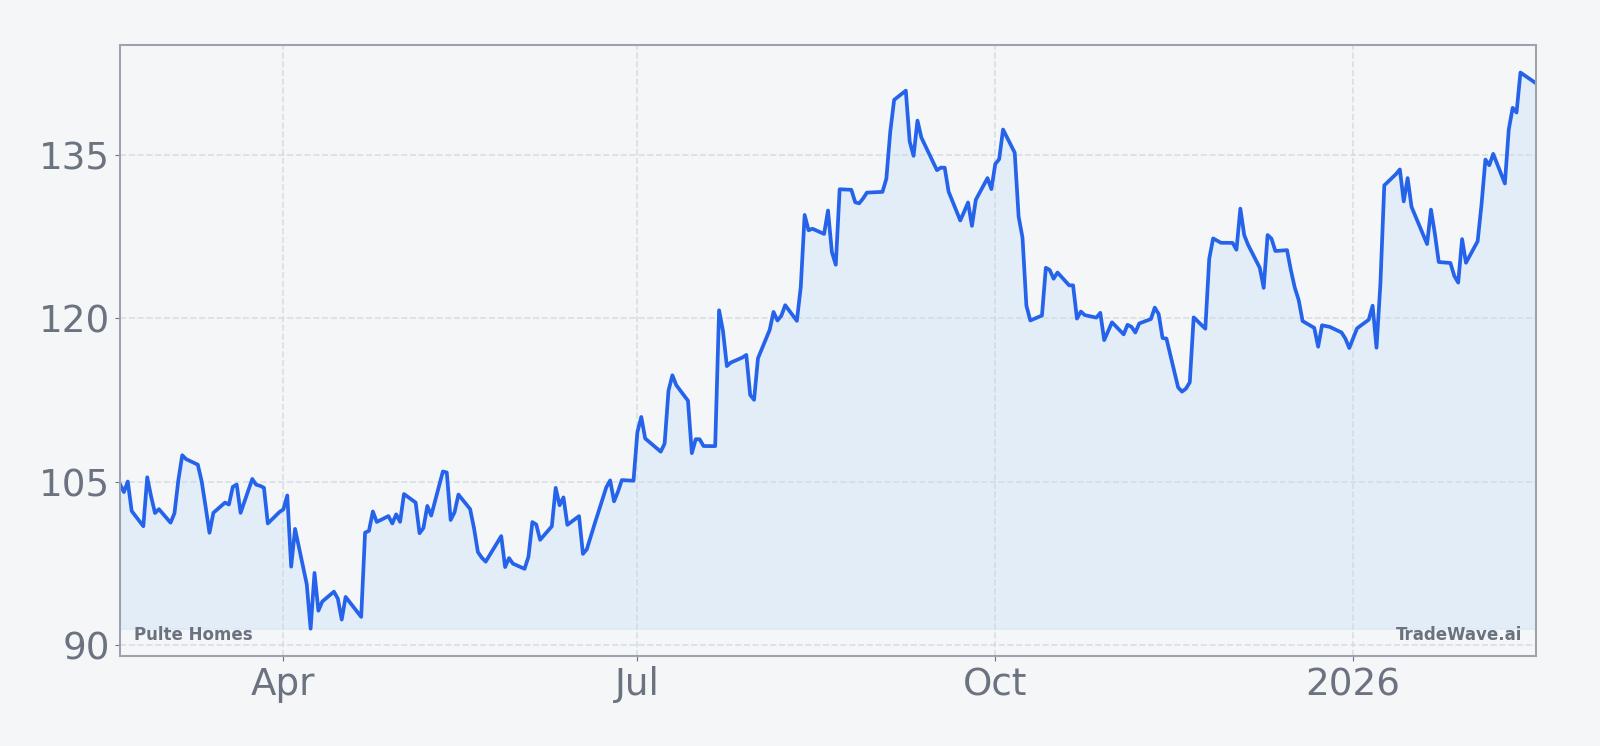
Pulte Homes ended Wednesday’s session at $142.60, gaining 0.7% on the day as the stock continued to trade near the upper end of its recent range despite a softer fundamental backdrop for homebuilders.[2] The move comes in the wake of the company’s Jan 29 earnings report for the fourth quarter of 2025, which showed profit declining as weak consumer sentiment weighed on homebuying demand and closings slipped 3% to 7,821 homes, with home sale gross margin narrowing to 24.7% from 27.5% a year earlier.[2]
The latest results underscored the tension facing the sector: mortgage rates have eased from their peaks, but affordability remains stretched for many buyers, and sentiment has been slow to recover. In its coverage of the quarter, The Wall Street Journal reported that PulteGroup’s profit drop reflected cautious consumers and a more competitive pricing environment, even as the builder continued to work through a solid backlog of orders.[2] That combination has left investors weighing whether the stock’s strong multi-year performance already discounts a normalization in margins and volumes or whether further pressure could emerge if demand softens again.
Sector-wide, homebuilders have been navigating a landscape where lower rates offer some relief but do not fully offset affordability challenges tied to elevated home prices and broader economic uncertainty. The sector commentary in the same reporting highlighted that weak consumer sentiment and affordability issues continue to impact homebuyer demand despite the rate backdrop, suggesting that pricing power may be more limited than in the immediate post-pandemic period.[2] For Pulte Homes, which has significant exposure to entry-level and move-up buyers, shifts in sentiment and credit conditions can quickly translate into changes in order trends and incentives.
The chart below situates the latest move in its recent multi-month context.
Macro and political backdrop
The current midterm election year adds another layer to the outlook for Pulte Homes, as housing policy, fiscal priorities and regulatory debates often come to the fore in the middle of a presidential cycle. While the specific policy path for 2026 will depend on negotiations in Washington, midterm years have historically featured uncertainty around tax policy, infrastructure spending and housing-related incentives, all of which can influence builder sentiment and capital allocation decisions.
For homebuilders, shifts in expectations around government support for housing supply, zoning reform or first-time buyer programs can affect both demand and the cost side of the equation. At the same time, the Federal Reserve’s stance on interest rates and inflation remains central to the sector’s performance, as mortgage costs directly shape affordability. The combination of a mid-cycle policy debate and a still-evolving rate environment helps explain why grouping seasonal behavior by presidential election phase can be informative for a stock like Pulte Homes, which sits at the intersection of macro, policy and consumer confidence.
What to watch
For investors tracking this 236-day window, the key question is how Pulte Homes trades relative to its historical midterm-year pattern. Sustained weakness from current levels, particularly if accompanied by softer order trends or further margin compression, would be consistent with the short-biased seasonal backdrop. By contrast, a durable break higher that holds through typical volatility would mark a departure from the last 10 midterm election years and could signal that structural drivers, such as a more supportive policy stance or a stronger-than-expected housing recovery, are overpowering the historical tendency.
Several catalysts will be in focus. Upcoming macro data on inflation, employment and housing starts will shape expectations for the Fed’s rate path and, by extension, mortgage costs and affordability. Any policy proposals around housing supply, tax credits or infrastructure in the run-up to the midterm elections could also influence sentiment toward homebuilders, especially if they materially change the demand outlook for new homes. Within the stock, traders will be watching how Pulte Homes behaves around key technical levels highlighted in the recent price chart, including whether pullbacks during this window resemble the deeper drawdowns seen in prior midterm years or remain more contained.
Ultimately, the historical pattern does not dictate outcomes, but it does frame a period in which Pulte Homes has repeatedly shown a tendency to weaken during midterm election years. How the stock responds to the evolving mix of rates, policy and housing demand over the coming months will determine whether this cycle rhymes with the past or breaks from it.