Rising Data Center Power Needs Seen as Long-Term Tailwind for WEC Energy Group (WEC)
WEC Energy Group is approaching a long midterm-election-year seasonal stretch that has delivered robust gains in past cycles, as utilities navigate surging power demand tied to AI and data centers.

Key takeaways
- WEC Energy Group is set to enter a 316-day seasonal window on Feb 23 that aligns with the last 10 midterm election years and has historically favored the long side.
- Across those midterm-year windows, WEC posted gains in 100% of cases, with 10 winners and 0 losers and an average profit of 16.89%.
- The pattern shows a cumulative return of 371% over the sample, with a Sharpe ratio of 2.49 and a TradeWave Ratio of 2.3, indicating strong risk-adjusted and directional behavior.
- Intraperiod swings have been meaningful, with some years showing double-digit peak run-ups and notable drawdowns before finishing higher.
- The setup arrives as WEC trades around $114 and utilities position for structurally higher electricity demand from AI and data center buildouts.[1]
According to historical data from TradeWave.ai, WEC Energy Group’s behavior in past midterm election years has followed a distinct long-biased pattern that differs from its performance in other parts of the presidential cycle.
Seasonal window
This seasonal window begins on Feb 23, 2026 and spans 316 trading days. Historically, during this period, WEC Energy Group has shown a strong upward tendency in midterm election years, with the stock closing higher in every one of the last 10 such cycles. At today’s close of $114.34, investors are looking at that history against a backdrop where traditional valuation and yield metrics share the stage with structural demand stories tied to power-hungry technologies.[1]
Because this analysis groups only the last 10 midterm election years, it isolates how WEC has behaved in a specific policy and macro backdrop rather than averaging across unrelated parts of the presidential cycle. Midterm years often feature regulatory noise and shifting expectations for infrastructure and energy policy, which can matter for a regulated utility’s capital plans and allowed returns.
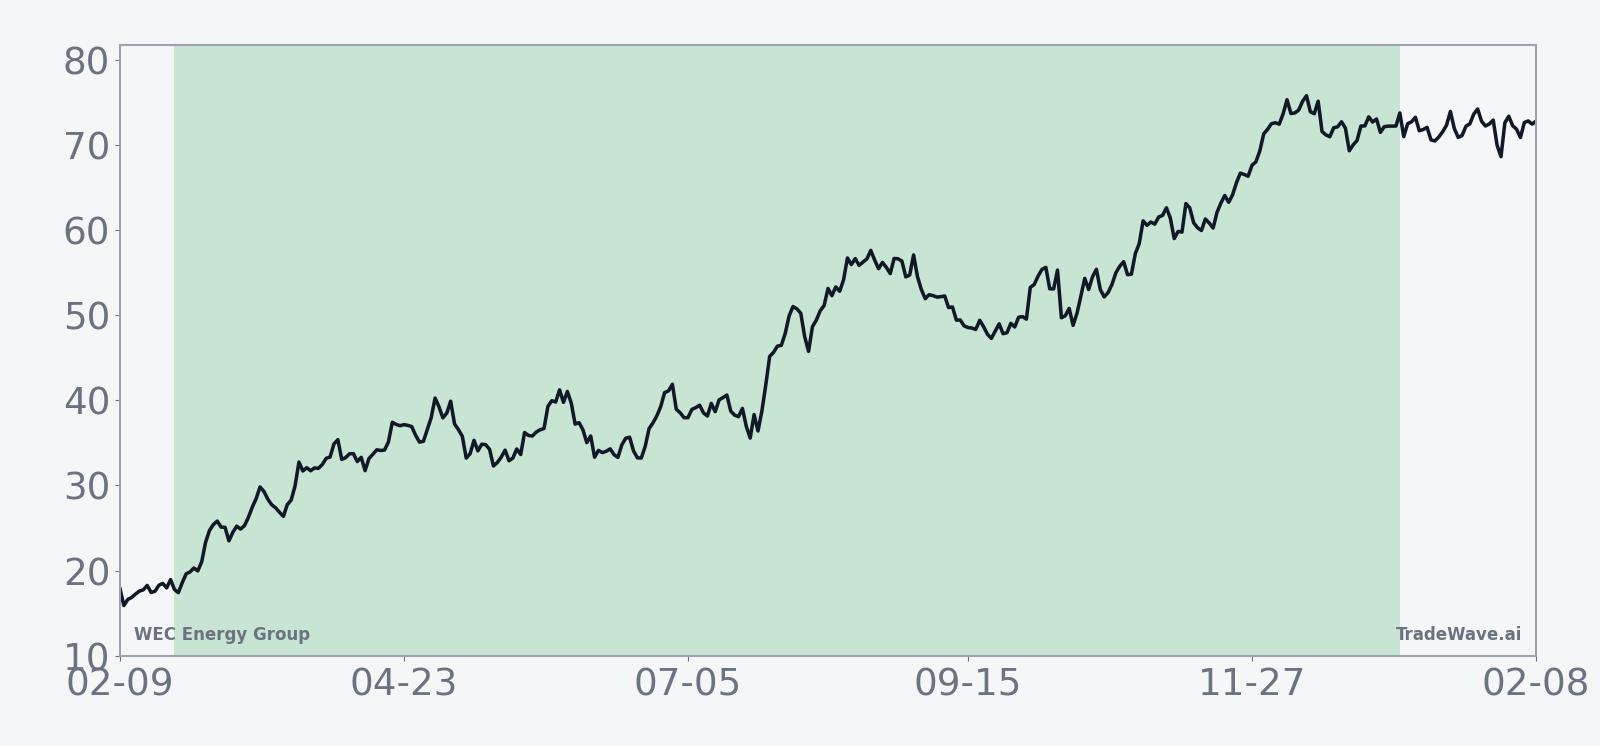
The historical seasonal trend line for this window slopes steadily higher, suggesting that gains have tended to accrue over much of the period rather than arriving in a single short burst. With 80% of the pattern’s internal trend signals pointing long and only 20% short, and an even stronger 90% long bias in the shorter-term trend view, the profile has favored persistent upside rather than choppy mean reversion.
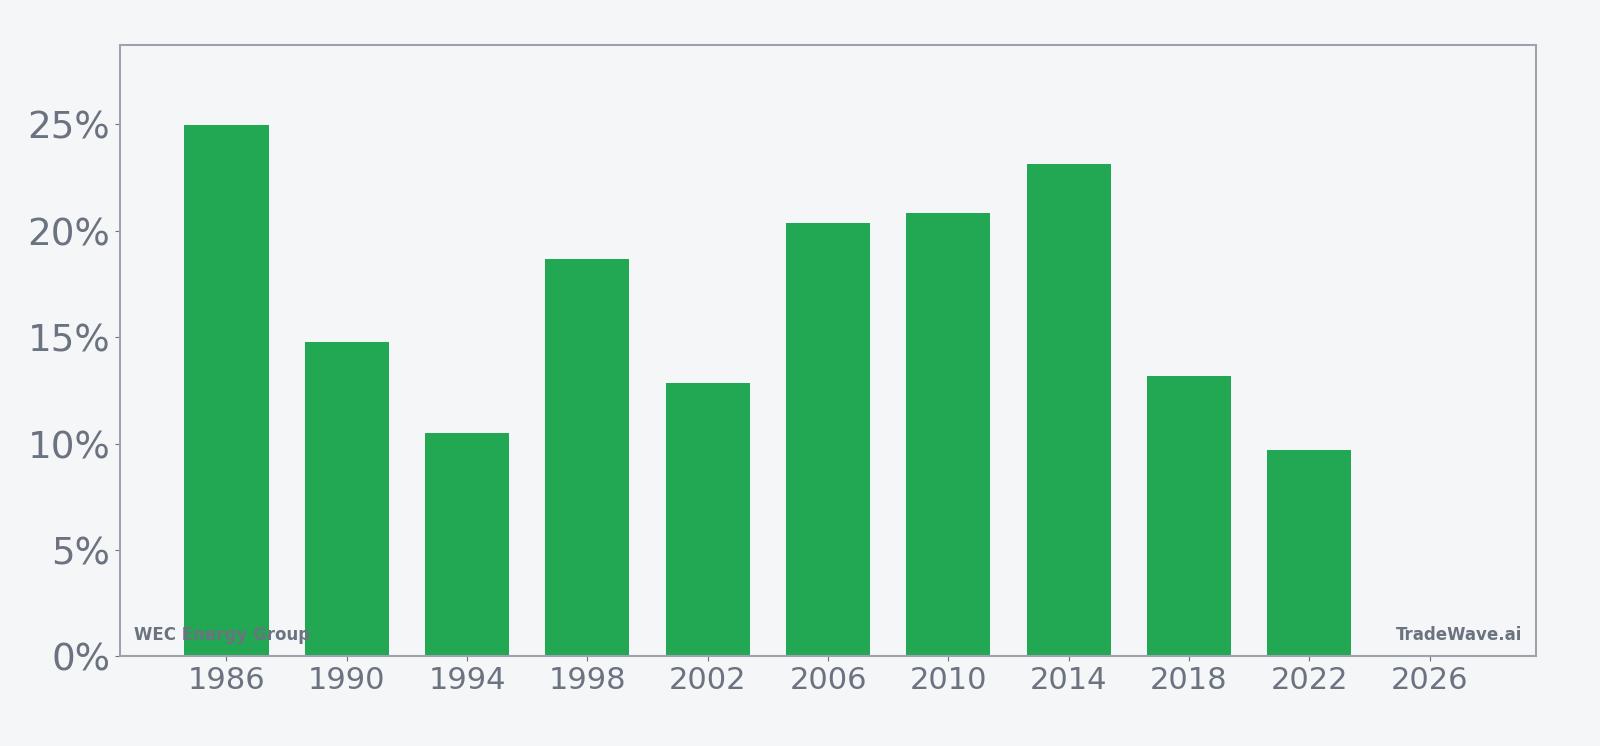
Year-by-year bars that combine net results with peak run-ups and worst drawdowns help clarify how that upside has interacted with risk.
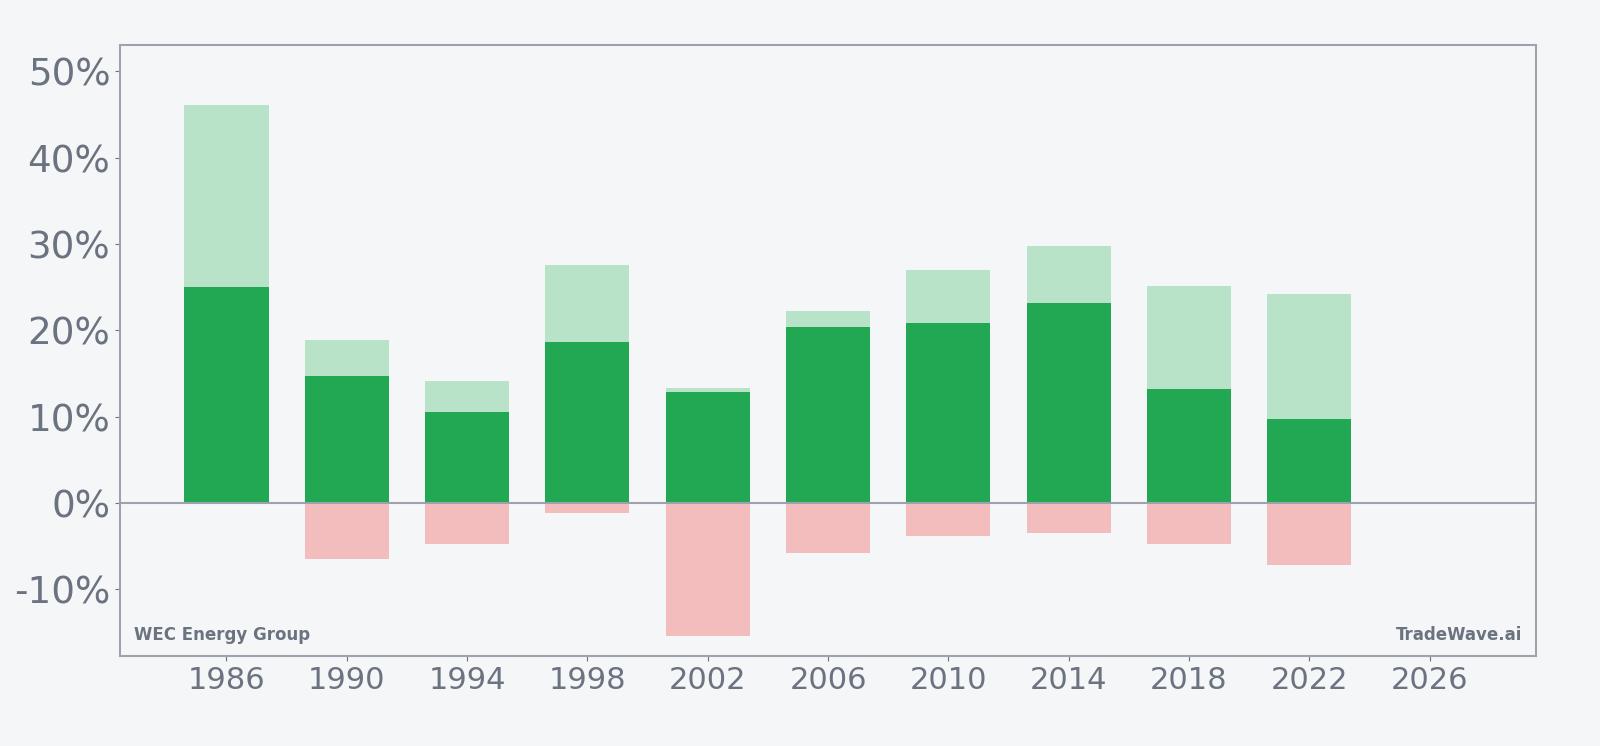
Across the 10 midterm-year samples, WEC’s average profit of 16.89% reflects a cluster of double-digit gains, with individual years such as 2010 and 2014 posting net returns above 20%. At the same time, the maximum favorable move in strong years has often run well ahead of the final close, with peak run-ups above 25% in 2010, 2014 and 2018, while the worst intraperiod drawdowns have ranged from negligible in 1986 to mid-teens in 2002, underscoring that even winning windows have included uncomfortable pullbacks.
For example, in 2002 the stock finished the window up 12.85%, yet the worst drawdown from entry reached 15.47% before recovering, while in 2018 WEC ultimately gained 13.17% after experiencing a maximum adverse move of 4.74%. That combination of sizable maximum favorable excursions and sometimes sharp maximum adverse excursions is consistent with the pattern’s TradeWave Ratio of 2.3 and Sharpe ratio of 2.49, which together describe a window where upside has historically dominated but volatility has not been trivial.
History does not guarantee future results, and even in windows where every past year finished higher, adverse excursions can be large enough to challenge risk tolerance before the pattern plays out.
Taken together, the historical pattern defines the quantitative seasonal backdrop for the current period as WEC moves from the early part of the midterm election year toward the pre-election year, a transition that has previously aligned with sustained gains for the stock in this specific window.
Price and near-term drivers
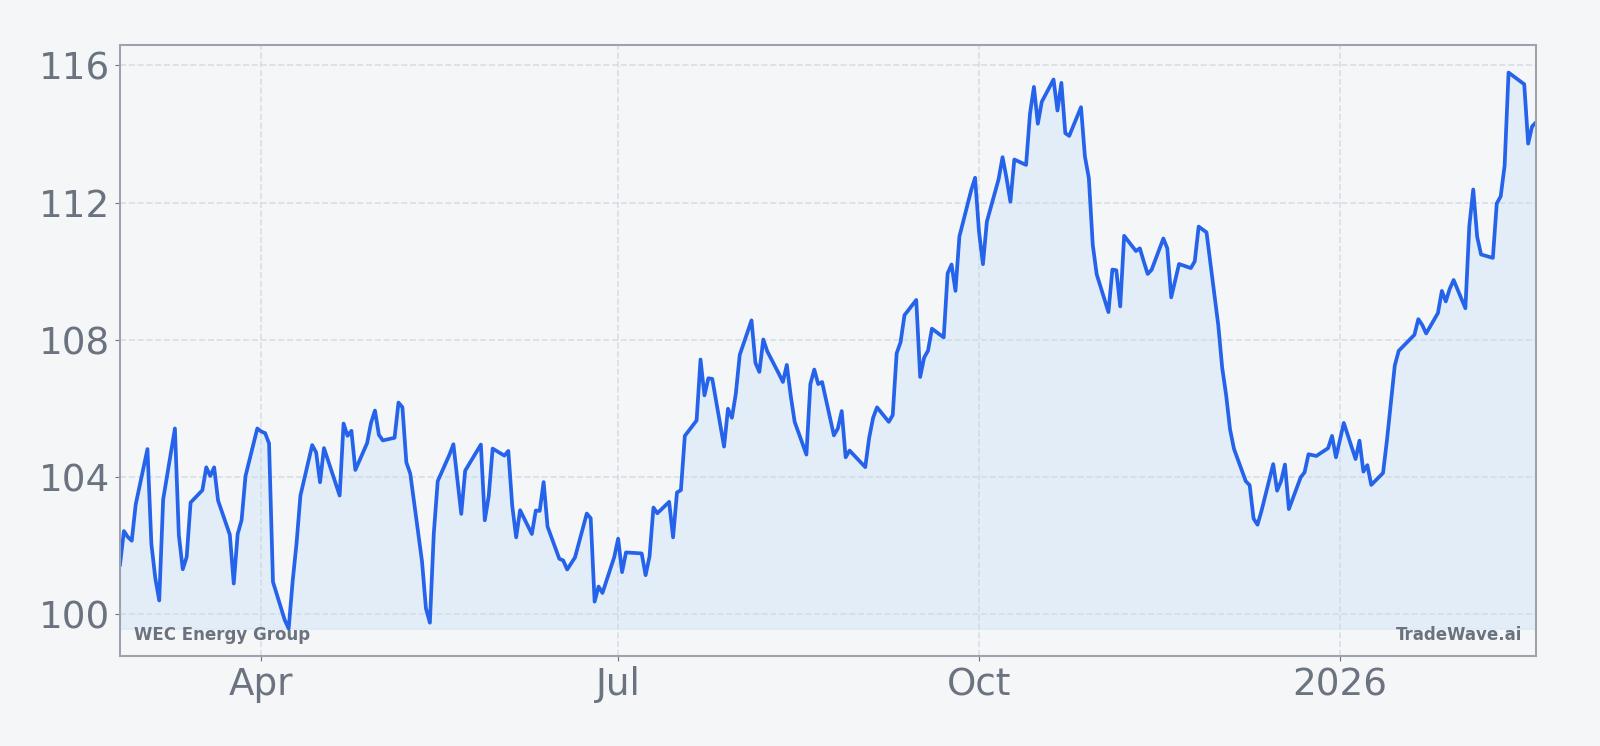
WEC Energy Group shares closed at $114.34 on Feb 21, up 0.12 on the day, leaving the stock modestly higher in recent weeks but without a clear year-to-date performance marker in the available data. The latest move comes as investors weigh traditional utility considerations such as rate cases and balance sheet strength against a shifting demand outlook tied to power-intensive technologies.
The chart below situates the latest move in its recent multi-month context.
Macro and policy backdrop
In Nov 2025, analysts highlighted how data centers are reshaping electricity demand, with utilities such as WEC, AEP, EVRG and PNW cited as potential beneficiaries of rising load from AI and cloud infrastructure.[1] That commentary framed a world in which electric demand is growing at its fastest pace since the 1960s and 1970s, with capacity projected to triple as hyperscale data centers, industrial reshoring and electrification trends converge.
For WEC, which operates regulated utilities in the Upper Midwest, that backdrop can translate into larger capital expenditure plans, expanded rate bases and a more visible earnings runway, subject to regulatory approval and execution risk.[1] Sector analysts have argued that utilities positioned near major data center clusters or industrial corridors may see above-trend load growth, even as they manage the challenges of grid upgrades, interconnection queues and decarbonization targets.[1]
Within the presidential election cycle, the midterm year often brings policy uncertainty around energy regulation, environmental standards and infrastructure funding, while the subsequent pre-election year has historically leaned more supportive for risk assets as fiscal and regulatory stances stabilize. For a regulated utility, that two-step pattern can influence the timing of rate decisions, project approvals and investor appetite for defensive yield versus growth stories.
What to watch as the window opens
As WEC approaches the Feb 23 start of its 316-day seasonal window, traders and longer-term investors will be watching how the stock behaves relative to the historical pattern of steady, long-biased gains with intermittent drawdowns. One focal point will be whether early-year volatility in the broader market or in utilities specifically produces the kind of mid-single to mid-teens intraperiod pullbacks that have appeared in prior midterm-year windows before the stock ultimately advanced.
On the fundamental side, developments around data center and industrial load growth in WEC’s service territory will remain central, including any updates on long-term power contracts, grid investment plans or regulatory feedback on large capital projects.[1] Evidence that demand from AI and cloud infrastructure is tracking or exceeding expectations would align with the historical pattern’s tendency for sizable maximum favorable moves, while disappointments or delays could test the resilience seen in past cycles.
Investors may also track how the policy calendar evolves as the midterm election year progresses toward the pre-election year, particularly around federal and state energy policy, environmental rules and incentives for grid modernization. A backdrop that supports capital deployment and cost recovery could help the stock follow its historical seasonal path, whereas a more contentious regulatory environment might amplify the kind of adverse excursions that have occasionally marked this window.
Ultimately, the upcoming 316-day stretch provides a structured historical lens on WEC’s potential risk and reward profile as the company navigates a rare combination of defensive utility characteristics and secular growth in electricity demand. How the stock trades inside that window will show whether this midterm-to-pre-election pattern continues to hold or begins to shift in the face of a changing power landscape.