Election-Year Policy Uncertainty Keeps Flowserve (FLS) Rangebound Near 52-Week Highs
Flowserve is moving through an 83-day midterm-election-year stretch that has historically delivered consistent gains, even as the stock consolidates after a strong run.

Key takeaways
- Flowserve is in an 83-day seasonal window that begins on Jan 27 and has historically been a strong period for the stock in midterm election years.
- The pattern is long-directed, with a 100% Percent Profitable record across 9 winning years and 0 losing years in the lookback.
- Average profit across those years is 16.94%, with a median gain of 15.83%, pointing to a consistently positive skew.
- The TradeWave Ratio of 2.15 suggests price has typically traveled meaningfully in the trade direction within the window, independent of the final close.
- Historical best and worst intraperiod moves show that while upside has often been substantial, adverse swings have also occurred, especially in more volatile years like 2018 and 2022.
- The window is defined across the last 9 midterm election years, tying Flowserve’s pattern to the policy and spending backdrop typical of that phase in the presidential cycle.
According to historical data from TradeWave.ai, this part of the calendar has shown a distinct seasonal bias for Flowserve in past midterm election years, and the current window offers a live test of that pattern.
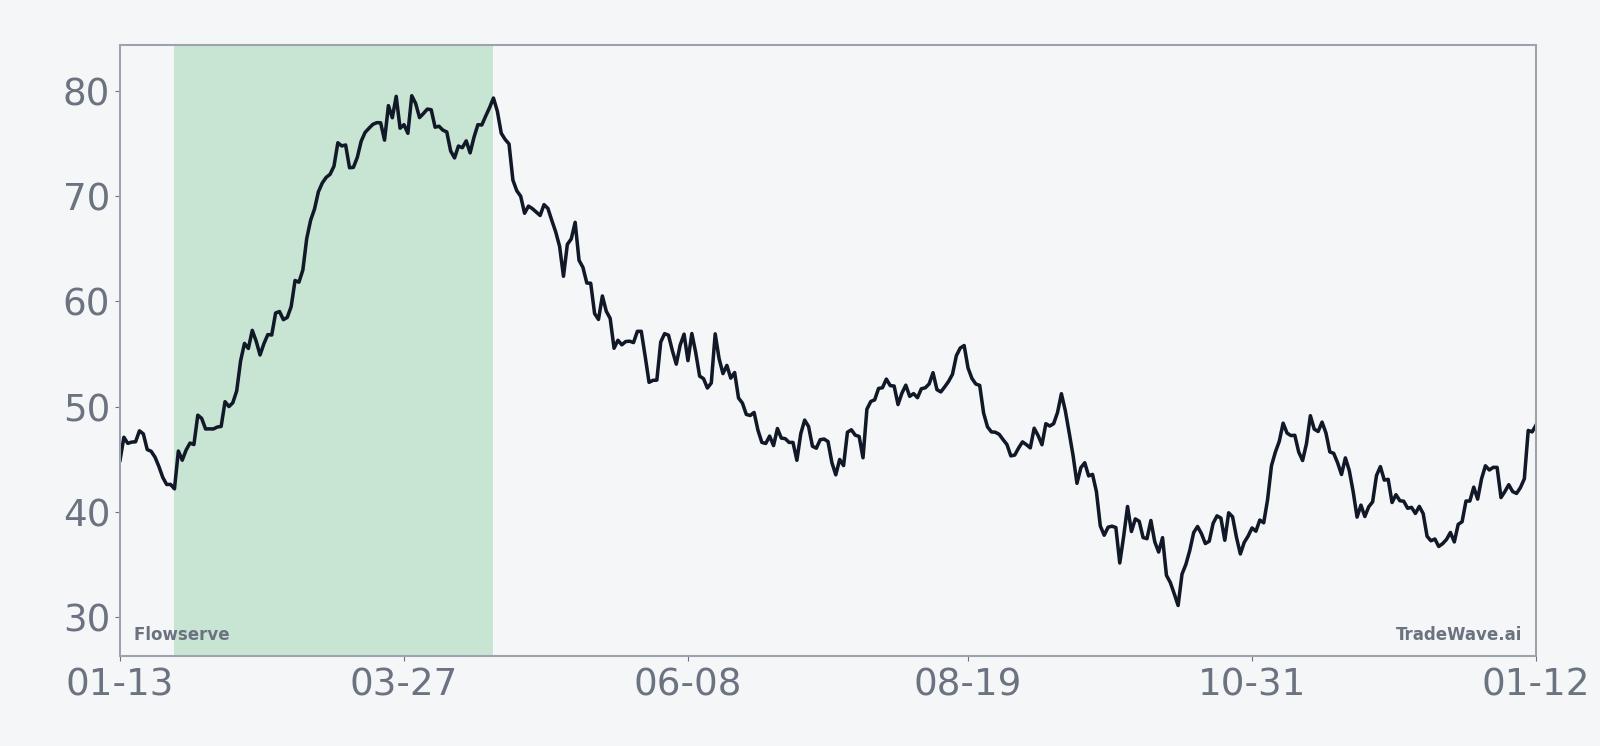
Seasonal window
This seasonal window is currently underway, spanning 83 days from Jan 27, 2026, and has historically been a strong stretch for Flowserve in midterm election years. The stock last closed at $88.38, slipping 0.3% on the day as it trades near the upper end of its 12‑month range without a clear year-to-date reference point from public data.[5] With no single recent catalyst dominating the tape, the focus turns to how closely the stock tracks its established election-cycle pattern through the rest of this window.
Grouping performance by the presidential election cycle matters here because midterm years often feature a different mix of policy uncertainty, infrastructure and industrial spending, and rate expectations than other phases. For capital-goods names like Flowserve, that backdrop can shape order timing and investor risk appetite in ways that repeat from one midterm year to the next, even when the broader macro narrative changes.
This seasonal window begins on 2026-01-27 and spans 83 days. Historically, during this period, Flowserve has shown a strong directional tendency in the long direction, with all observed midterm-year instances finishing higher over the window. The pattern is explicitly long, meaning favorable years are those in which the stock advanced over the full span, while any deep drawdowns or reversals within the window would have been unfavorable for the strategy even if they later recovered.
Across the last 9 midterm election years in the dataset, Flowserve has recorded a 100% Percent Profitable outcome, with 9 winners and 0 losers. Average profit across those years is 16.94%, while the median gain of 15.83% suggests that results have clustered around mid‑teens returns rather than being driven solely by outliers. Because there are no losing years in this sample, the all-years average is effectively the same as the average winner, reinforcing the impression of a consistently positive window.
Looking at individual years, the strongest outcome in the sample came in 2002, when Flowserve gained 31.02% over the window, while 2018 marked the softest gain at 5.48%. In 2010 the stock advanced 20.0% across the same calendar span, and in 2022 it rose 15.83%, underscoring that the pattern has persisted across very different macro and rate environments. Even the more modest years still finished positive, which is unusual for a single stock over a multi-decade history.
The volatility profile inside the window is captured by the best and worst intraperiod excursions from the entry price, known as maximum favorable excursion and maximum adverse excursion. In 2002, for example, the best point-to-peak move reached 33.78% while the worst drawdown from entry was -6.62%, indicating that investors had to tolerate a mid-single-digit setback on the way to a much larger gain. In 2018, the stock’s maximum favorable move was 5.61% but the maximum adverse move reached -14.5%, showing that even a year that ultimately finished higher involved a double-digit pullback at some point during the window.
On average, the seasonal trend chart for this pattern shows gains building relatively steadily through the 83 days, with limited evidence of a single “all-or-nothing” burst. The typical path slopes higher from the start date, with some choppiness mid-window but a tendency for strength to persist into the later stages, which aligns with the idea that midterm-year industrial demand and spending visibility often improve as the year progresses.
The cumulative return view across all midterm-year instances reinforces that impression, with the aggregated line grinding higher rather than oscillating around flat. That steady climb suggests the pattern is not simply the product of one or two outsized years but instead reflects a recurring bias that has appeared across multiple cycles, including both low- and high-volatility macro backdrops.
A second view that layers net results with best and worst intraperiod moves highlights how upside and drawdowns have coexisted in prior cycles.
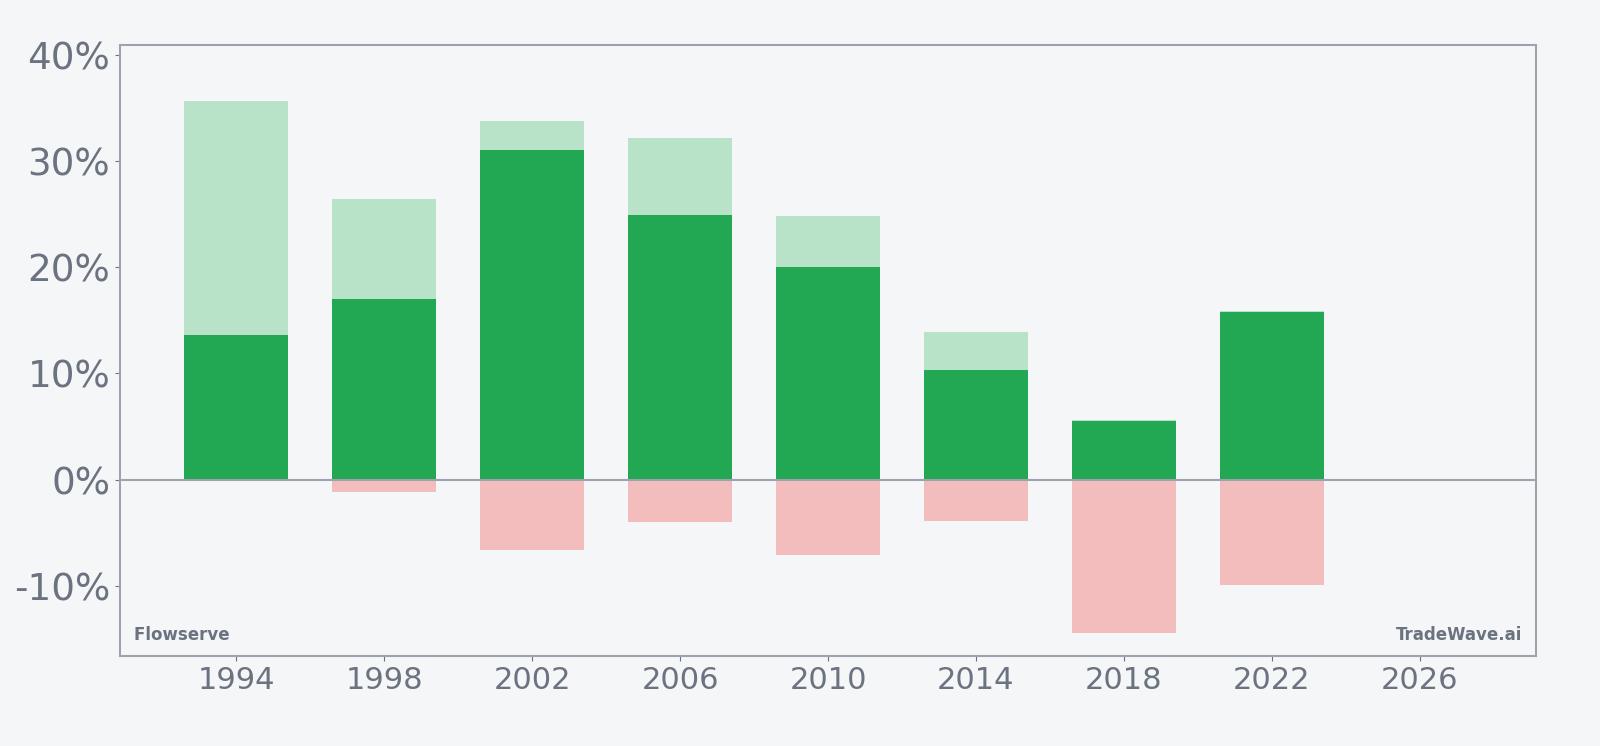
History does not guarantee future results, and maximum adverse excursions have at times been large even in years that ultimately finished higher within this window.
Taken together, the historical pattern defines the quantitative seasonal backdrop for the current period.
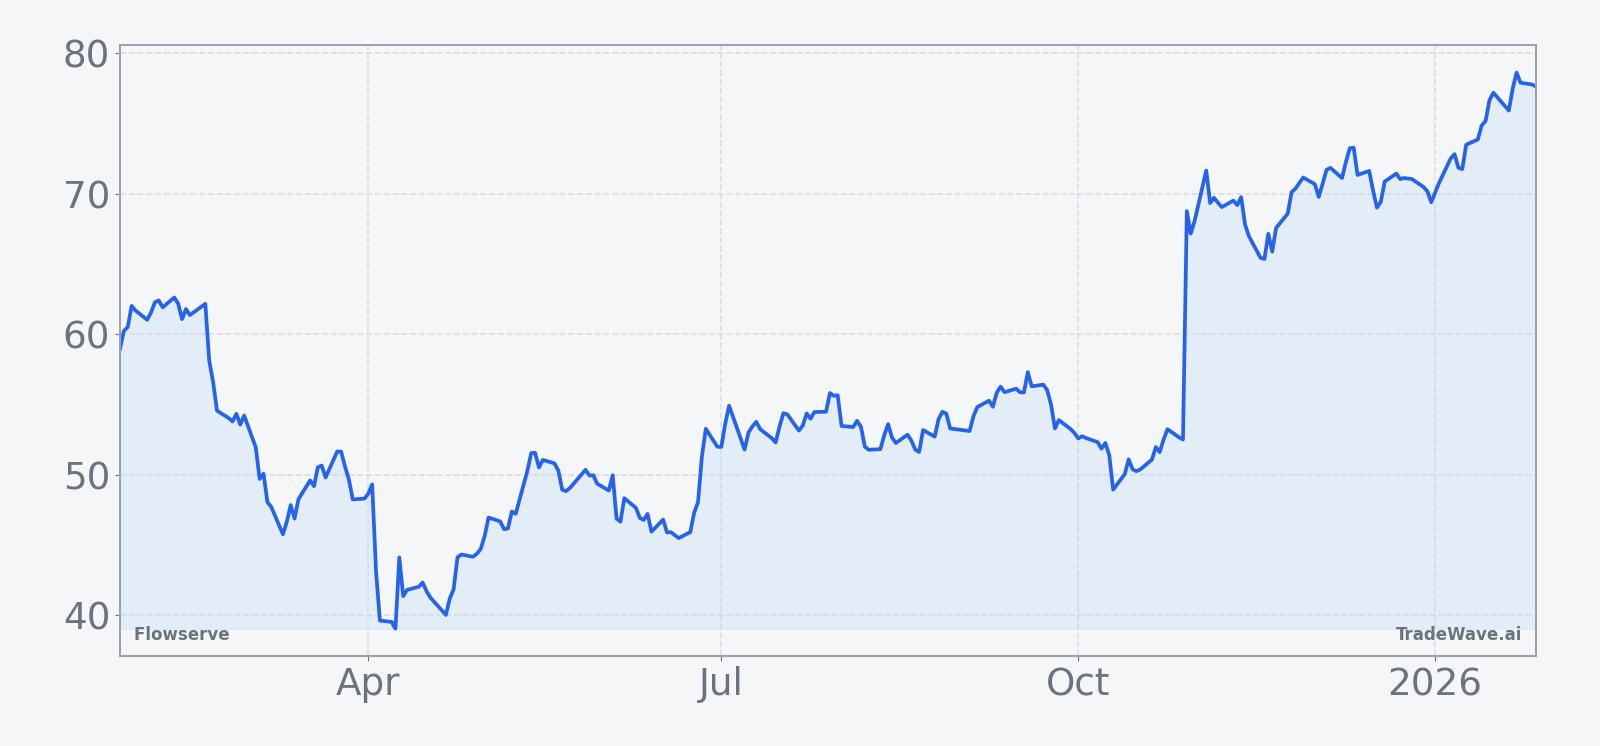
Price and near-term drivers
Flowserve shares closed at $88.38 on Feb 18, down 0.3% on the day, as trading volume of 653,918 shares stayed within a typical range and the stock held near the upper end of its past-year price band.[5] With no imminent earnings date or fresh company-specific headlines in the public record, the stock’s near-term moves have been more about positioning within the industrials complex than about a single binary catalyst.
Broader sector commentary has highlighted how energy and utilities names have been sensitive to shifting rate expectations and commodity-price swings, dynamics that often spill over into capital equipment suppliers and flow-control specialists that serve those end markets.[5] For Flowserve, which sits inside the Wilshire 5000 universe rather than a mega-cap index, that means sentiment can be pulled along by changing views on infrastructure spending, global growth, and project timing even when company news is sparse.
Institutional flow data across the market in recent months has shown active rotation among cyclical and resource-linked names, with some managers trimming or adding positions in miners, energy producers, and related industrials as they recalibrate exposure to commodity and rate risk.[1][4][8][10][13] While these reports do not single out Flowserve, they sketch a backdrop in which portfolio shifts in adjacent industries can influence how investors treat mid-cap industrials that share similar macro drivers.
The chart below situates the latest move in its recent multi-month context.
Election-cycle and macro backdrop
The current pattern phase is defined as the last 9 midterm election years, while the calendar phase is also a midterm election year in its early part. Historically, midterm years have featured a two-stage structure in U.S. markets, with choppier conditions and policy uncertainty early in the year followed by clearer visibility on fiscal and regulatory paths as the election approaches. For industrials, that can translate into delayed orders early on and a catch-up phase later, which helps explain why some midterm-year windows show both sizable drawdowns and strong recoveries.
Macro commentary over the past year has emphasized how investors are watching a mix of interest-rate expectations, inflation trends, and sector-specific earnings to gauge the durability of the cycle.[5][14] For a company like Flowserve that serves energy, chemical, and industrial customers, those macro levers can influence capital-spending plans and, by extension, how investors value the stock through the midterm year.
Market strategists have also pointed to the policy calendar as a key driver, with regulatory decisions, infrastructure initiatives, and environmental rules all shaping the opportunity set for energy and industrial equipment providers.[5][6] While the seasonal pattern for Flowserve is derived purely from historical price behavior, it likely reflects how these recurring policy themes tend to cluster in midterm years, affecting sentiment and flows in a repeatable way.
What to watch from here
For the remainder of this 83-day window, the key question is whether Flowserve continues to behave like prior midterm years, where gains tended to build gradually despite occasional sharp pullbacks. Traders will be watching how the stock reacts to any shifts in rate expectations, commodity prices, or industrial-spending headlines, given their historical influence on the sector.[5][14]
On the chart, the first reference point is whether Flowserve can hold its recent consolidation zone near the upper end of its 12‑month range and then push to fresh highs as the window progresses.[5] A pattern of higher lows and constructive volume would be more consistent with the historical seasonal bias, while a break below recent support accompanied by heavier selling would mark a departure from the typical midterm-year script.
Investors should also keep an eye on cross-asset and sector signals, including flows into and out of energy, mining, and related industrial names, which have recently seen active institutional repositioning.[1][4][8][9][10][11][12][13] Continued rotation into cyclicals would tend to support the seasonal backdrop for Flowserve, whereas a decisive shift back toward defensives or cash could make it harder for the stock to replicate its historical pattern.
Finally, the policy calendar for the midterm election year remains an important overlay, with upcoming decisions on infrastructure, energy, and environmental rules likely to influence sentiment toward industrial equipment suppliers.[5][6][14] How Flowserve trades around those events, and whether it can maintain its historically strong midterm-year window in the face of any macro surprises, will determine how closely this cycle lines up with the past.
Sources
- [1] MarketBeat, “Thrivent Financial for Lutherans Sells 16,514 Shares of Rio Tinto PLC $RIO,” Feb 15, 2026.
- [2] MarketBeat, “Atria Investments Inc Purchases Shares of 5,272 Modine Manufacturing Company $MOD,” Nov 10, 2025.
- [3] MarketBeat, “Taiwan Semiconductor Manufacturing Company Ltd. $TSM Shares Sold by Blue Whale Capital LLP,” Aug 23, 2025.
- [4] MarketBeat, “HudBay Minerals Inc $HBM Stock Holdings Raised by Franklin Resources Inc.,” Dec 1, 2025.
- [5] The Wall Street Journal, “Energy & Utilities Roundup: Market Talk,” Nov 26, 2025.
- [6] CNBC, “BMO says buy this little-known energy stock that's cheap, can jump more than 25%,” Oct 10, 2025.
- [7] Barchart.com, “DIVEVOLK Shatters the Aqua-Barrier: Launches SeaLink for Real-Time Underwater Connectivity at DEMA 2025,” Nov 13, 2025.
- [8] MarketBeat, “Endeavour Mining (TSE:EDV) Insider La Mancha Investments S.À R.L. Sells 60,900 Shares,” Dec 27, 2025.
- [9] MarketBeat, “Abcourt Mines (CVE:ABI) Trading 30.8% Higher - Should You Buy?,” Nov 23, 2025.
- [10] MarketBeat, “Foran Mining (TSE:FOM) Sets New 12-Month Low - Should You Sell?,” Jul 29, 2025.
- [11] MarketBeat, “Abcourt Mines (CVE:ABI) Shares Up 23.1% - Time to Buy?,” Nov 22, 2025.
- [12] MarketBeat, “Ur-Energy (TSE:URE) Stock Passes Below 50-Day Moving Average - Should You Sell?,” Dec 11, 2025.
- [13] MarketBeat, “Foran Mining (TSE:FOM) Reaches New 52-Week Low - Here's Why,” Jul 19, 2025.
- [14] CNBC, “Here are the 6 big things we're watching in the market in the week ahead,” Aug 3, 2025.