Economic Soft Patch After Jobs Miss Tests Credit and Trading Sentiment in S&P 500 Financials SPDR (XLF)
S&P 500 Financials Sector SPDR is approaching a midterm-year pattern that has delivered consistent gains in past cycles, giving traders a data-driven backdrop as financial stocks head into early March.

Key takeaways
- A 19-day seasonal window for S&P 500 Financials Sector SPDR begins on Mar 1, aligned with the midterm election year phase of the presidential cycle.
- Across the last 6 comparable midterm years, the pattern has been long-biased with a 100% win rate, featuring 6 winners and 0 losers.
- Average profit across those winning years was 4.03%, with a median gain of 3.9% and cumulative return of 26% over the sample.
- The TradeWave Ratio of 2.2 indicates that price has typically traveled meaningfully in the trade direction within the window, beyond just the final closing result.
- Historical best-case intraperiod rallies have reached between about 1.67% and 8.49%, while adverse moves have at times dipped as much as about 4.34% before recovering.
- The pattern sits in the early part of the midterm election year, a phase that often features policy uncertainty and choppier trading even when sector trends remain constructive.
According to historical data from TradeWave.ai, this upcoming stretch for XLF has shown a distinct seasonal bias in prior midterm election years, providing a structured backdrop for traders evaluating the sector into early March.
Seasonal window
This seasonal window begins on 2026-03-01 and spans 19 days. Historically, during this period, S&P 500 Financials Sector SPDR has shown a constructive upward tendency in midterm election years, even as day-to-day trading can be choppy.
Grouping the data by the presidential election cycle focuses this pattern on the last six midterm election years, a phase that often coincides with shifting policy priorities, regulatory debates and evolving expectations for interest rates and credit conditions. For a sector as sensitive to regulation and the yield curve as financials, that context can matter as much as the headline index trend.
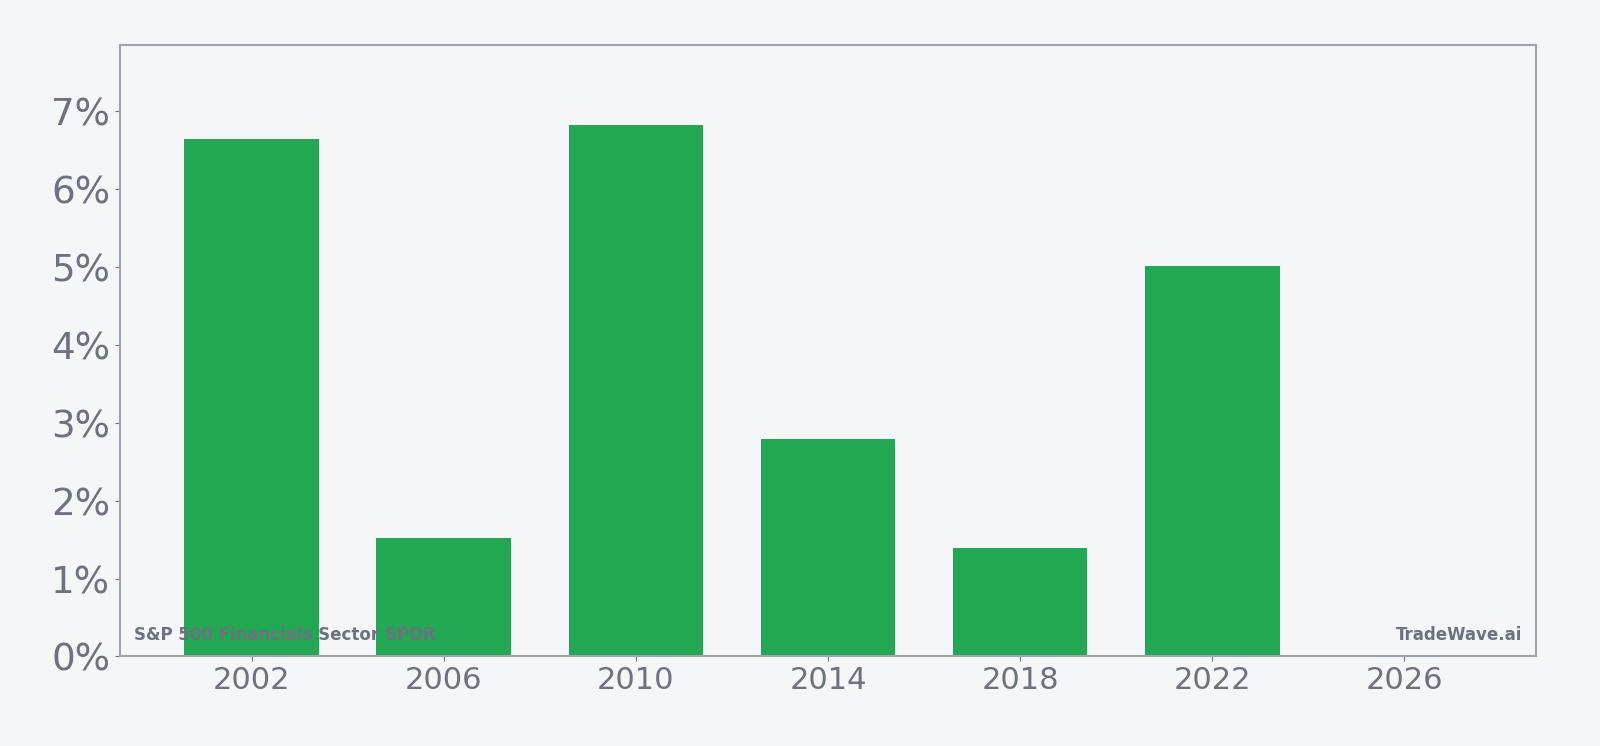
The trade direction for this pattern is long, and every one of the six historical midterm-year windows in the sample finished with a gain, producing a 100% Percent Profitable outcome with 6 winners and 0 losers. Average profit across those years was 4.03%, with a median gain of 3.9% and a cumulative return of 26%, suggesting that while individual years vary, the central tendency has been a modest but consistent upside bias.
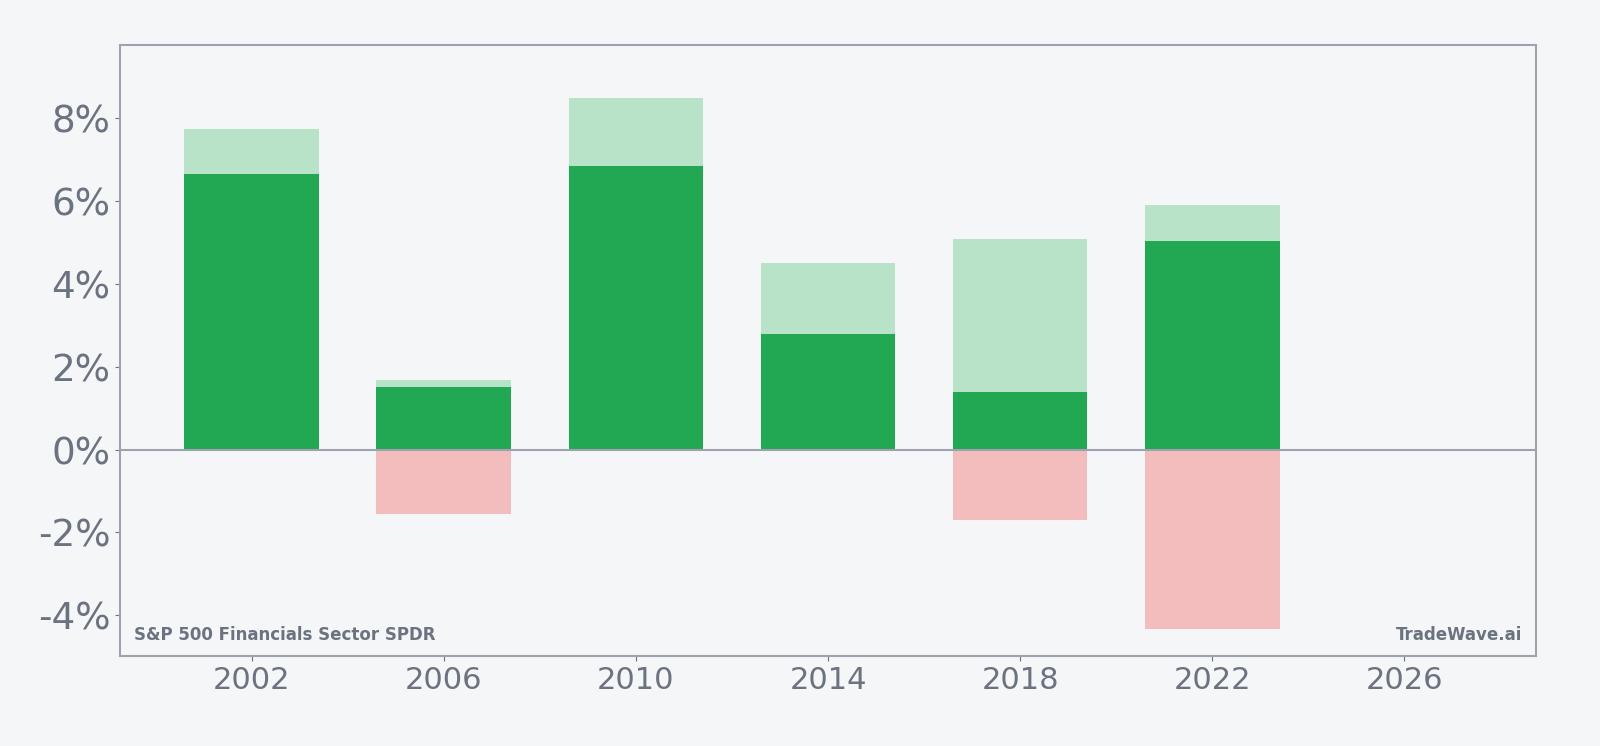
Looking at individual years, the strongest outcome came in 2010, when the ETF advanced 6.83% over the window, helped by a maximum favorable move of 8.49% from the starting level before giving back a small portion of the rally by the close. At the other end of the spectrum, 2006 and 2018 were the softest winners, with net gains of 1.52% and 1.39% respectively, illustrating that even in positive years the payoff has sometimes been relatively muted.
The intraperiod path has not been one-way. In 2022, for example, XLF ultimately gained 5.02% over the window, but the worst adverse move from entry reached about -4.34% before the ETF recovered into the close. By contrast, 2010 saw only a shallow worst drawdown of 0.14% while still delivering one of the strongest rallies, underscoring that both the depth and timing of pullbacks have varied meaningfully from cycle to cycle.
Across the sample, maximum favorable excursions have ranged from about 1.67% in 2006 to 8.49% in 2010, while maximum adverse excursions have spanned from roughly -4.34% in 2022 to small positive or near-flat readings in years like 2010 and 2014. That combination points to a window where upside has tended to dominate by the close, but where interim swings can be material, particularly in more volatile macro backdrops.
A per-year view of net returns alongside peak rallies and worst drawdowns highlights how consistently positive closes have coexisted with varied intraperiod swings.
The cumulative return profile for this pattern, reflected in the 26% total gain across the six-sample history, suggests that the window has tended to add incremental performance rather than define the entire year for financials. Taken together, the historical pattern defines the quantitative seasonal backdrop for the current period.
History does not guarantee future results, and adverse excursions can be large even in windows that ultimately finish higher.
Price and near-term drivers
With the seasonal window set to open on Mar 1, XLF is heading into the period without a clear short-term price signal from the latest quote data, as standard metrics such as the last price, 52-week range and recent returns are not yet available in this dataset. That leaves the focus on the sector’s structural role in the S&P 500 and how financials have been described as showing strength and potential for gains in recent chart-based analysis, even as broader macro narratives remain in flux.[12]
In the financials space, technical commentators have highlighted improving setups in large bank stocks, pointing to what they describe as impulse moves higher that could support sector ETFs like XLF if they persist.[12] At the same time, the broader macro backdrop has been shaped by earlier discussions of a “non-recessionary” market environment and shifting expectations for growth and inflation, which can influence rate-sensitive sectors such as banks and insurers.[5]
Economic narratives have also been influenced by prior jobs data surprises and evolving tariff policies, which can affect credit demand, loan quality and trading activity across the financial complex.[4] For XLF, the interplay between those macro forces and the Federal Reserve’s policy path will likely matter more than any single earnings report during this relatively short 19-day window.
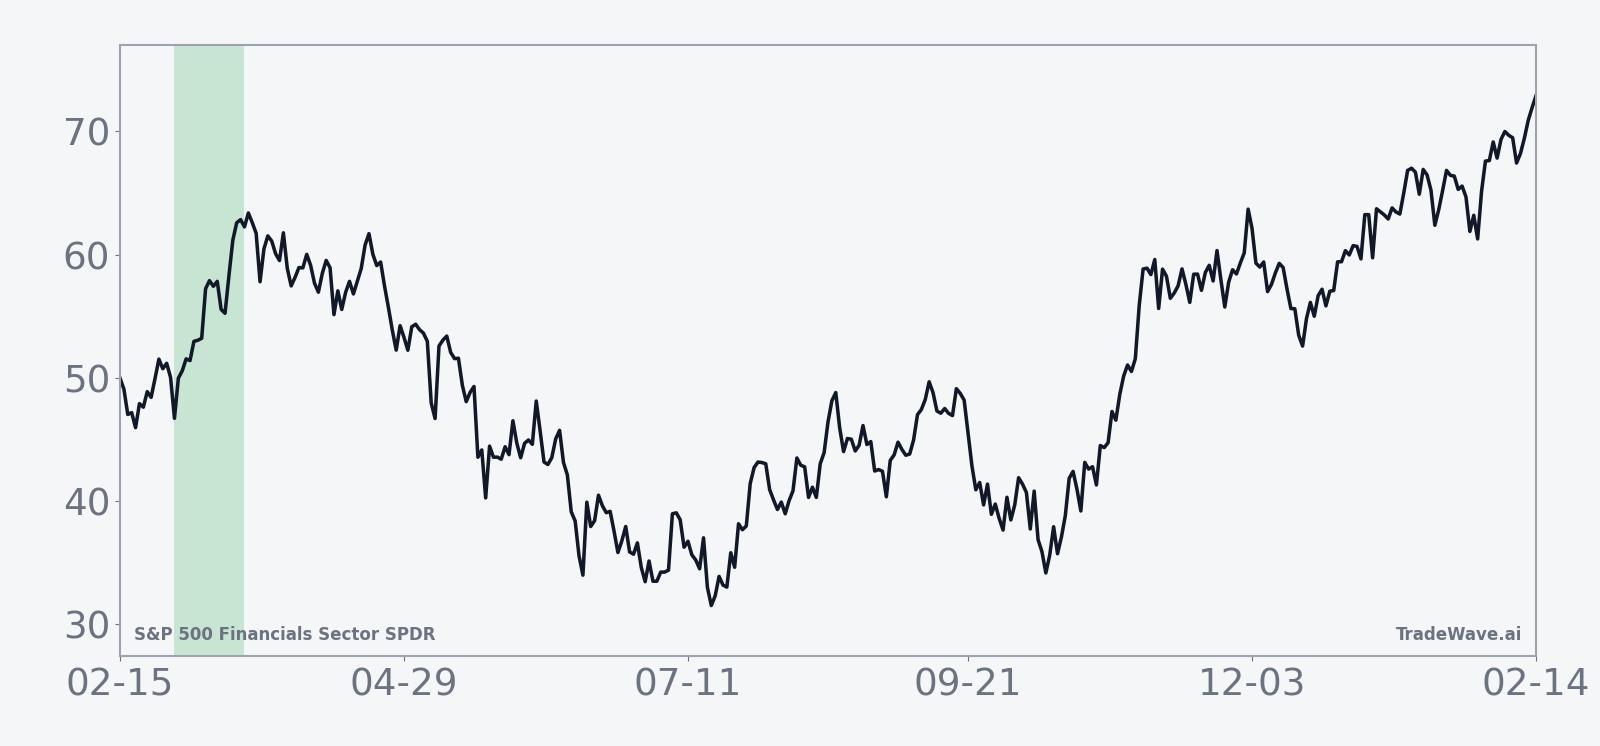
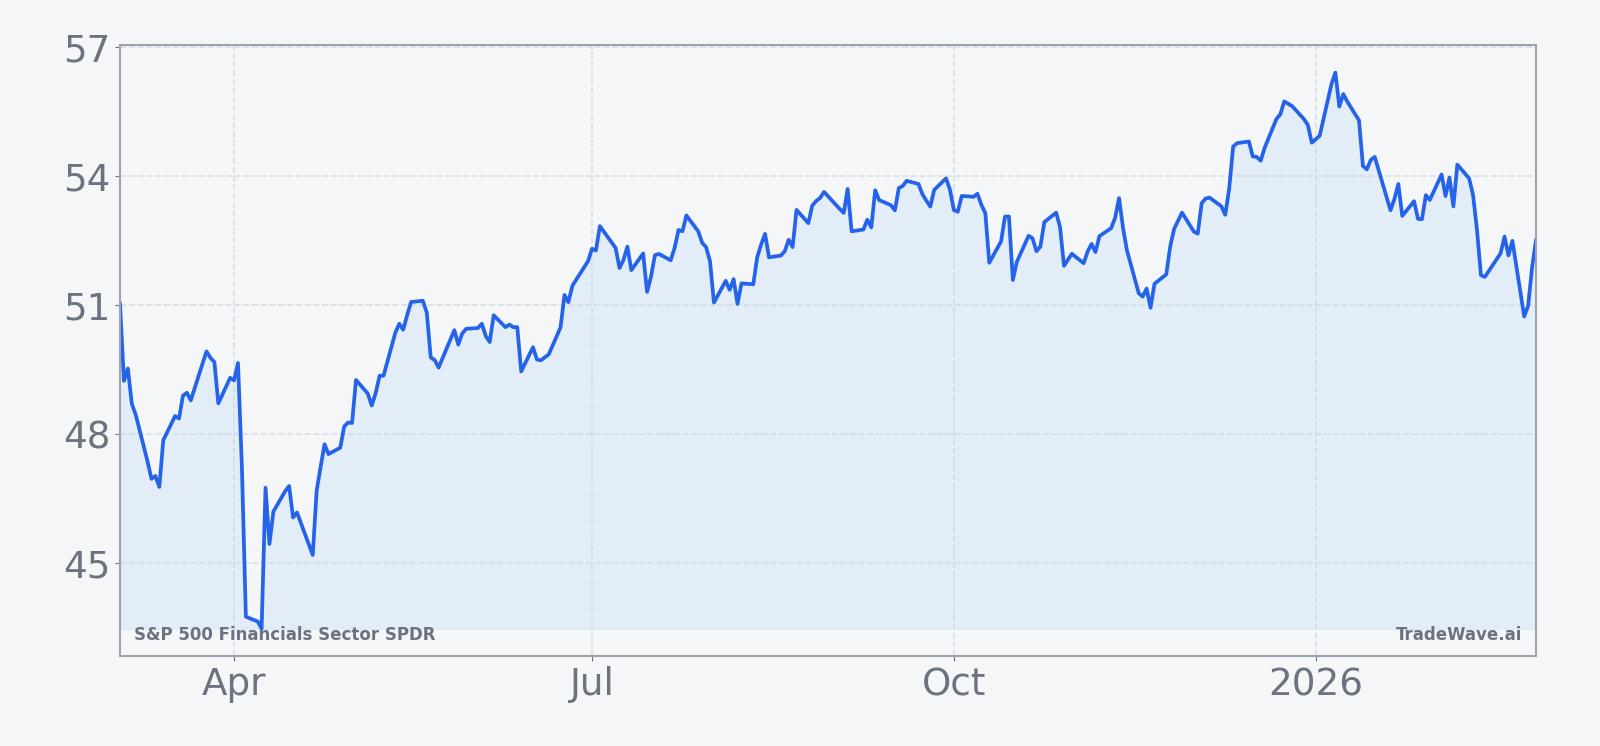
The chart below situates the sector’s recent behavior in its multi-month context ahead of the seasonal window.
Macro and election-cycle backdrop
The 2026 calendar year sits in the midterm election year phase of the U.S. presidential cycle, which has historically featured a “two-playbook” structure for risk assets. Early in midterm years, markets often contend with policy uncertainty, debates over regulation and fiscal priorities, and shifting expectations for future tax and spending decisions, all of which can weigh on sentiment even when the underlying economy remains resilient.[5]
For financials, that environment can be especially important because banks, insurers and asset managers are directly exposed to regulatory changes, capital requirements and consumer credit trends. Earlier commentary on the sector has emphasized that financials within the S&P 500 have been showing strength and potential for gains based on chart analysis, suggesting that investors have been willing to look through some of the policy noise in favor of improving technicals.[12]
At the macro level, prior discussions of a “major turning point” in markets following a jobs report miss and evolving tariff policies underscored how quickly narratives can shift around growth, inflation and trade.[1] Those factors feed directly into expectations for interest rates and yield curves, which in turn shape net interest margins and valuation multiples for financial stocks.
Although the seasonal window examined here is relatively short, it sits within a broader midterm-year context in which markets often transition from early-year choppiness toward more constructive behavior as policy paths become clearer. For XLF, that means the historical pattern of positive returns in this 19-day stretch has unfolded against a backdrop that is not always straightforwardly bullish, highlighting the importance of distinguishing between intraperiod volatility and end-of-window outcomes.
What to watch as the window opens
As the 19-day seasonal window begins on Mar 1, traders watching XLF may focus on several concrete markers. First, the behavior of large money-center and regional banks that dominate the ETF’s holdings will be key, particularly if the “impulse move higher” identified in earlier big-bank chart work continues or stalls.[12] Sustained strength in those names would be more consistent with the historical long-biased pattern, while a sharp reversal could test the resilience seen in prior midterm-year windows.
Second, macro data and policy headlines that influence rate expectations will likely shape intraperiod swings. Surprises in employment, inflation or trade policy could drive the kind of adverse excursions seen in years like 2022, even if the window ultimately resolves higher by the close. Monitoring how XLF trades around such releases can help gauge whether the sector is absorbing shocks in a way that resembles past midterm-year behavior.
Third, price levels and ranges within the window will matter. Historically, maximum favorable moves have sometimes occurred early in the period, while in other years rallies have built more gradually, so traders may watch whether any initial strength is quickly faded or instead consolidates into a more durable trend. A pattern of higher lows after pullbacks would align more closely with the historical average path, whereas repeated breaks of short-term support could signal a departure from the prior six-cycle template.
Finally, the broader policy calendar for the midterm year, including regulatory announcements affecting capital standards, consumer finance and market structure, will remain in focus. For a sector that sits at the intersection of monetary policy and regulation, how XLF responds to those developments inside this historically constructive window will help determine whether the midterm-year pattern continues to hold or begins to evolve.
Sources
- [1] Seeking Alpha, "The Market Faces A Major Turning Point After Shocking Jobs Miss," Aug 3, 2025.
- [2] Yahoo Finance, "New Workforce Career Center Trade School Opens in Atlanta," Aug 1, 2025.
- [3] The Motley Fool, "2 High-Yield Dividend ETFs to Buy With $100 and Hold Forever," Jul 12, 2025.
- [4] Yahoo Finance, "Here’s Why UnitedHealth Group (UNH) Sold Off Sharply in Q2," Aug 5, 2025.
- [5] Seeking Alpha, "Part 1: This Is Not A Recessionary Bear Market," Mar 9, 2025.
- [6] Reuters, "Barclays lifts S&P 500 year-end target to 6,050," Jun 4, 2025.
- [7] MarketBeat, "Endeavour Silver (NYSE:EXK) Receives Sell (D-) Rating from Weiss Ratings," Oct 25, 2025.
- [8] MarketBeat, "NexMetals Mining Corp. (NASDAQ:NEXM) Short Interest Up 106.5% in October," Nov 1, 2025.
- [9] CNBC, "Buy energy stocks for a prospective breakout, says Carter Worth," Nov 14, 2025.
- [10] GuruFocus, "Hudbay (HBM) Initiates Quarterly Dividend Payment," Feb 20, 2026.
- [11] GuruFocus, "Insider Sell: Bruce Brook Sells Shares of Newmont Corp (NEM)," Dec 4, 2025.
- [12] CNBC, "An impulse move higher is beginning in this big bank stock, according to the charts," Oct 30, 2025.
- [13] CNBC, "Energy due for a bounce? Trading for a comeback in the sector using options," Oct 3, 2025.
- [14] CNBC, "Time to snap up Oracle, now down more than 30% in past two months, says Carter Worth," Nov 7, 2025.