Trump’s Softer China Tariff Stance Triggers Profit-Taking Slide in Gold SPDR (GLD)
Gold SPDR is climbing alongside bullion as prices approach $5,000 an ounce, with a 16-day late-March pattern that has historically favored upside and could add another layer of volatility for gold traders.

Key takeaways
- A 16-day seasonal window for Gold SPDR begins on Mar 28 and has historically been favorable for long positions.
- Across 21 years of data, the pattern shows Gold SPDR finishing higher in 81% of years, with 17 winners and 4 losers.
- Average gains in winning years are 2.72%, while the all-years average including losers is 2%, pointing to a positive but not one-sided profile.
- Historical best and worst intraperiod moves show that rallies can be sizable, but adverse swings have also been meaningful in some years.
- Today, GLD trades around $464.70 as spot gold nears $5,000 an ounce, underscoring how macro stress and safe-haven demand are already in play.[2]
- Investors should treat the upcoming window as a defined volatility zone rather than a guarantee of further gains.
According to historical data from TradeWave.ai, the late-March period has shown a distinct pattern for Gold SPDR over the past two decades. The next section looks at how that seasonal tendency lines up with today’s elevated gold backdrop.
Seasonal window
This seasonal window begins on 2026-03-28 and spans 16 days, and historically it has been a constructive stretch for Gold SPDR in the direction of long trades. Today the ETF changes hands near $464.70, up about 1.5% on the session, as bullion prices hover just below $5,000 an ounce amid heightened geopolitical and economic uncertainty.[2] With gold already elevated, the historical pattern around late March could matter more than usual for investors trying to gauge whether momentum tends to persist or fade in this part of the calendar.
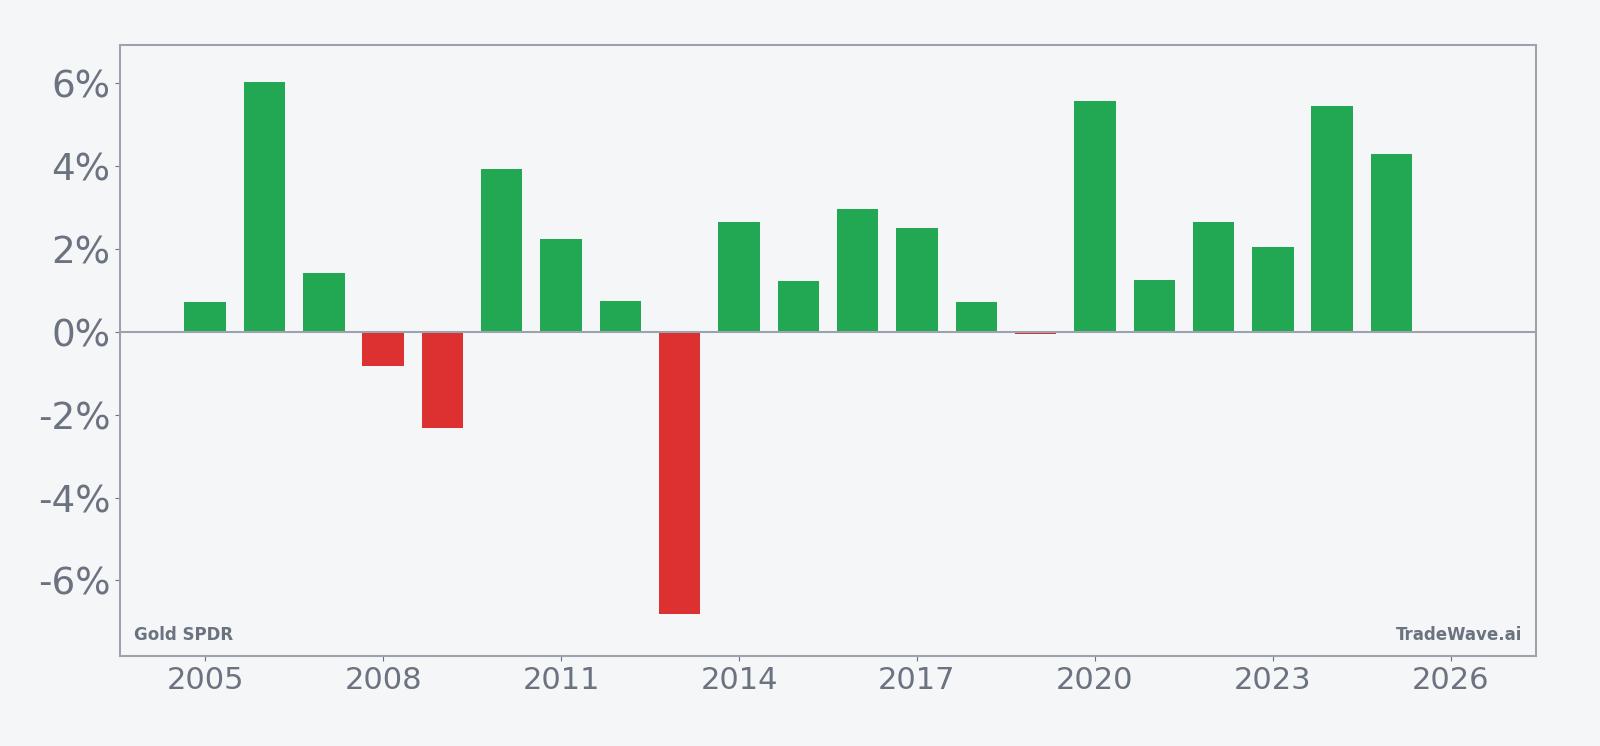
Across the 21-year sample, the pattern has finished profitable for long positions in 81% of years, with 17 winners and 4 losers, underscoring a clear historical bias toward upside during this short stretch. Average gains in winning years come in at 2.72%, while the average outcome across all years, including the four down periods, is 2%, which suggests that losing years have tended to be modest rather than deeply negative.
The per-year breakdown shows that some of the strongest instances have occurred in more turbulent macro backdrops. In 2020, for example, the window delivered a 5.55% net gain with a peak run-up of 6.19% from entry before a maximum drawdown of 3.32% within the period, while 2024 saw a 5.43% net gain and a notably large 9.42% peak move with only a small 0.28% worst pullback from entry. At the other end of the spectrum, 2019 was essentially flat with a 0.06% loss, and 2025 still produced a 4.28% gain despite a 4.04% worst intraperiod decline, illustrating that even winning years can involve uncomfortable swings.
The historical profile of best and worst intraperiod moves, often described as maximum favorable excursion and maximum adverse excursion, points to a window where both upside bursts and meaningful drawdowns have been common. In several years, the best point-to-peak move within the window has exceeded the final net gain, indicating that traders who tried to ride the entire period sometimes had to sit through partial givebacks, while the worst drawdowns in losing years have generally been contained relative to the stronger upside episodes.
The 21-year average trend line for the window suggests that gains have tended to build relatively steadily rather than arriving in a single spike, with the pattern often showing early strength that either consolidates or extends into the back half of the period. The cumulative return profile, reflected in the annualized return of 1.68% and a 41% cumulative gain across all instances, reinforces the idea that this slice of the calendar has historically contributed positively to long-term gold ETF performance rather than acting as a drag.
Year-by-year net results alongside peak favorable and worst adverse moves help frame how much volatility has accompanied those gains.
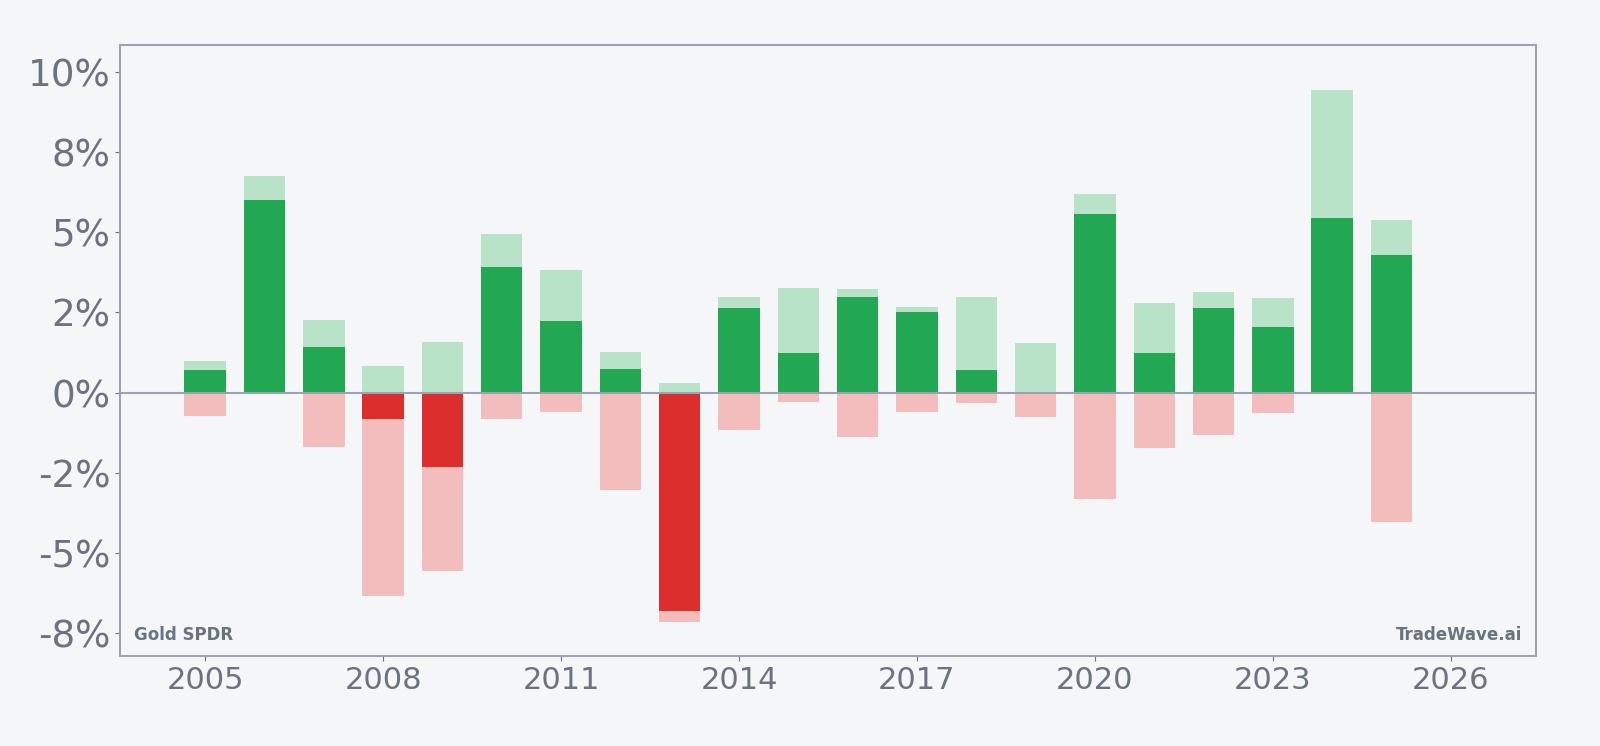
Viewed together, the net, peak favorable, and worst adverse moves show that the late-March window has historically offered meaningful upside potential for long positions, but often with enough intraperiod volatility to challenge risk management, particularly in years like 2020 and 2025 where the worst drawdowns were sizable even as the final outcomes were positive. Taken together, the historical pattern defines the quantitative seasonal backdrop for the upcoming period.
History does not guarantee future results; adverse excursions (MAE) can be large even in winning windows.
Price and near-term drivers
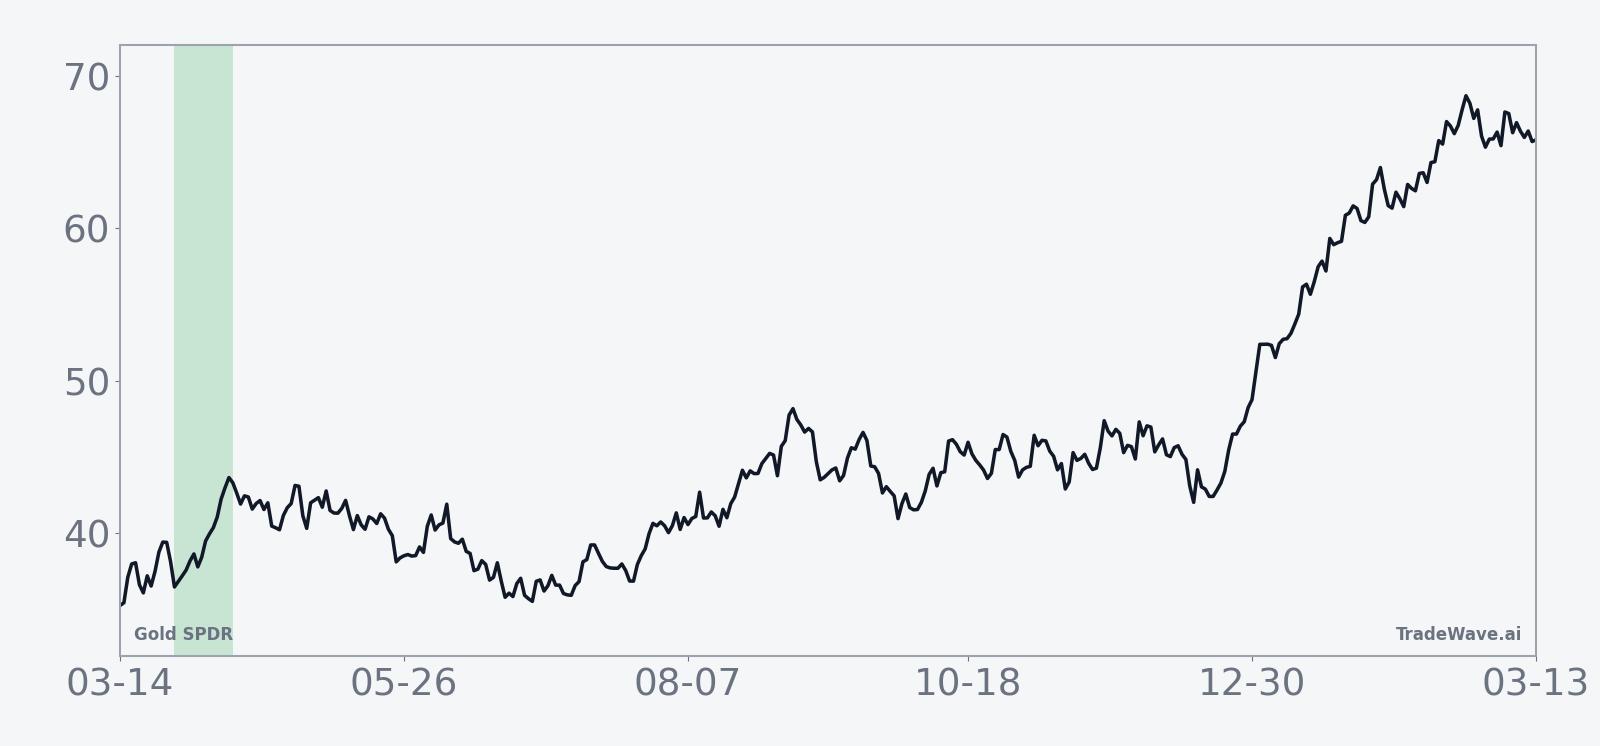
Gold SPDR trades around $464.70 on Jan 27, up roughly 1.46% on the day, as spot gold prices approach $5,000 an ounce and safe-haven demand remains elevated.[2] The move extends a powerful multi-year run in bullion that has been fueled by geopolitical tensions and concerns about the durability of global growth, with investors increasingly using GLD as a liquid proxy for physical gold exposure.
In a Jan 26 analysis, one strategist highlighted how gold’s surge toward $5,000 has coincided with choppy equity markets and pressure on traditional diversifiers such as long-duration bonds, reinforcing the metal’s role as a portfolio hedge when both stocks and fixed income struggle to deliver consistent real returns.[2] That backdrop has helped keep flows into gold-linked products resilient even after episodes of profit-taking, as investors weigh the trade-off between locking in gains and maintaining protection against further macro shocks.
Earlier in the cycle, gold’s path has not been one-way. In Oct 2025, bullion suffered its sharpest drop in more than a decade, dragging down major mining stocks such as Barrick Gold, Newmont, and Agnico Eagle Mines as traders took profits following a strong run.[1] A few days before that slide, a softer tone on tariffs with China had already triggered heavy profit-taking in both gold and silver, underscoring how quickly sentiment can shift when policy headlines ease perceived tail risks.[4]
Currency dynamics have also been central to the story. In Sep 2025, analysts pointed to a weakening US dollar, driven in part by expansive monetary and fiscal policies and concerns about Federal Reserve independence, as a key driver of gold’s strength relative to other asset classes.[3] A softer dollar tends to support bullion by making it cheaper for non-US buyers and by eroding the real value of cash holdings, a combination that can amplify flows into vehicles like GLD when inflation-adjusted yields are low or negative.
The chart below situates the latest move in its recent multi-month context.
Macro backdrop and exposure profile
Gold SPDR is designed to track the price of gold bullion, giving investors exposure to the metal’s spot performance without the operational complexity of owning and storing physical bars. That structure has made GLD a central tool for both tactical traders and long-term allocators seeking to hedge against inflation, currency debasement, or geopolitical shocks, particularly in periods when traditional safe havens such as government bonds are under pressure.
The macro themes currently driving gold are familiar but unusually intense. Ongoing geopolitical risks and economic uncertainty have kept demand for safe-haven assets elevated, with investors looking to gold as a store of value when confidence in policy frameworks or growth trajectories wavers.[2] At the same time, episodes of tariff-related tension and subsequent relief have produced sharp swings in precious metals, as seen in Oct 2025 when a more conciliatory stance on China tariffs triggered a rapid reversal from record highs.[4]
Sector dynamics add another layer. When bullion prices fall sharply, gold mining equities often experience amplified moves because their earnings are leveraged to the underlying metal price, as illustrated in Oct 2025 when leading miners sold off more aggressively than gold itself.[1] For investors using GLD alongside mining stocks, that relationship can either enhance diversification or compound volatility, depending on how positions are sized and hedged.
Tracking considerations also matter. As a physically backed ETF, GLD’s performance is closely tied to spot gold, with fees and operational costs creating only a modest drag over time. That makes the fund a relatively clean way to express a view on bullion compared with futures-based products, which can be affected by roll costs and term-structure shifts, particularly in markets where contango or backwardation is pronounced.
How the seasonal pattern fits into today’s setup
With gold already trading near record territory and GLD reflecting that strength, the upcoming late-March seasonal window arrives against a backdrop of elevated prices and heightened macro sensitivity. Historically, the 16-day stretch starting Mar 28 has tended to reward long exposure more often than not, but the presence of years with sizable intraperiod drawdowns is a reminder that even favorable patterns can involve sharp countertrend moves.
For portfolio managers, the key question is less whether the pattern will repeat exactly and more how it might interact with ongoing drivers such as dollar trends, central bank policy expectations, and geopolitical developments. If macro stress remains high and the dollar stays soft, the historical tendency toward gains in this window could align with existing momentum. If conditions ease or policy surprises emerge, the same window could instead coincide with consolidation or a pullback, as has occurred in prior years when profit-taking followed strong rallies.
What to watch as late March approaches
As the Mar 28 window nears, traders will be watching several signposts. First, the behavior of GLD relative to spot gold will be important, particularly if any tracking gaps emerge during periods of heavy trading or volatility. Persistent strength in bullion as it tests or exceeds the $5,000 level would keep the focus on whether the seasonal pattern adds incremental upside pressure or simply marks a consolidation phase.[2]
Second, macro catalysts around the start of the window could shape how the historical pattern plays out. Key data on inflation, growth, and central bank policy expectations, along with any escalation or easing in geopolitical tensions, will influence whether investors continue to seek gold as a hedge or rotate toward risk assets. A renewed bout of dollar weakness similar to what was observed in Sep 2025 would likely support the traditional safe-haven narrative, while a firmer dollar could blunt some of the seasonal tailwind.[3]
Third, cross-asset signals from gold mining equities and related sectors may offer clues about positioning and sentiment. If miners begin to underperform bullion sharply, as they did during the Oct 2025 selloff, it could indicate that equity investors are bracing for a pullback even if GLD itself remains firm.[1] Conversely, a synchronized move higher in both bullion and miners into the window would suggest that risk appetite within the gold complex remains robust.
Finally, intraperiod volatility will be worth monitoring once the window opens. Historically, some of the strongest years in this pattern have also featured notable drawdowns before finishing higher, which means that the path of returns can matter as much as the endpoint. Traders will be watching whether early strength within the window is followed by consolidation or by deeper pullbacks, and whether any sharp moves align with or contradict the broader macro narrative that has driven gold to its current elevated levels.
Sources
- [1] Seeking Alpha, "Gold mining stocks sink as bullion suffers sharpest drop in over a decade," Oct 21, 2025.
- [2] Seeking Alpha, "Chart Of The Day: After $100 Silver And (Almost) $5K Gold, What's Next?", Jan 26, 2026.
- [3] Forbes, "3 Ways To Profit As Gold Rips, Bonds Slip, Stocks Chop," Sep 5, 2025.
- [4] Seeking Alpha, "Gold, silver slide on heavy profit-taking after Trump reassures on China," Oct 17, 2025.