Stronger 2025 NII Guidance and Markets Revenue Boost JPMorgan Chase (JPM) Earnings Story
JPMorgan Chase has entered an 18-day midterm-election-year pattern that has historically favored downside moves even as the stock trades near record territory, sharpening the focus on short-term volatility risk.

Key takeaways
- JPMorgan Chase is in an 18-day seasonal window that historically aligns with the midterm election year and has favored short-side setups.
- The pattern has been profitable in 90% of years, with 9 winners and 1 loser across the sample.
- Average gain in winning years is 9.05%, while the all-years average, including the lone losing year, is 7%.
- Historical paths show sizable intraperiod swings, with both strong favorable moves and notable adverse drawdowns within the window.
- The pattern clusters in early midterm years, a phase that has often featured choppier trading conditions for large financials.
According to historical data from TradeWave.ai, this stretch of the calendar has shown a distinct election-cycle pattern for JPMorgan Chase in prior midterm years. The following section translates that quantitative backdrop into plain-English context for the current trading window.
Seasonal window
This seasonal window is currently underway, spanning 18 days, and has historically been a weak stretch for JPMorgan Chase in midterm election years. The stock last traded at $239.01 on Jan 8, 2026, fractionally lower on the day, leaving it close to its recent highs without a clear year-to-date reference point.[6]
Grouping the data by the presidential election cycle matters here because midterm years often coincide with shifting policy expectations, regulatory debates and evolving rate paths that can disproportionately affect large banks. By isolating only those years that match the midterm phase, the pattern focuses on how JPMorgan Chase has behaved when Washington is in the middle of a presidential term and markets are recalibrating to the policy and earnings environment that follows the initial post-election adjustment.
Within this framework, the trade direction for the pattern is short, meaning that historically the more favorable years for the setup have been those in which JPMorgan Chase drifted lower over the 18-day span. Across the sample, the window has been profitable for that short orientation in 90% of years, with 9 winners and 1 loser, underscoring a consistent downside bias in this specific slice of the calendar.
The average profit in winning years is 9.05%, while the average across all years, including the single losing outcome, is 7%. That gap highlights how the lone unfavorable year trimmed but did not erase the overall tendency for the stock to move in the trade direction during this window. For context, the average loss in the down year was 6.64%, which is sizable but still smaller in magnitude than the typical gain in the more favorable years.
The historical path of intraperiod swings is captured by the maximum favorable excursion and maximum adverse excursion, which measure the best run-up and worst drawdown from the entry point within the window. In strong years for the pattern, JPMorgan Chase has often seen a meaningful move in the trade direction early in the period, while the weaker years show deeper adverse moves that can develop quickly before the stock stabilizes or reverses.
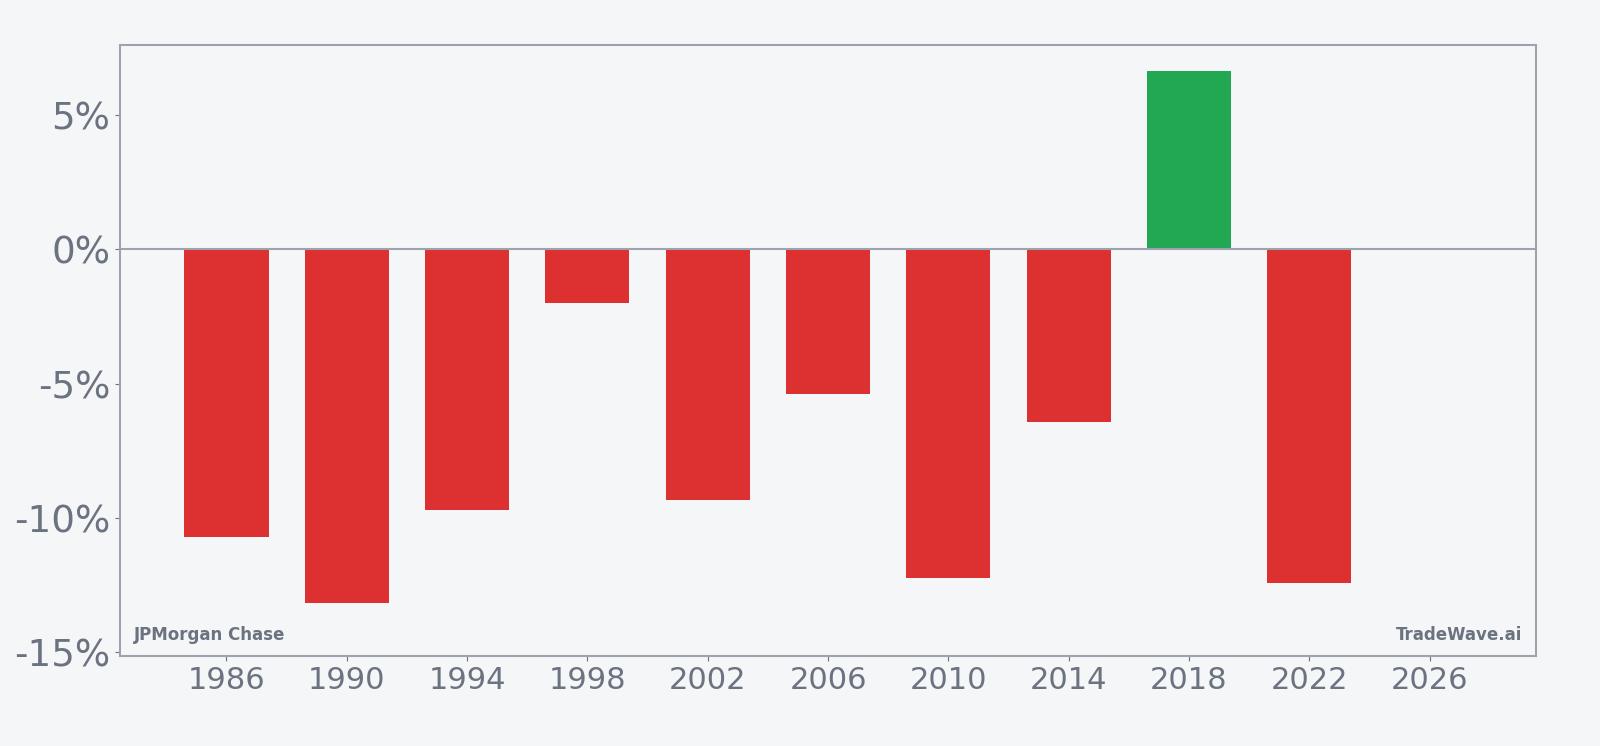
Looking at individual years, 1990 and 2022 stand out as some of the strongest for the short pattern, with net returns of -13.2% and -12.43% respectively, reflecting sizable declines over the 18-day span. By contrast, 2018 was the clear outlier on the other side, with a 6.64% gain that represented a losing year for the short setup and illustrated how sharp rallies can still occur even in a window that has generally leaned lower.
The cumulative return profile across all midterm years shows a relatively steady move in the trade direction rather than a single spike, suggesting that when the pattern has worked, it has often done so through a series of daily drifts rather than one-off shocks. That behavior can matter for risk management because it implies that traders have historically had multiple opportunities within the window to reassess positioning as the move unfolded.
Yearly net and peak moves highlight how far JPMorgan Chase has tended to travel in both favorable and adverse directions during this window.
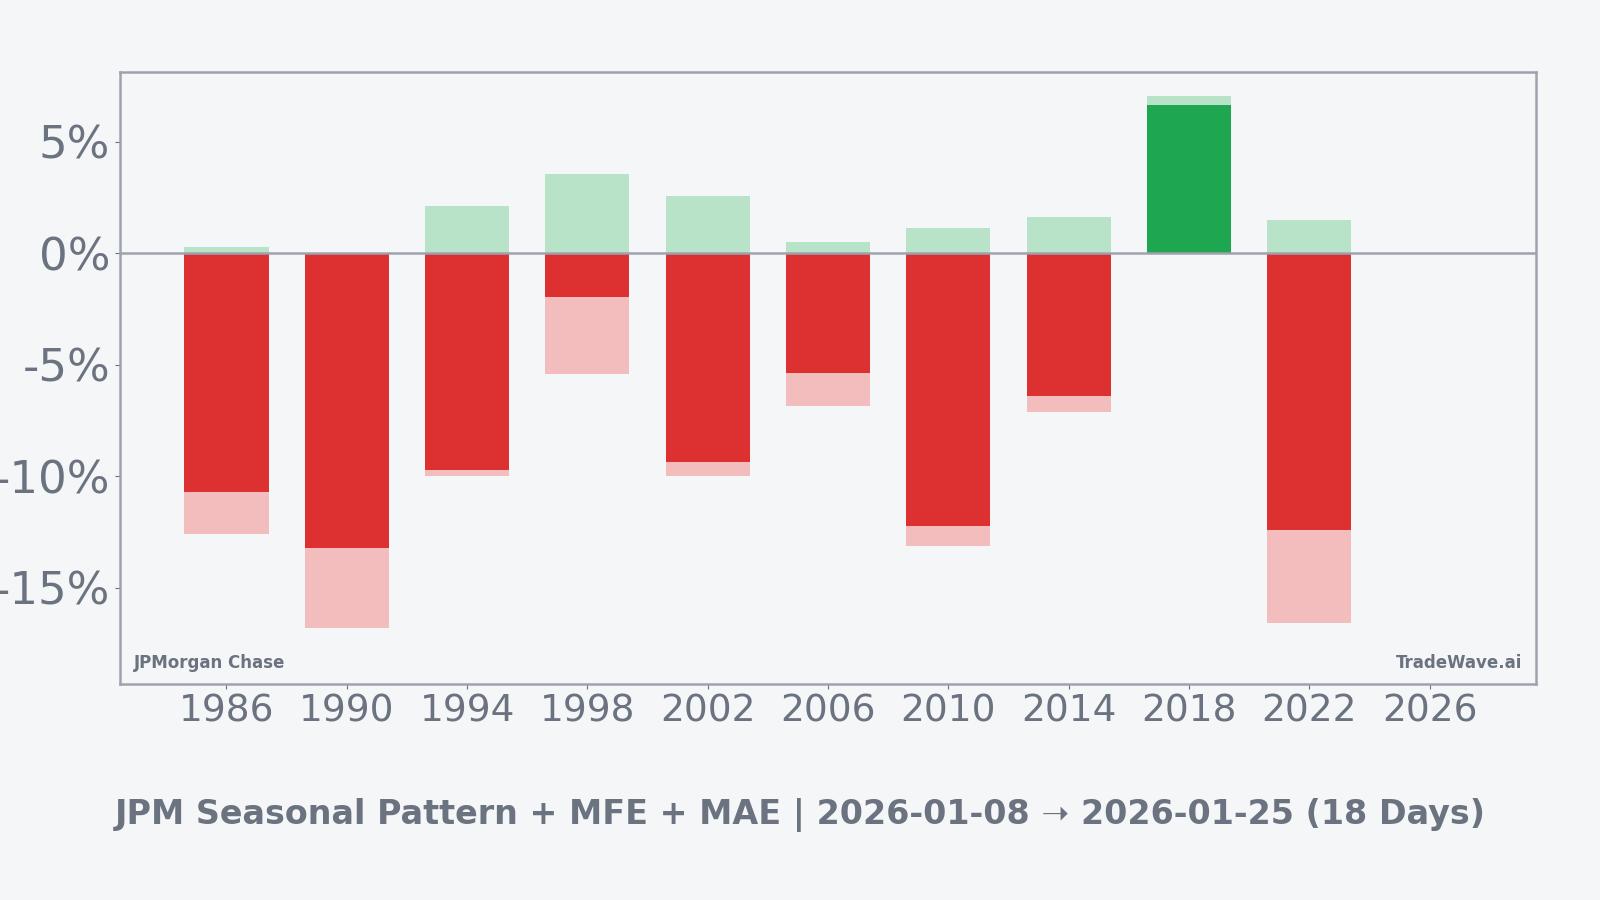
History does not guarantee future results; adverse excursions (MAE) can be large even in winning windows.
Taken together, the historical pattern defines the quantitative seasonal backdrop for the current period.
Price and near-term drivers
JPMorgan Chase shares changed little on Jan 8, 2026, with the stock closing at $239.01 and edging lower by 0.04% on the day, leaving it near the upper end of its 12-month range without a published 52-week high or low reference in the available data.[6] That level keeps the bank firmly in large-cap leadership territory after a stretch in which strong trading and investment banking results in 2025 underpinned sentiment toward the franchise.[2][3][5]
In April 2025, JPMorgan reported first-quarter profit of $14.64 billion, with earnings per share of $4.91 excluding a one-time gain, ahead of Wall Street estimates, as revenue rose 8% to $46.01 billion on robust trading and fee income.[3] In October 2025, the bank followed with another strong quarter, as investment banking fees climbed 16% and markets revenue jumped 25%, reflecting healthy dealmaking and volatility-driven activity across its capital markets businesses.[2][5]
Alongside those results, management lifted 2025 guidance for net interest income and expenses, and signaled expectations for low double-digit growth in investment banking revenue and high-teens growth in markets revenue for the third quarter, reinforcing the narrative of JPMorgan as a key beneficiary of a still-active deal and trading environment.[2][6] That operational backdrop has helped support a “Moderate Buy” consensus rating from analysts, with a consensus price target of $252.89 according to MarketBeat, implying room above current levels even after the stock’s strong multi-year run.[1]
Strategically, the bank has also been leaning into geographic expansion. In August 2025, reporting highlighted JPMorgan’s push to become the largest bank in the American South, with senior leadership touring the region to underscore the growth opportunity in deposits, lending and local corporate relationships.[7] That expansion drive, combined with its scale in trading and investment banking, has led some commentators to describe JPMorgan as the “Nvidia of banking,” a shorthand for its outsized influence within the financial sector and broader equity benchmarks.[8]
From a positioning standpoint, short interest in JPMorgan stood at 1.05% in March 2025, a relatively low level that suggests limited outright bearish bets in the stock despite its size and centrality to the sector.[8] That backdrop means that any seasonal weakness in the current window would likely be driven more by macro shifts, earnings expectations or sector rotation than by an already crowded short base.
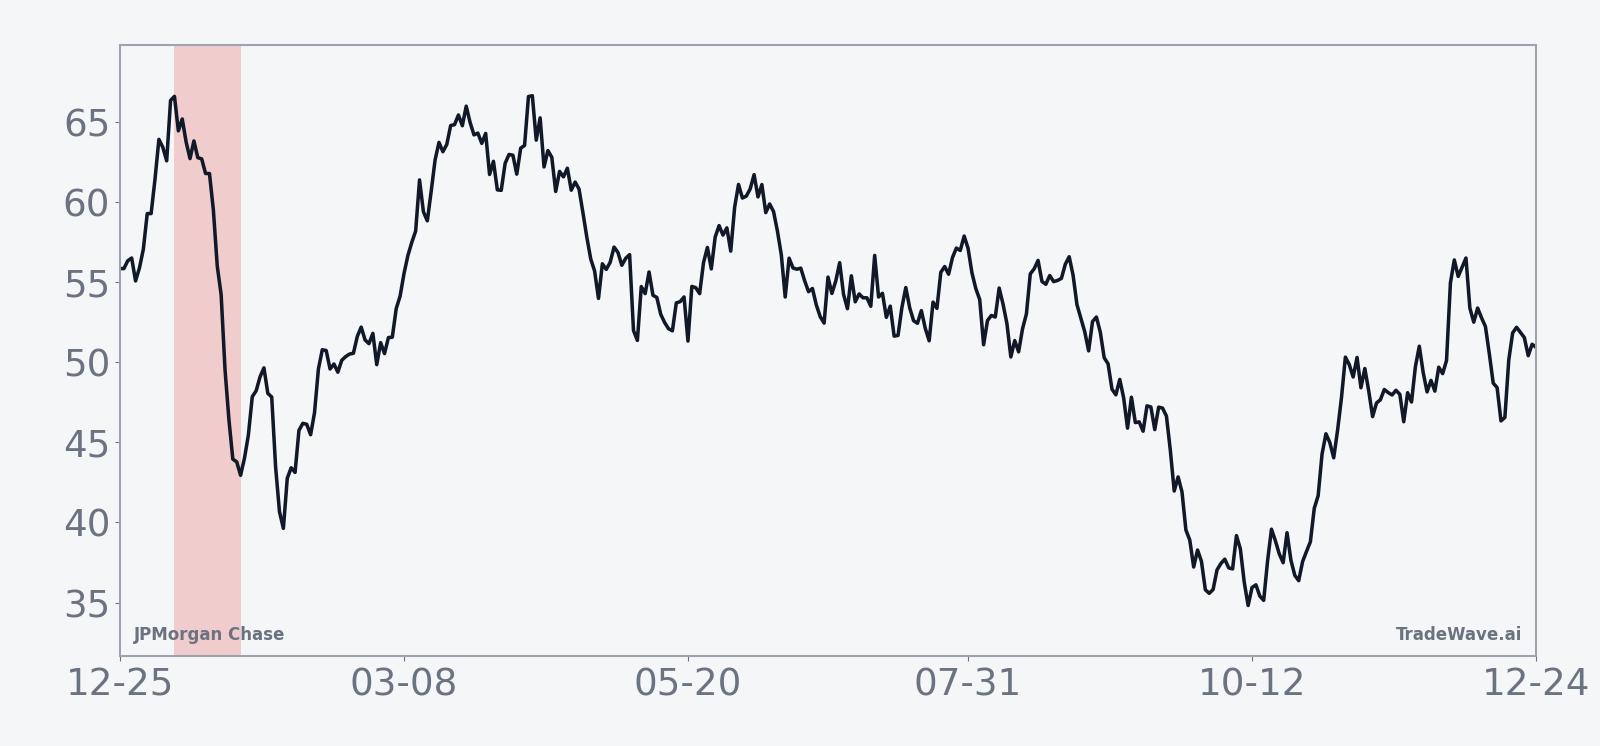
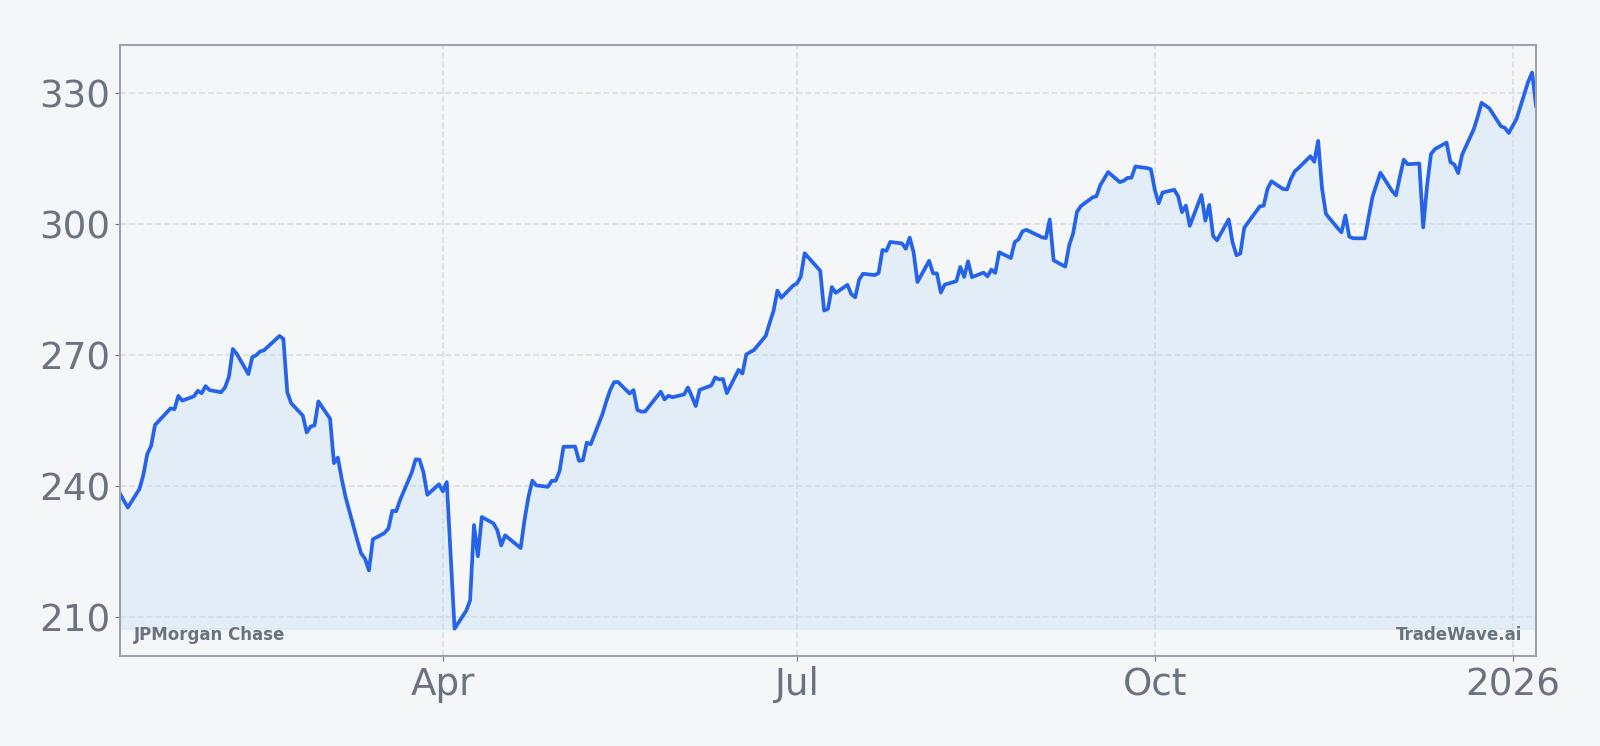
The chart below situates the latest move in its recent multi-month context.
Macro and election-cycle backdrop
The current pattern sits in the early part of the midterm election year, a phase that historically has brought more policy noise and market debate over the trajectory of interest rates, regulation and fiscal priorities. For a systemically important bank such as JPMorgan, that environment can translate into shifting expectations for loan growth, credit quality and trading activity, even when the underlying economy remains resilient.[6]
In September 2025, the S&P 500 and Nasdaq closed at record highs as investors increased bets on eventual interest rate cuts, underscoring how rate expectations have been a central driver of equity valuations and sector leadership.[6] For large banks, lower rates can compress net interest margins over time, but they can also support credit quality and deal activity, creating a nuanced backdrop in which earnings mix and balance-sheet positioning matter as much as the headline rate path.
As the midterm year progresses and markets look ahead to the year before the next presidential election, investors will be watching whether the current seasonal window’s historical tendency toward weakness for JPMorgan gives way to a more constructive phase. In prior cycles, the year before the presidential election has often coincided with a more risk-on tone in equities, which can benefit large financials if credit conditions remain stable and capital markets stay active.
What to watch in this window
For the remainder of this 18-day midterm-year window, the key focus will be how JPMorgan trades relative to its historical pattern of drifting lower in this phase. A sustained move that holds near or above recent highs would echo the 2018 outlier year and signal that the stock is shrugging off the typical midterm-year softness, while a more orderly pullback would be more in line with the majority of historical outcomes.
Traders will also be monitoring upcoming macro data and central bank commentary that could shift expectations for the timing and pace of rate cuts, given the sector’s sensitivity to the yield curve and credit conditions.[6] Any change in the outlook for dealmaking, trading volumes or regulatory policy could feed quickly into earnings expectations for JPMorgan, amplifying moves within the seasonal window.
On the positioning side, the relatively low short interest reported in March 2025 means that a sharp downside move would likely reflect fresh selling rather than a squeeze of existing bearish bets, while a continued grind higher could keep pressure on underweight investors to add exposure.[8] Watching whether short interest and options activity begin to build or remain subdued as the window progresses can offer additional clues about how aggressively the market is leaning into or against the historical pattern.
Finally, price levels around the recent highs and any emerging support zones on the 12-month chart will be important reference points. Behavior around those areas during this window will help clarify whether the midterm-year seasonal tendency toward weakness is reasserting itself or being overridden by JPMorgan’s fundamental and macro backdrop in this cycle.
Sources
- [1] MarketBeat: JPMorgan Chase & Co. (NYSE:JPM) Declares Dividend Increase - $1.40 Per Share (Mar 18, 2025)
- [2] Seeking Alpha: JPMorganChase lifts 2025 NII, expense guidance; Q3 earnings beat on strong activity (Oct 14, 2025)
- [3] CNBC: JPMorgan Chase is set to report first-quarter earnings – what the Street expected (Apr 11, 2025)
- [5] Bloomberg: JPMorgan Traders, Bankers Crush Estimates for Third-Quarter Haul (Oct 14, 2025)
- [6] Reuters: S&P 500 and Nasdaq notch record high closes, investors bet rate cut (Sep 9, 2025)
- [7] The Wall Street Journal: JPMorgan CEO Jamie Dimon Took a Bus Tour Down South. We Rode Along. (Aug 9, 2025)
- [8] Seeking Alpha: JPMorgan Chase is the 'Nvidia of banking,' Wells Fargo's Mayo says (Mar 20, 2025)