Geopolitical Tensions Keep Defense Demand Firm for Lockheed Martin (LMT) Stock
Lockheed Martin is moving through a historically favorable 79-day seasonal stretch as shares hover near $487, giving defense investors a data-driven backdrop for policy and earnings risks in the midterm election year.

Key takeaways
- Lockheed Martin is in a 79-day seasonal window that has historically been strong for the stock in midterm election years, with a long trade direction.
- Across the sample, the pattern has been profitable in 87% of years, with 13 winners and 2 losers.
- Average gains in winning years are 14.87%, while the all-years average, including losers, is 11%.
- Historical maximum favorable moves inside the window have often been sizable, but the worst adverse excursions show that drawdowns can still be meaningful before rallies develop.
- The window sits in the early part of the midterm election year, when defense spending debates and geopolitical developments can amplify volatility around this seasonal tendency.
According to historical data from TradeWave.ai, this part of the calendar has shown a distinct pattern for Lockheed Martin in prior midterm election years. The next section looks at how that seasonal backdrop lines up with today’s price and policy environment.
Seasonal window
This seasonal window is currently underway, spanning 79 trading days from Jan 8, 2026, and has historically been a strong stretch for Lockheed Martin in the midterm election year. Today the stock trades around $487.53, with year-to-date performance at about -5.2%, so the historical pattern is unfolding against a slightly softer start to the year.
Grouping the data by the presidential election cycle matters here because defense spending, procurement decisions and export approvals often follow multi-year policy rhythms rather than smooth calendar-year trends. The midterm election year tends to feature budget wrangling and shifting committee priorities in Washington, which can create pockets of volatility even when long-term demand for defense hardware remains firm.
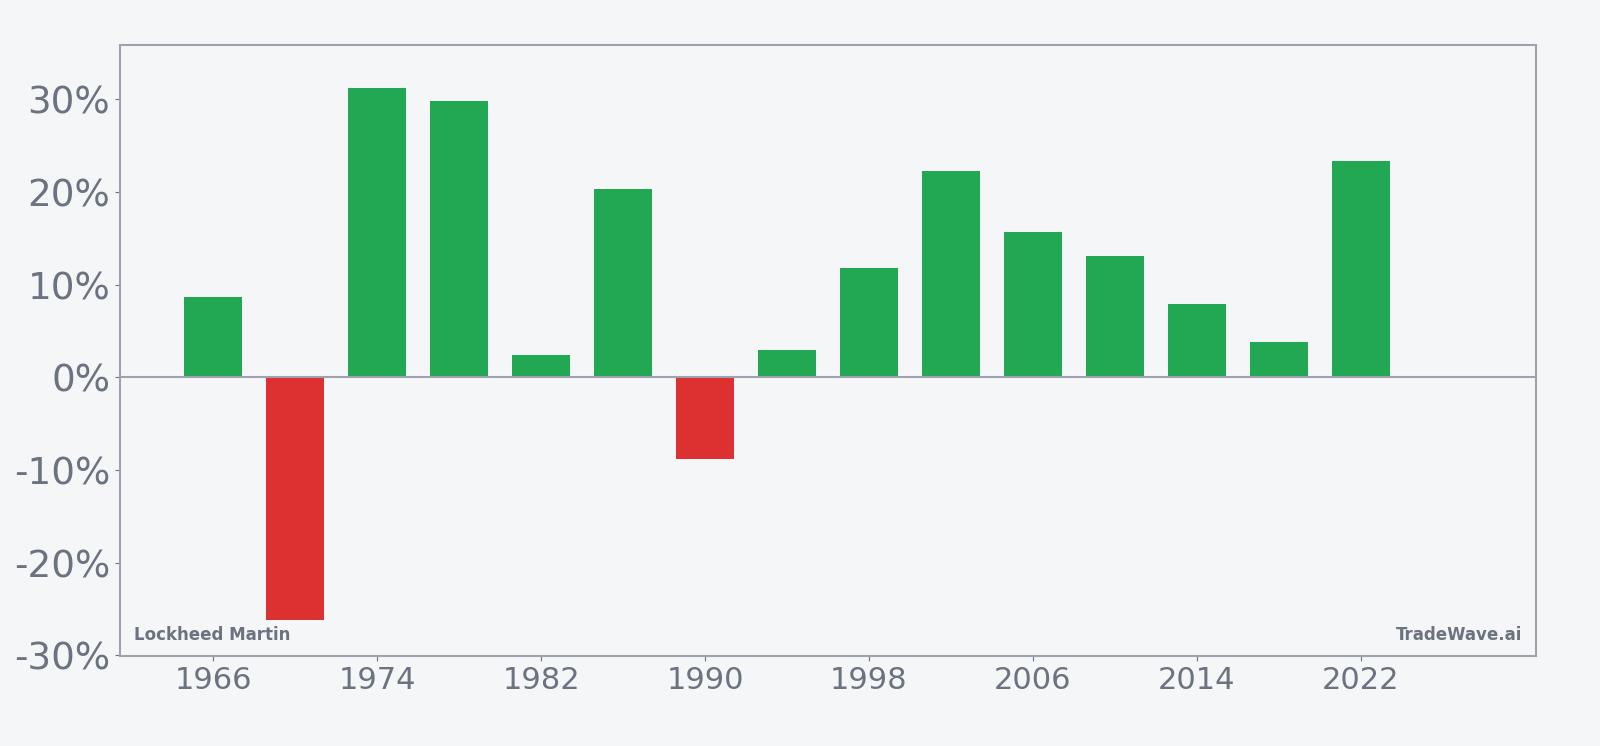
Across the full midterm-year sample, the pattern has a long trade direction, with 87% of years ending higher over the window, including 13 winners and 2 losers. Average gains in winning years are 14.87%, while the average across all years, including the losing ones, is 11%, which points to a positive but not uniform tendency.
The per-year history shows both strong and weak examples. In 2022, for instance, the stock gained 23.34% over the window, with a maximum favorable move of 33.05% and only a -1.05% worst drawdown from the entry, illustrating how powerful the upside can be when the pattern aligns with broader trends. By contrast, 1990 delivered a net loss of -8.87%, with the worst intraperiod decline reaching -17.19%, underscoring that even in a generally constructive window, adverse moves can be deep before any recovery.
A combined view of net returns with peak run-ups and worst drawdowns highlights how upside and downside have interacted inside this window.
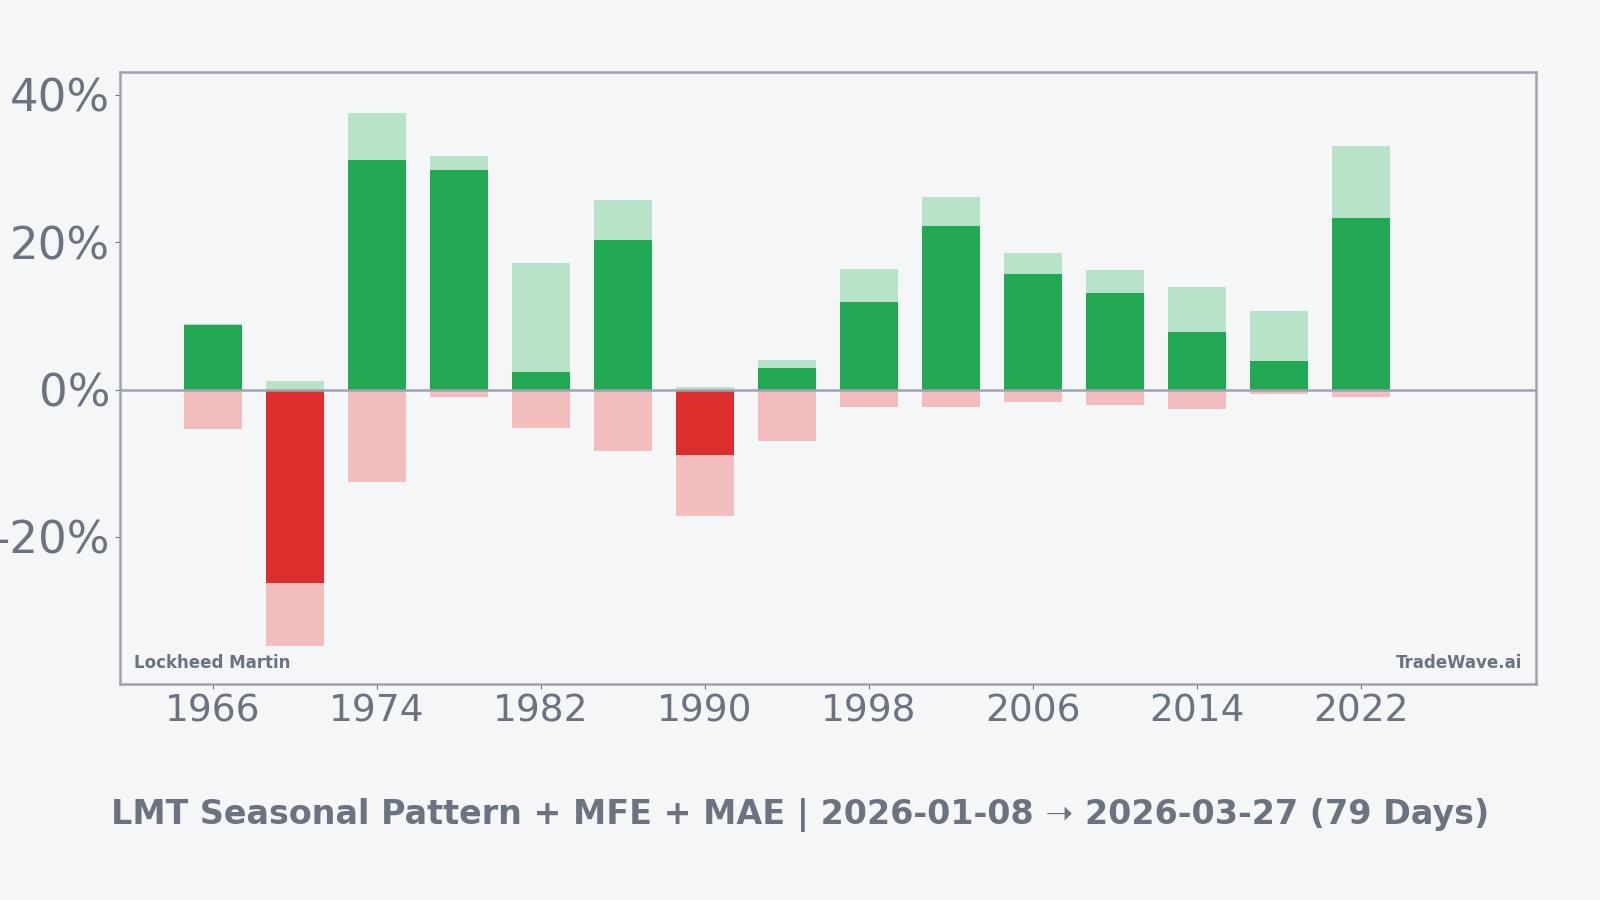
The combined net, maximum favorable move and maximum adverse move profile suggests that in many years the stock has enjoyed sizable rallies within the window, but those gains have sometimes come with notable interim drawdowns. Years like 1986 and 2002 show double-digit net gains with maximum favorable moves above 20% and relatively contained worst declines, while weaker years such as 1990 highlight that the downside can still dominate when macro or company-specific pressures are in play. Taken together, the historical pattern defines the quantitative seasonal backdrop for the current period.
History does not guarantee future results; adverse excursions (MAE) can be large even in winning windows.
Price and near-term drivers
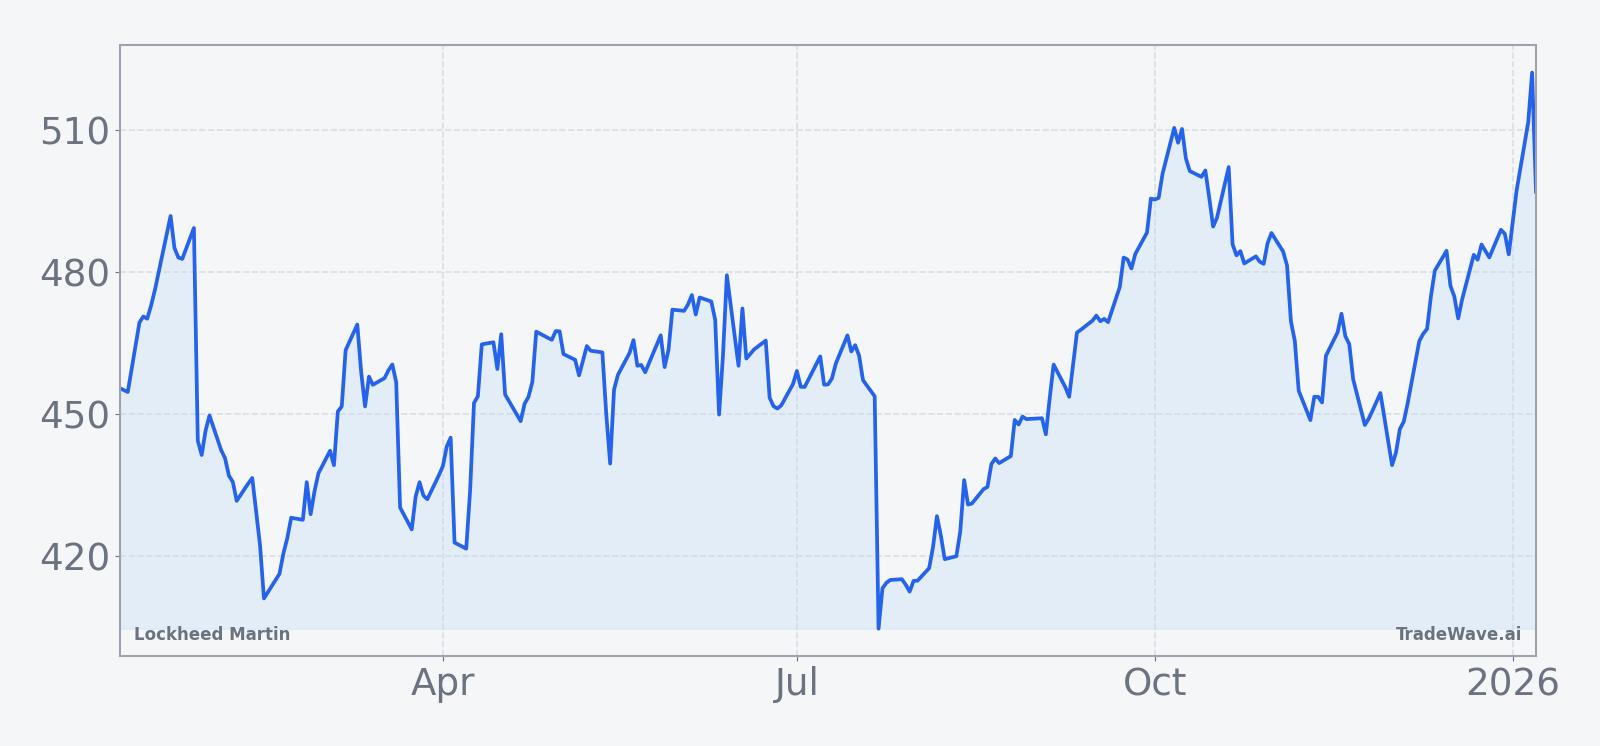
Lockheed Martin shares trade around $487.53 on Jan 8, 2026, up about 0.66% on the day, with the stock starting the year roughly 5.2% below where it ended 2025. That leaves the defense contractor in a modest pullback phase after a volatile 2025 that featured both earnings setbacks and subsequent recovery.
In Oct 2025, the company reported third-quarter results that beat expectations, with adjusted earnings per share of $6.95 on revenue of $18.6 billion, helped by strong demand from U.S. and allied defense customers.[1] Earlier in the year, second-quarter results in Jul 2025 showed an 80% profit drop tied to a $1.6 billion loss on classified programs, which weighed on sentiment and highlighted execution risk in sensitive projects.[5] In Jan 2025, analysis of the stock around $460 pointed to a “Buy” consensus rating and a $515 price target from Forbes’ coverage, framing the name as a core defense holding despite program-specific volatility.[2]
Sector-wide, demand for advanced aircraft, missiles and space systems has remained firm as geopolitical tensions persist and allied governments revisit defense budgets.[1] The macro backdrop described in early 2025 emphasized that an uncertain environment with elevated geopolitical risk could continue to influence Lockheed Martin’s order book and investor appetite for defense exposure.[2] That combination of steady demand and episodic program risk helps explain why the stock can experience sharp swings inside an otherwise constructive seasonal window.
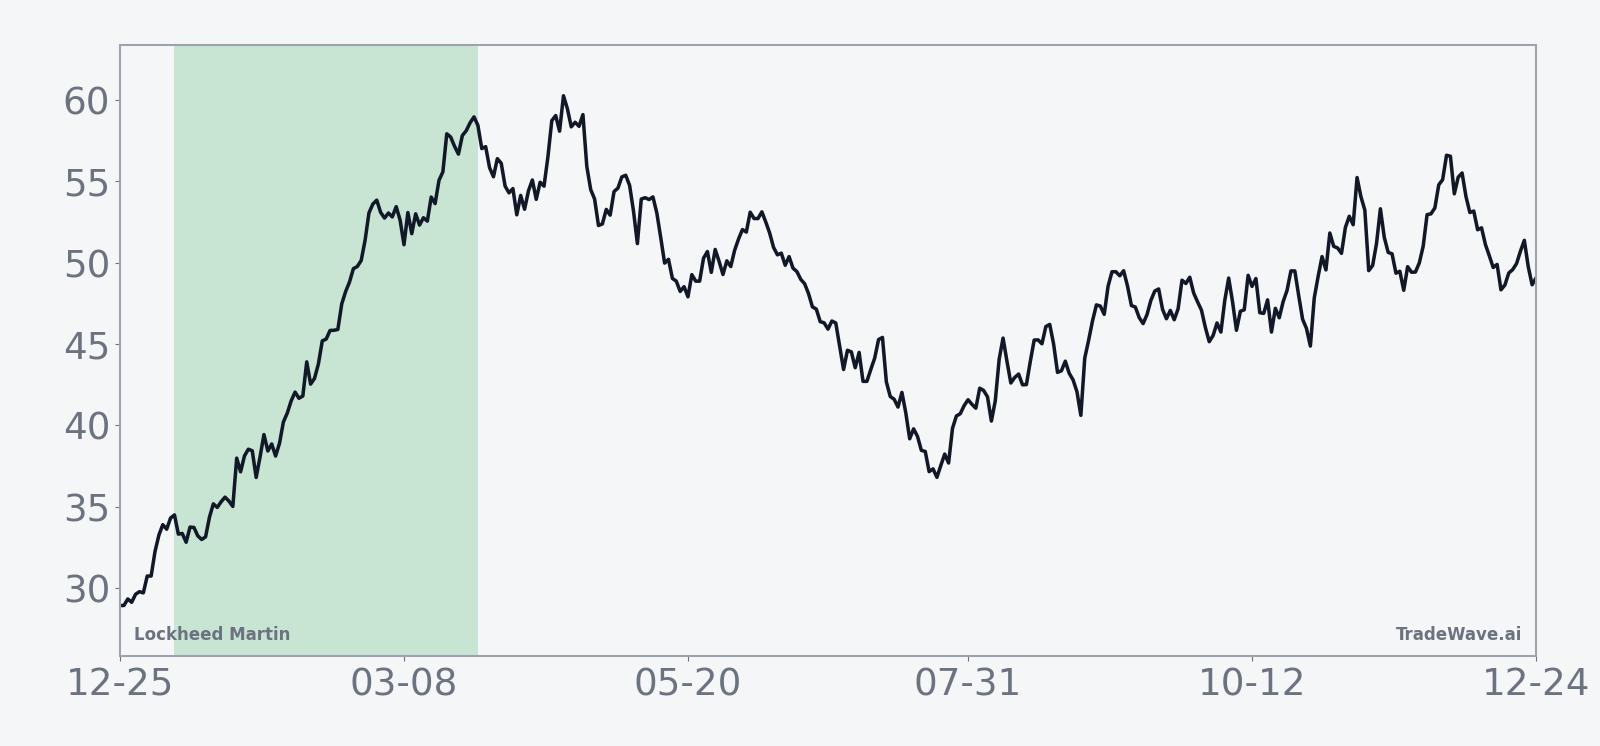
The chart below situates the latest move in its recent multi-month context.
Macro and policy backdrop
For a defense prime like Lockheed Martin, the midterm election year often coincides with contentious budget negotiations and shifting priorities in Congress. While long-term programs such as fighter jets and missile defense systems typically span multiple administrations, annual appropriations and supplemental packages can influence the timing of orders and cash flows, which in turn can interact with seasonal trading patterns.
Reporting in Oct 2025 highlighted that strong demand from U.S. and allied customers continued to support revenue growth, even as the company navigated program-specific challenges.[1] At the same time, commentary in Jan 2025 noted that geopolitical tensions and an uncertain macroeconomic environment could affect how investors value defense earnings streams, particularly when interest rates and fiscal debates are in flux.[2] As the midterm year unfolds, investors will be watching how these policy and macro forces intersect with the historically strong 79-day window that is already in progress.
What to watch in this window
For the remainder of this 79-day stretch, traders and longer-term investors may focus on three broad areas. First, price behavior relative to the historical pattern: sustained strength or orderly pullbacks that respect prior support levels would be more consistent with the long-biased seasonal history, while a sharp break lower resembling 1990’s profile would mark a clear deviation. Second, the policy calendar: developments around U.S. defense budgets, supplemental funding for allies and export approvals could either reinforce or counteract the typical midterm-year tendency, especially if they affect visibility on key programs.[1]
Third, the earnings path: although the next scheduled report date is not yet specified, any updates on classified program losses, margin recovery and 2025 guidance relative to the previously outlined $74.25 billion sales target and EPS range will be important context for how the stock trades inside this window.[1] If results and commentary suggest that the issues highlighted in Jul 2025 are being contained, the historical pattern of strong midterm-year windows could find more fundamental support; if not, the adverse excursions seen in weaker years of the sample offer a reminder that downside volatility has been part of this stretch as well.[5]