Fed Rate Cut Hopes Support S&P 500 SPDR (SPY) Despite Recession Warnings
S&P 500 SPDR is nearing a long seasonal stretch that has delivered steady gains in the past, offering a structured backdrop for investors weighing 2026’s macro risks and equity exposure.

Key takeaways
- A 166-day seasonal window for S&P 500 SPDR begins on Mar 5, 2026 and has historically been a strong period for the ETF.
- The pattern has been profitable in 100% of the past 10 years, with 10 winners and 0 losers over the lookback.
- Average profit across those winning years is 8.71%, with a cumulative gain of 128% and an annualized return of 8.63% for the strategy.
- The trade direction is long, supported by a TradeWave Ratio of 2.59 and a Sharpe ratio of 1.55, indicating historically favorable risk-adjusted returns.
- Intraperiod swings have been meaningful, with some years showing double-digit peak gains but also notable drawdowns before the window closed.
- With 2026 macro risks in focus, this seasonal backdrop offers context for how SPY has tended to behave across similar calendar stretches in prior years.[3]
According to historical data from TradeWave.ai, this upcoming stretch for S&P 500 SPDR has shown a distinct seasonal tendency that stands out from the rest of the year. The following section unpacks how that pattern has played out over the past decade and what it implies for the broader index backdrop.
Seasonal window
This seasonal window begins on 2026-03-05 and spans 166 days. Historically, during this period, S&P 500 SPDR has shown a strong upside tendency, with every year in the past decade finishing the window in positive territory for a long position. With the ETF’s latest price data not yet available for Feb 26, investors are approaching this regime without a precise read on where SPY currently sits versus its 52-week range, but the historical pattern itself is unusually consistent.
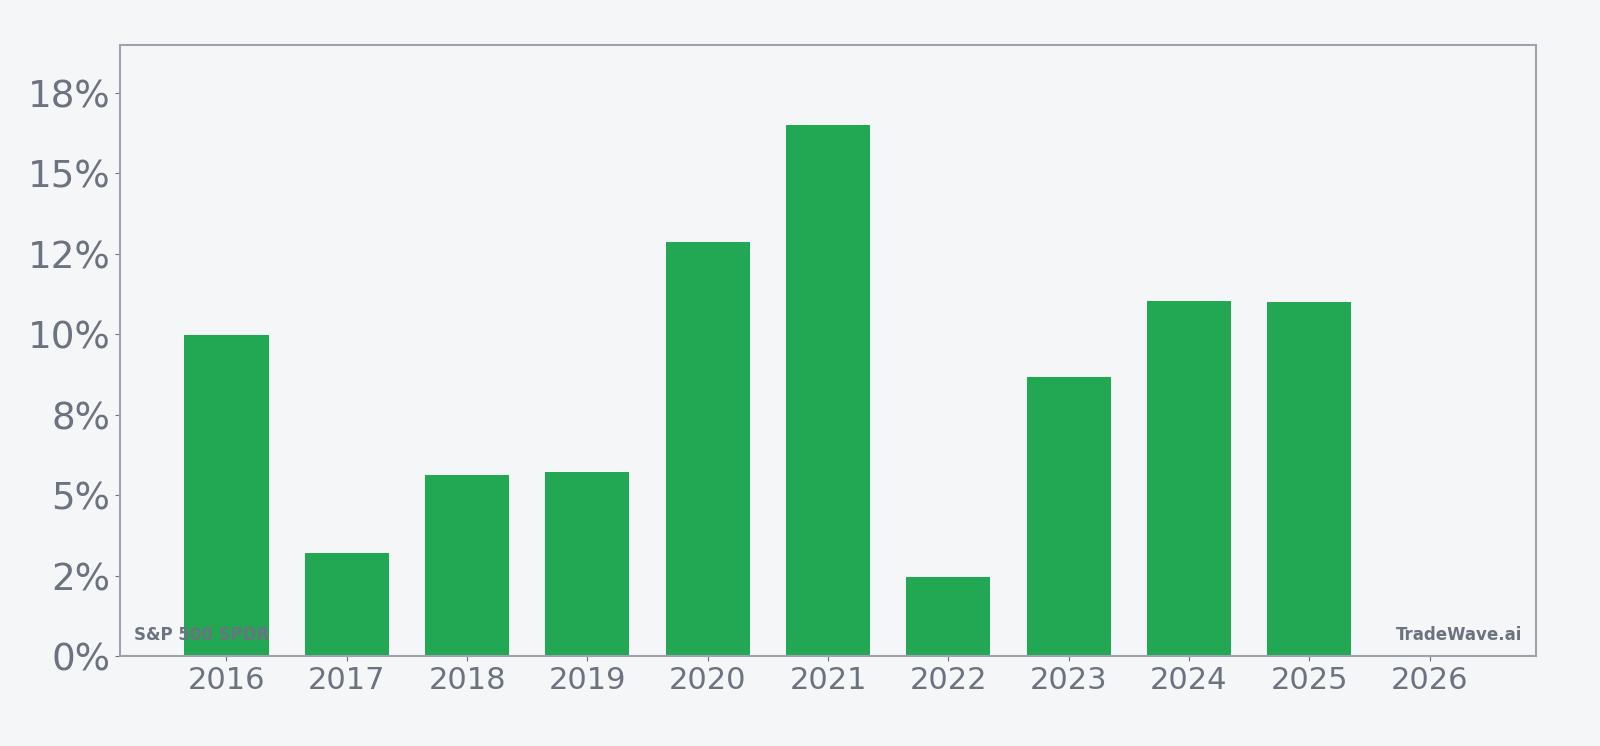
Across the 10-year sample, the strategy of entering S&P 500 SPDR at the start of this window and holding through the full 166 days produced a cumulative return of 128%, with an annualized return of 8.63%. The average profit of 8.71% and median profit of 9.34% suggest that outcomes have clustered reasonably tightly around a mid‑single to high‑single digit gain, rather than being dominated by a single outlier year.
The strongest year in the sample was 2021, when the window delivered a net return of 16.51% for SPY, with a peak run-up of 17.31% and only a shallow worst drawdown of 0.58% from the entry level. At the other end of the spectrum, 2017 was the softest outcome, with a 3.21% net gain and a maximum favorable move of 5.68%, while the worst intraperiod decline from entry was 2.14%, illustrating that even the weakest year in this pattern still finished higher.
Intraperiod volatility, however, has not been trivial. In 2020, the window saw a maximum favorable move of 13.02% but also a maximum adverse move of 27.41% from the entry price, meaning investors who held through the full period ultimately finished with a 12.87% gain but had to tolerate a deep drawdown along the way. A similar dynamic appeared in 2025, when the pattern produced a 10.99% net gain but experienced a 17.12% worst drawdown during the window, underscoring that positive final outcomes have sometimes come with significant interim stress.
The distribution of trend days within the window is relatively balanced, with the long side favored 60% of the time in the broader trend view and 50% in the shorter-term lens, while short‑biased stretches account for the remaining share. That mix suggests that while the end result has consistently been positive for long exposure, the path has often involved alternating phases of strength and consolidation rather than a straight-line climb.

A combined view of net results and intraperiod swings highlights how upside and drawdowns have coexisted in this pattern.
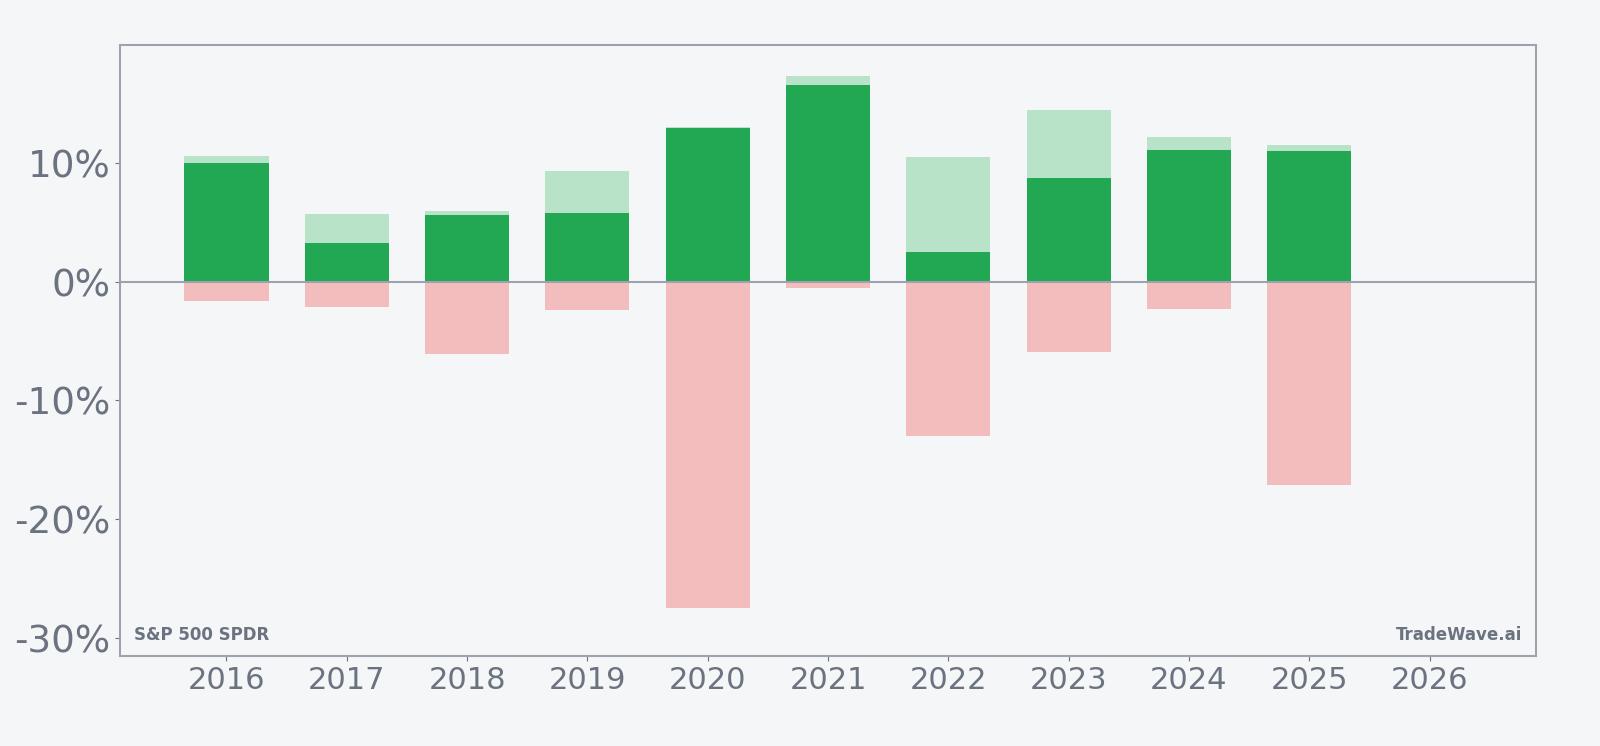
History does not guarantee future results, and the worst intraperiod declines (MAE) in this window have at times been large even when the final outcome was positive.
Taken together, the historical pattern defines the quantitative seasonal backdrop for the upcoming period, framing a window that has tended to reward long exposure in SPY but has also demanded tolerance for volatility along the way.
Price and near-term drivers
Real-time pricing and flow data for S&P 500 SPDR on Feb 26 are not yet available in this dataset, leaving investors without a precise read on today’s move or its distance from recent highs and lows. What is clear from the broader backdrop is that SPY remains the primary vehicle for tracking the S&P 500, concentrating large‑cap U.S. equity risk in a single, highly liquid ETF that often serves as the market’s reference point for risk appetite.
In 2025, the S&P 500 navigated a complex macro environment that included concerns about a potential U.S. recession and projected layoffs, even as the index ultimately pushed higher over the course of the year.[4] Analysis at the time suggested that leading economic indicators were flashing warning signs, raising the prospect that any equity strength could be vulnerable to macro disappointments. For SPY holders, that tension between economic data and price action remains a key consideration as 2026 unfolds.
At the same time, some strategists argued in 2025 that anticipated Federal Reserve rate cuts could support U.S. equities, albeit with more muted gains than in past easing cycles.[6] That view framed SPY as a beneficiary of easier policy, but with expectations tempered by already elevated valuations and the long duration of the post‑pandemic bull market. If the Fed follows through on a gradual path of cuts, the historical seasonal tailwind starting in early March could intersect with a policy backdrop that is supportive but not exuberant.
Macro risk remains a central theme for 2026. In December 2025, Apollo Global Management highlighted five downside scenarios for the year ahead, ranging from growth disappointments to policy missteps that could unsettle markets.[3] For investors using SPY as a core holding, those scenarios underscore the importance of understanding not just valuation and earnings, but also how the ETF has behaved across similar calendar stretches when macro uncertainty was elevated.
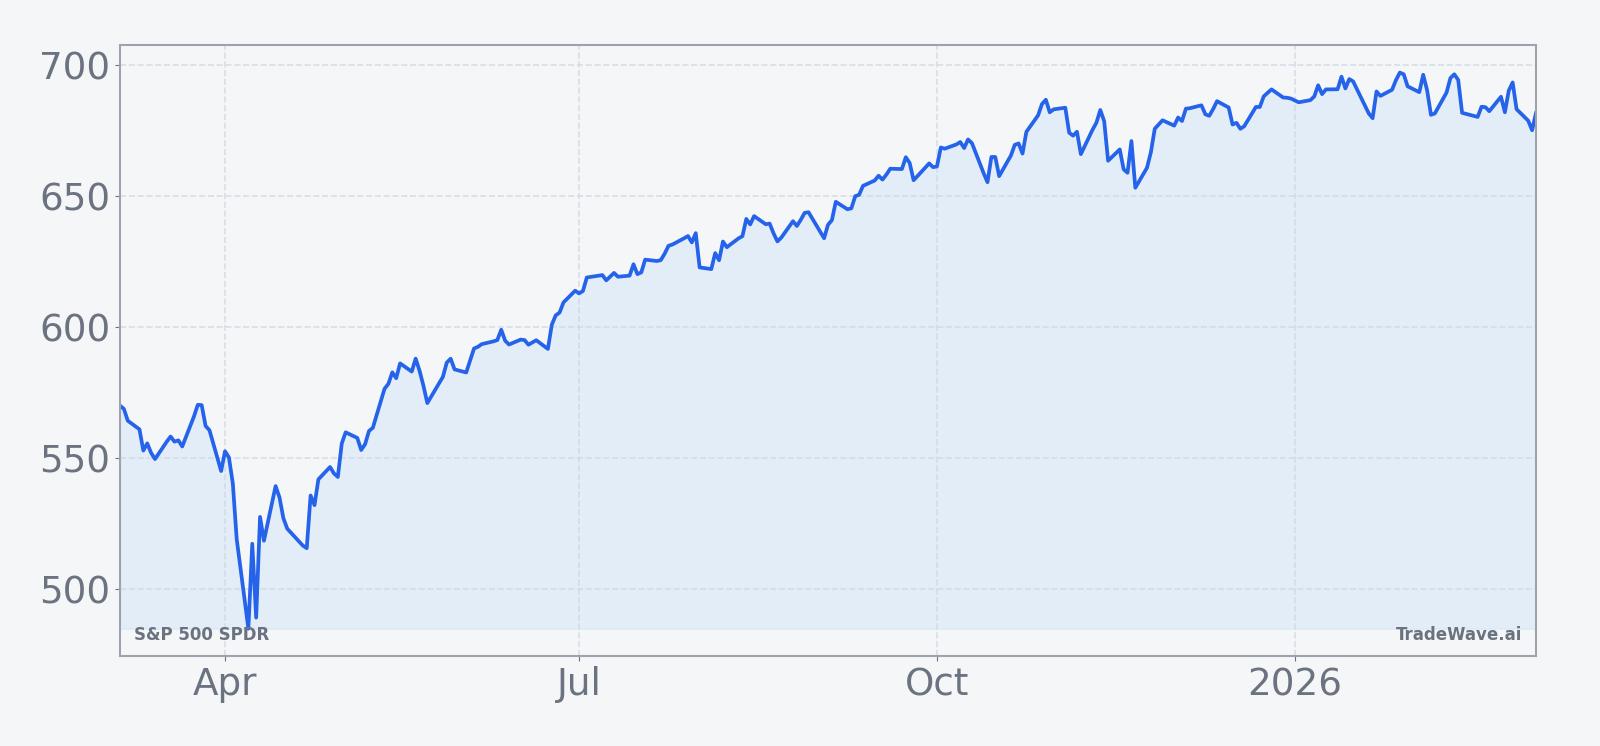
The chart below situates SPY’s recent path over the past year, providing context for where the ETF stands as it approaches the new seasonal regime.
Macro backdrop and SPY’s role
SPY’s seasonal pattern cannot be viewed in isolation from the macro forces that have shaped the S&P 500 in recent years. In October 2025, analysis of a brief U.S. government shutdown concluded that the direct impact on equities was limited, with the S&P 500 actually rising 1.1% around the episode.[1] That experience reinforced a longer‑running theme: many headline political events have produced more noise than lasting trend shifts for broad index trackers like SPY.
Other macro signals have been more consequential. Commentary in mid‑2025 pointed to unusual behavior in the S&P 500 around early July, with technical analysts flagging that the index’s pattern deviated from typical seasonal norms.[8] Separate work later that year argued that “the signals are clear” for the S&P 500, emphasizing the importance of technical levels and trend structure in a market that had already priced in a great deal of good news.[9] For SPY, which mechanically mirrors the index, such technical inflection points can matter as much as macro headlines.
Investors also faced a steady drumbeat of commentary about potential upside and downside extremes. A May 2025 article framed the S&P 500 as offering a “1,000% profit opportunity,” highlighting the degree of leverage and risk some market participants were willing to contemplate late in the cycle.[10] While such views sit at the speculative end of the spectrum, they illustrate how sentiment around SPY can swing between caution and exuberance, even as the ETF itself tracks a diversified basket of large‑cap stocks.
Currency markets and trade policy have added another layer of complexity. In July 2025, analysts warned that currency markets were signaling alarm as a tariff deadline approached, raising the prospect of spillovers into equities if trade tensions escalated.[13] For SPY, which aggregates exposure across sectors sensitive to global trade, such episodes can inject volatility that interacts with, but does not necessarily override, the underlying seasonal tendencies.
How investors use SPY around this window
S&P 500 SPDR remains one of the most widely used instruments for gaining or hedging U.S. equity exposure, and the upcoming seasonal window often coincides with key points in the investment calendar. The 166‑day stretch starting in early March typically spans the end of the first quarter, the bulk of second‑quarter earnings, and much of the third quarter, a period when asset allocators reassess risk budgets and rebalance portfolios.
Because SPY tracks the S&P 500 on a market‑cap‑weighted basis, its behavior in this window is heavily influenced by mega‑cap technology, communication services, and consumer names that dominate the index. When those sectors lead, the seasonal pattern’s historical upside can be amplified; when they lag, the same window can still finish positive but with a more muted profile, as seen in years like 2017 and 2019 where gains were mid‑single digits.
Fees and tracking considerations are relatively straightforward for SPY, which is designed to closely follow the S&P 500 before expenses. For investors layering the seasonal pattern on top of strategic holdings, the main questions tend to revolve around position sizing, hedging, and whether to adjust exposure at the margins as the window opens and progresses, rather than around structural ETF frictions.
What to watch as the window opens
As the 166‑day seasonal window begins on Mar 5, investors will be watching how SPY trades relative to its recent range and to key technical levels highlighted in prior S&P 500 analyses.[8][9] A pattern of higher highs and higher lows early in the window would be consistent with the historical tendency toward positive outcomes, while a failure to hold support or a sharp break lower would signal that macro forces are overwhelming the usual seasonal rhythm.
Macro catalysts will also be critical. Any shift in expectations around Federal Reserve policy, particularly the timing and pace of potential rate cuts, could influence how closely SPY’s path tracks its historical seasonal profile.[6] Likewise, developments around the macro risks flagged for 2026, including growth and policy uncertainties, may determine whether volatility within the window resembles the deeper drawdowns seen in years like 2020 and 2025 or the smoother climbs of 2016 and 2021.[3]
Flows into and out of broad U.S. equity ETFs will provide another signal. While specific flow data for SPY are not included in this dataset, investors often monitor primary‑market creations and redemptions, as well as options positioning, to gauge whether institutional money is leaning into or away from index exposure as the seasonal regime unfolds. Persistent inflows would align with the pattern’s long‑biased history, whereas sustained outflows could foreshadow a more challenging path even if the final outcome remains positive.
Ultimately, the historical record suggests that this upcoming window has been a constructive one for long SPY exposure, but with enough intraperiod turbulence to test conviction. How the ETF behaves around major macro announcements, technical inflection points, and shifts in risk appetite will determine whether 2026 joins the list of years that followed the seasonal script closely or becomes one of the outliers that remind investors why past patterns are a guide, not a guarantee.
Sources
- [1] Seeking Alpha, “Four things for stock bulls to worry about other than the shutdown,” Oct 5, 2025.
- [2] Seeking Alpha, “Catalyst Watch: Spotlight on Nvidia, Alibaba, PCE inflation read, and the return of Bed Bath & Beyond,” Aug 22, 2025.
- [3] Seeking Alpha, “Top 5 macro and market risks for 2026 - Apollo,” Dec 4, 2025.
- [4] Seeking Alpha, “The U.S. Is In Recession: 1 Million Layoffs In 2025 And LEI Data Says It All,” Oct 6, 2025.
- [5] The Motley Fool, “2 High-Yield Dividend ETFs to Buy With $100 and Hold Forever,” Jul 12, 2025.
- [6] Seeking Alpha, “Fed rate cuts likely to support U.S. equities, but with muted gains: BMO’s Belski,” Sep 14, 2025.
- [7] Yahoo Finance, “Lucid CEO: 'Not where we want to be' with Gravity SUV ramp; 'volume' will eventually solve profitability issues,” Aug 6, 2025.
- [8] Seeking Alpha, “S&P 500: This Is Unusual, Week Starting 7th July (Technical Analysis),” Jul 6, 2025.
- [9] Seeking Alpha, “S&P 500: The Signals Are Clear (Technical Analysis),” Oct 26, 2025.
- [10] Forbes, “A 1,000% Profit Opportunity With The S&P 500?,” May 28, 2025.
- [13] Seeking Alpha, “Currency Markets Signal Alarm As July 9 Tariff Deadline Looms,” Jul 6, 2025.