Big Tech Q4 Earnings Beat Expectations but AI Capex Clouds Outlook for Nasdaq QQQ Invesco ETF (QQQ)
Nasdaq QQQ Invesco ETF is heading toward a spring-to-late-summer stretch that has delivered robust gains over the past decade, just as Big Tech earnings and AI spending reshape expectations for the Nasdaq 100.

Key takeaways
- Nasdaq QQQ Invesco ETF enters a 161-day seasonal window starting Mar 5 that has historically been strongly positive for long positions.
- Across the past 10 years, this window was profitable in 100% of cases, with 10 winners and 0 losers and an average gain of 13.06% per year.
- The pattern shows sizable upside potential, reflected in a TradeWave Ratio of 2.17 and an annualized return of 12.75% during the window.
- Intraperiod swings have been meaningful, with several years showing double-digit peak drawdowns even as the window ultimately finished higher.
- The window overlaps a period when QQQ’s tech-heavy exposure ties performance closely to Big Tech earnings and AI capital spending trends.[5][7][9]
According to historical data from TradeWave.ai, this upcoming stretch for Nasdaq QQQ Invesco ETF has displayed a remarkably consistent seasonal pattern over the past decade. The next section looks at how that pattern has behaved and what it suggests about the backdrop for QQQ in the months ahead.
Seasonal window
This seasonal window begins on Mar 5, 2026 and spans 161 trading days. Historically, during this period, Nasdaq QQQ Invesco ETF has shown a strong upside tendency for long positions, with gains clustering from early spring into late summer.
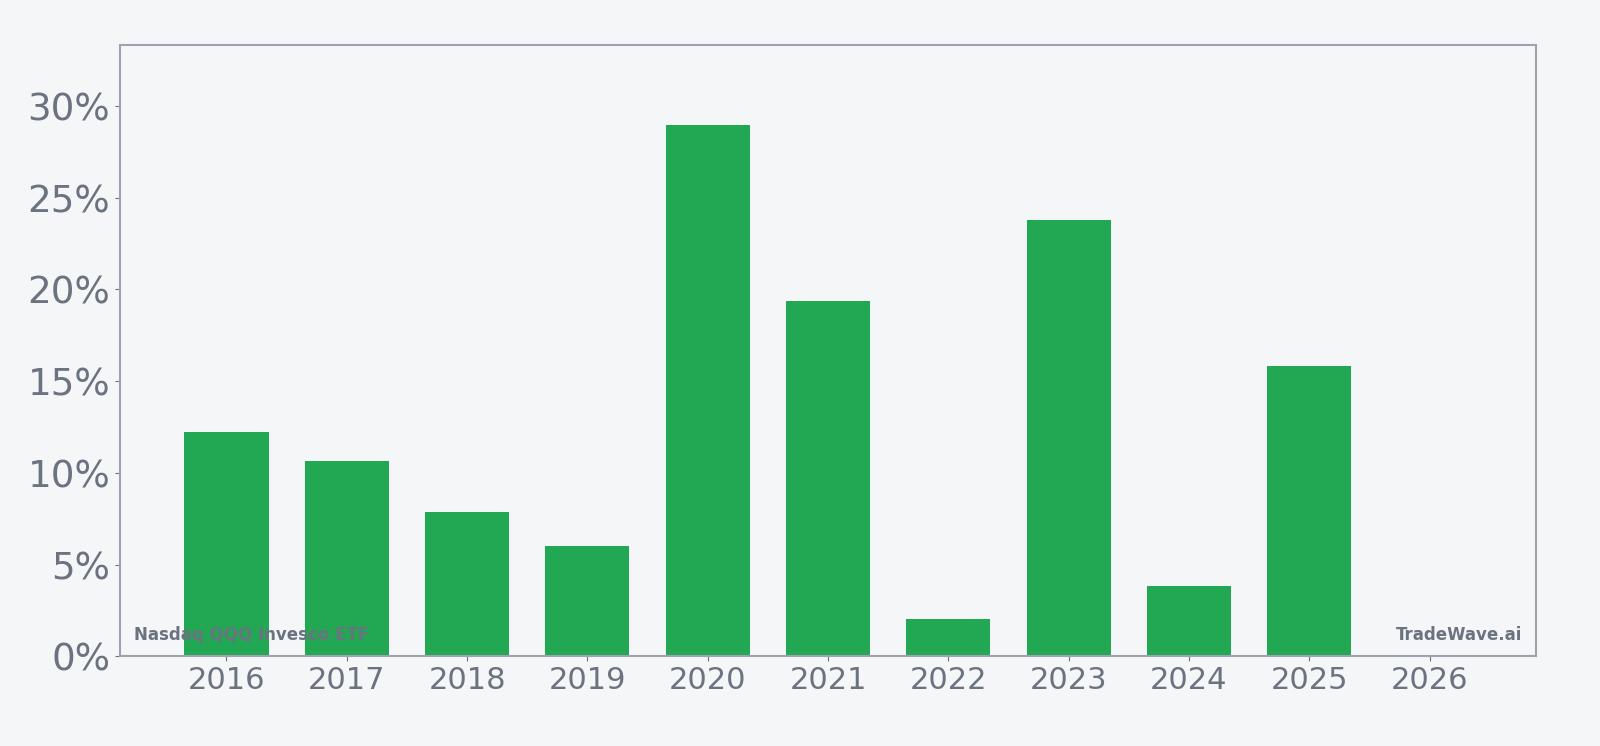
Across the 10-year sample, the trade direction for this pattern is explicitly long, and every single year finished the window with a positive net return. The Percent Profitable reading of 100%, with 10 winners and 0 losers, means that in this specific calendar stretch QQQ has not produced a losing outcome in the past decade, although the size of those gains has varied from a modest 2.02% in 2022 to a surge of 28.98% in 2020.
The average profit of 13.06% reflects the mean gain across all 10 years, while the median profit of 11.43% shows that half of the outcomes were above that level and half below. Because there were no losing years in this sample, the average profit across all years is effectively the same as the average profit in winning years, and the reported average loss of 0% simply indicates that no year in this window closed in negative territory.
The volatility profile is meaningful. The standard deviation of 8.86% and a Sharpe ratio of 1.28 suggest that returns have been relatively strong compared with their variability, but not without risk. The TradeWave Ratio of 2.17 indicates that, within the window, QQQ has typically traveled a substantial distance in the trade direction, highlighting that intraperiod rallies can be significantly larger than the final close-to-close gain.
Looking at individual years, the maximum favorable move, or peak run-up from the entry point, has often exceeded the final net return. In 2023, for example, QQQ’s net gain of 23.8% came alongside a maximum favorable excursion of 29.7%, while in 2020 the ETF posted a 28.98% net gain with a 30.46% peak run-up. On the downside, the maximum adverse move, or worst drawdown from entry, has at times been sharp, including a 21.89% intraperiod drop in 2020 and a 19.72% drawdown in 2025, even though both years ultimately finished the window higher.
The weakest net outcome in the sample, 2.02% in 2022, still came with a 14.6% peak run-up and a 17.01% worst drawdown, underscoring that even the “soft” years in this window have featured sizable swings in both directions. By contrast, steadier years such as 2017 and 2021 combined double-digit gains of 10.63% and 19.35% with relatively contained adverse moves of 0.81% and 2.97% respectively, illustrating how the same calendar stretch can alternate between trending and choppy regimes.
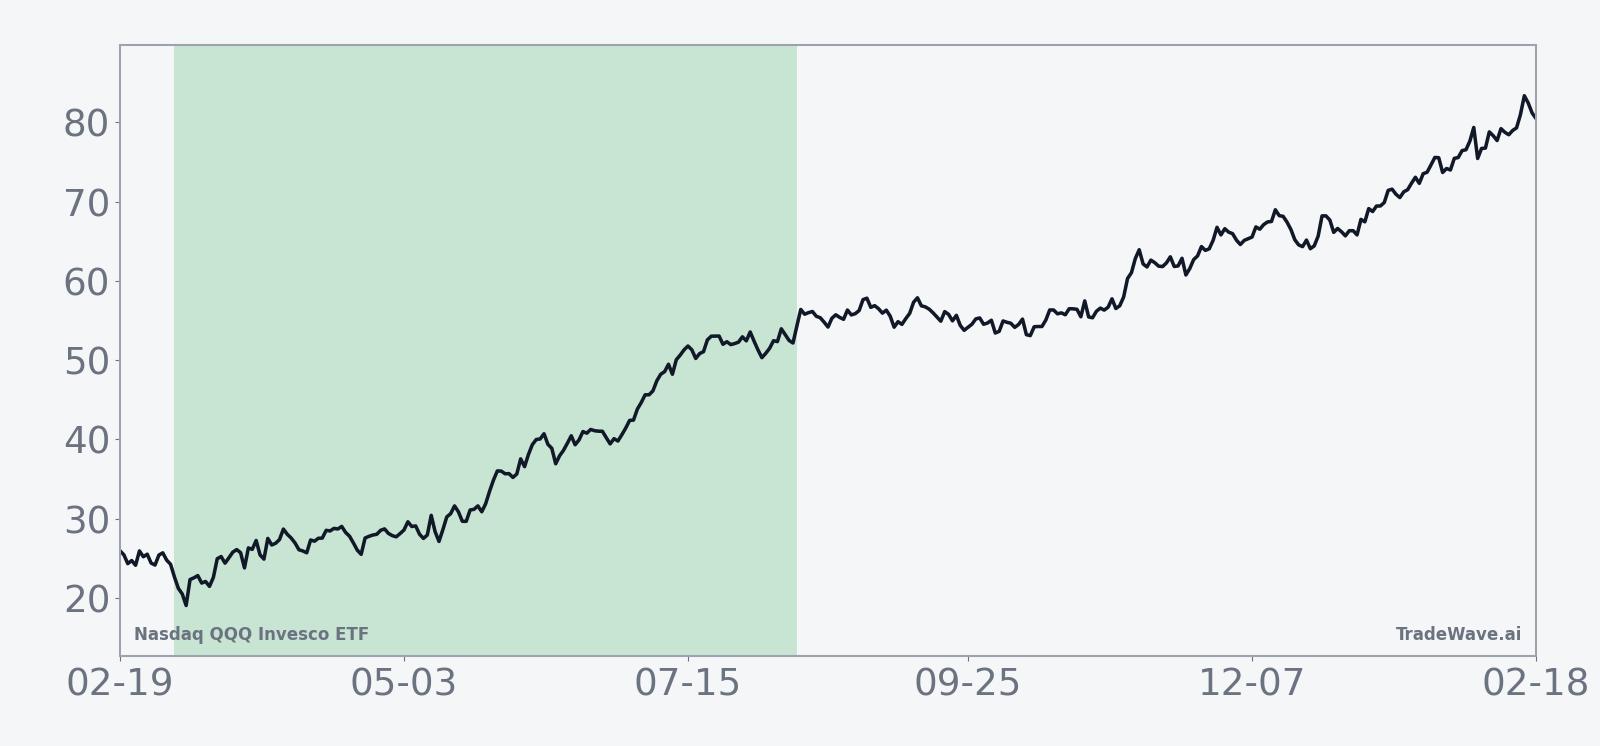
The historical seasonal average suggests that gains in this window tend to build progressively rather than arriving in a single burst, with the cumulative profile rising over time and relatively few instances of prolonged stagnation. The cumulative return of 232% across the decade highlights how repeated double-digit gains in this specific stretch have compounded into a substantial long-term effect.
A combined view of yearly net results alongside peak rallies and worst drawdowns helps frame both the opportunity and the risk.
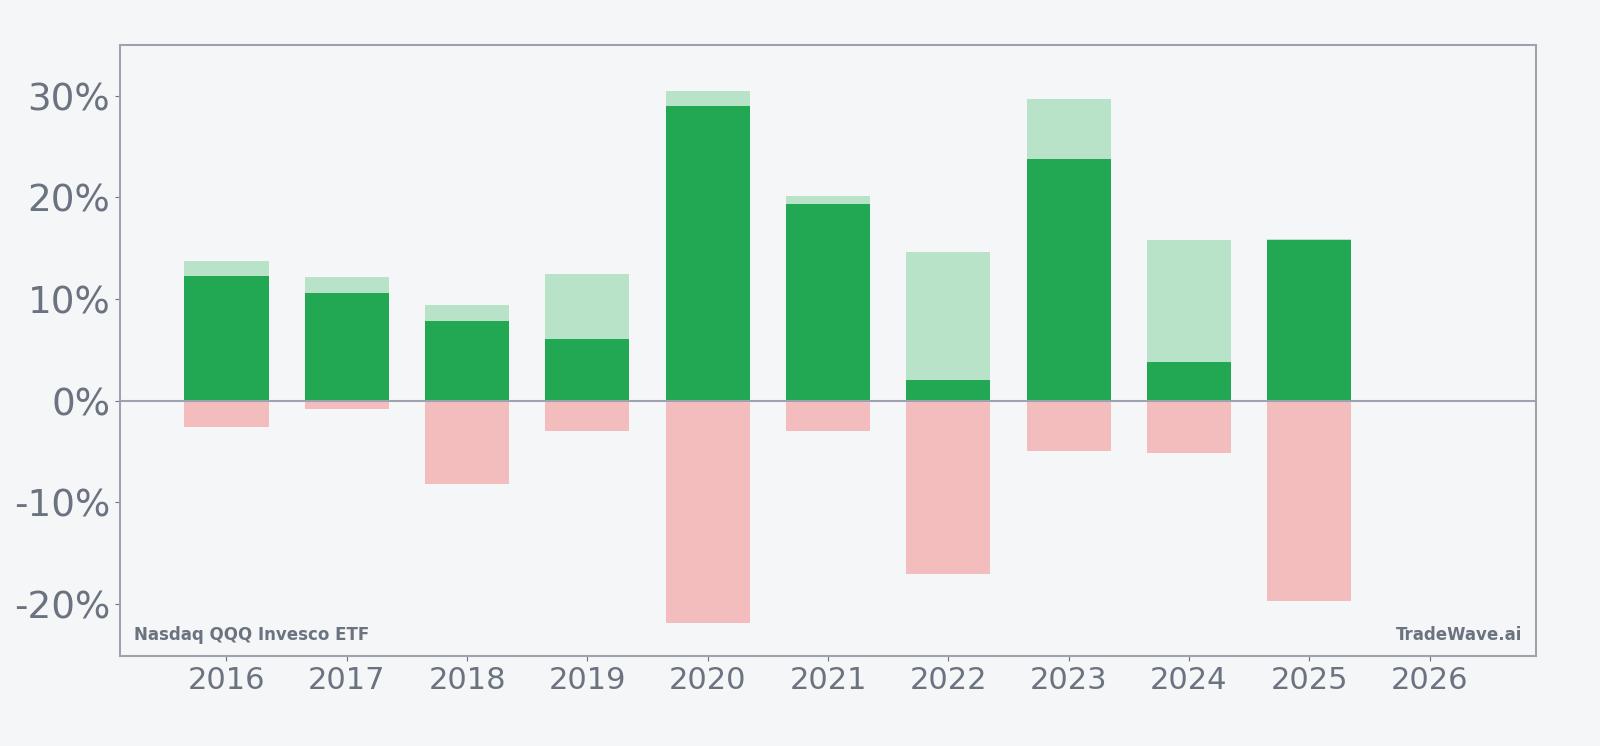
History does not guarantee future results, and the worst intraperiod drawdowns in this window have at times been large even in years that ultimately finished higher.
Taken together, the historical pattern defines the quantitative seasonal backdrop for the upcoming period, pointing to a window that has often rewarded long exposure in QQQ but has also featured meaningful volatility along the way.
Price and near-term drivers
Nasdaq QQQ Invesco ETF tracks the Nasdaq 100 index, giving investors concentrated exposure to large-cap growth and technology names that have dominated market performance in recent years.[8][9] The ETF’s behavior is closely tied to the fortunes of the so-called Magnificent 7 and other mega-cap tech stocks, which together account for a substantial share of its weight and have been central to the market’s AI-driven narrative.[1][5][9]
In late January, results from U.S. megacap companies were a key test of the market’s enthusiasm for the tech trade and optimism on profits, with investors scrutinizing whether earnings could keep pace with elevated expectations.[5] By early February, fourth-quarter earnings from Big Tech had largely beaten forecasts, but high capital spending on artificial intelligence infrastructure introduced new questions about how sustainable margins and free cash flow would be, a dynamic that feeds directly into sentiment around QQQ.[7]
That tension between strong reported results and heavy AI investment has become a defining macro theme for tech-heavy ETFs. Commentary in February highlighted how AI-led growth continues to drive performance in vehicles like QQQ, with significant upside potential noted for companies that can translate spending into durable revenue and profit growth.[2][9] At the same time, the scale of AI-related capital expenditure has raised the bar for future earnings seasons, increasing the sensitivity of QQQ to any sign that demand or pricing power is slipping.[5][7]
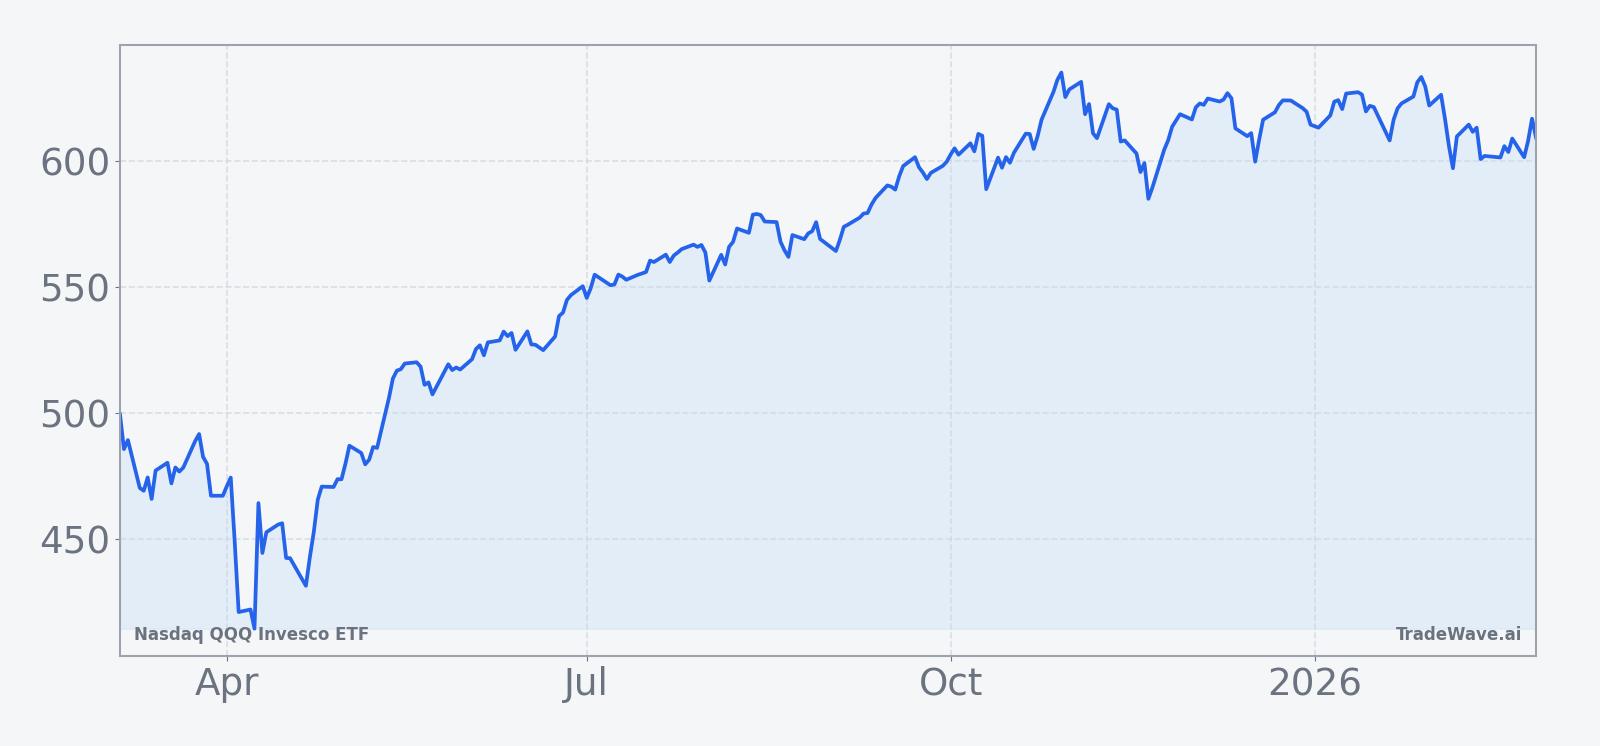
The chart below situates QQQ’s recent trading within its broader 12‑month path, capturing how the ETF has navigated the AI and Big Tech earnings cycle.
Macro backdrop and sector exposure
QQQ’s sector mix leaves it particularly exposed to shifts in technology leadership and investor appetite for growth stocks. The ETF is heavily tilted toward technology and communication services, with performance closely tied to the largest platform and semiconductor companies that have been central to the AI build-out.[1][3][9][12] When enthusiasm for AI accelerates, QQQ has tended to benefit disproportionately; when concerns about valuations or spending emerge, it can also be among the first vehicles to feel the impact.
In October 2025, for example, QQQ was cited as a top performer with a 4.8% gain for the month, exceeding yearly resistance levels and underscoring how quickly sentiment can swing in favor of tech-heavy benchmarks when macro conditions and earnings align.[8] Technical analysts have also highlighted key support levels in QQQ as volatility has picked up, pointing to areas on the chart where buyers have historically stepped in during pullbacks.[9] Those levels can become especially important reference points during the upcoming seasonal window, when historical data suggest that both rallies and drawdowns can be amplified.
Beyond pure price action, flows into and out of QQQ and similar ETFs often act as a barometer for broader risk appetite. While specific flow figures were not detailed in the recent research, the ETF’s role as a primary vehicle for expressing views on Big Tech means that macro developments such as changes in interest-rate expectations, regulatory headlines, or shifts in AI investment plans can quickly translate into allocation decisions at the ETF level.[2][5][7]
What to watch as the window opens
As the 161-day seasonal window begins in early March, investors will be watching how QQQ trades around key technical levels that have previously acted as support or resistance, particularly if volatility picks up again.[8][9] Behavior in the first several weeks of the window will be important: in prior years, strong early performance has often set the tone for the rest of the period, while deeper early drawdowns have tended to coincide with more volatile full-window outcomes.
Macro and earnings catalysts will remain central. Upcoming commentary from Big Tech on AI capital spending, cloud demand, and advertising trends will feed directly into expectations for the Nasdaq 100 and, by extension, QQQ.[5][7][9] If companies continue to deliver earnings that justify elevated investment in AI infrastructure, the historical seasonal tendency toward strength could find a supportive fundamental backdrop. Conversely, any sign that spending is outpacing revenue growth could test the resilience of the pattern.
Finally, traders may monitor how QQQ’s performance compares with broader benchmarks and sector peers during the window. Historically, this stretch has been one in which tech leadership can reassert itself, but the presence of sizable intraperiod drawdowns in past years is a reminder that even strong seasonal regimes can involve sharp reversals. How QQQ behaves around those swings, and whether buyers step in at previously identified support zones, will help indicate whether the current year is tracking closer to the smoother historical uptrend or to the more volatile episodes seen in 2020, 2022, and 2025.[5][7][8][9]
Sources
- [1] Seeking Alpha, “Top ETFs with heavy exposure to Magnificent 7 stocks as big tech week lies ahead,” Oct 24, 2025.
- [2] Forbes, “How To Play ‘AI Panic 2.0’ For 8%+ Dividends,” Feb 21, 2026.
- [3] Seeking Alpha, “Meta starts testing self-developed AI training chip - report,” Mar 11, 2025.
- [4] Seeking Alpha, “Tracking Trump's bond purchases this year,” Aug 20, 2025.
- [5] Reuters, “US megacap results to test market's tech trade, profit optimism,” Jan 28, 2026.
- [6] Yahoo Finance, “Hershey to raise chocolate prices as cocoa costs remain high,” Jul 22, 2025.
- [7] Forbes, “Q4 Earnings Beat, But AI Capex Clouds Big Tech Outlook,” Feb 8, 2026.
- [8] Forbes, “Another Record-Beating Month Ahead?,” Oct 31, 2025.
- [9] CNBC, “These are the support levels in QQQ ETF to look for as volatility picks up, according to the charts,” Oct 14, 2025.
- [10] MarketBeat, “Andrada Mining (LON:ATM) Trading Down 8.4% - Time to Sell?,” Jan 16, 2026.
- [11] MarketBeat, “AQR Capital Management LLC Has $40.96 Million Stake in Taiwan Semiconductor Manufacturing Company Ltd. $TSM,” Sep 10, 2025.
- [12] CNBC, “An impulse move higher is beginning in this big bank stock, according to the charts,” Oct 30, 2025.