Trump Tariff Threats Revive Market Fear, CBOE Volatility Index (VIX) Surges Above 40
CBOE Volatility Index is hovering near 18 ahead of a 130-day stretch that has often seen implied volatility grind lower, a pattern equity traders will weigh against concerns that markets may be too calm.
Key takeaways
- CBOE Volatility Index is approaching a 130-day seasonal window starting Mar 6 that has historically favored lower volatility levels.
- The pattern has a short trade direction, with 100% of the past 10 years finishing lower over this window and 10 winners versus 0 losers.
- Average profit for the short side across those years was 23.95%, highlighting a persistent tendency for volatility to compress during this stretch.
- The TradeWave Ratio of 3.05 indicates that VIX has typically moved meaningfully in the trade direction within the window, even before final outcomes.
- Historical best and worst intraperiod swings show that volatility spikes have occurred inside the window, but have usually reversed into lower closes by the end.
- With VIX near 18 and some traders already warning that markets look unusually calm, this seasonal backdrop could shape how investors hedge equity risk into midyear.[12]
According to historical data from TradeWave.ai, the coming months line up with a distinct volatility pattern that has repeated across the past decade. The next section looks at how that seasonal backdrop has behaved and what it could mean for the CBOE Volatility Index this year.
Seasonal window
This seasonal window begins on Mar 6, 2026 and spans 130 trading days. Historically, during this period, CBOE Volatility Index has shown a consistently weak directional tendency, with volatility levels tending to drift lower by the end of the window. Today VIX sits at 17.93, down 8.3% from the prior close, leaving it in the high teens and well below the crisis spikes seen during past macro shocks.[6] For equity markets, that kind of implied-volatility backdrop has often coincided with steadier index behavior, since volatility typically compresses when stocks are well supported and expands when risk-off episodes hit.
Across the past 10 years, every instance of this March-to-midyear window has ended with VIX lower, consistent with the short trade direction. Percent Profitable stands at 100%, with 10 winners and 0 losers, and the average profit for those short-volatility outcomes is 23.95%. That combination of a perfect win record and a mid-20s average decline in the index defines this as a historically soft stretch for implied volatility rather than a mixed or choppy regime.
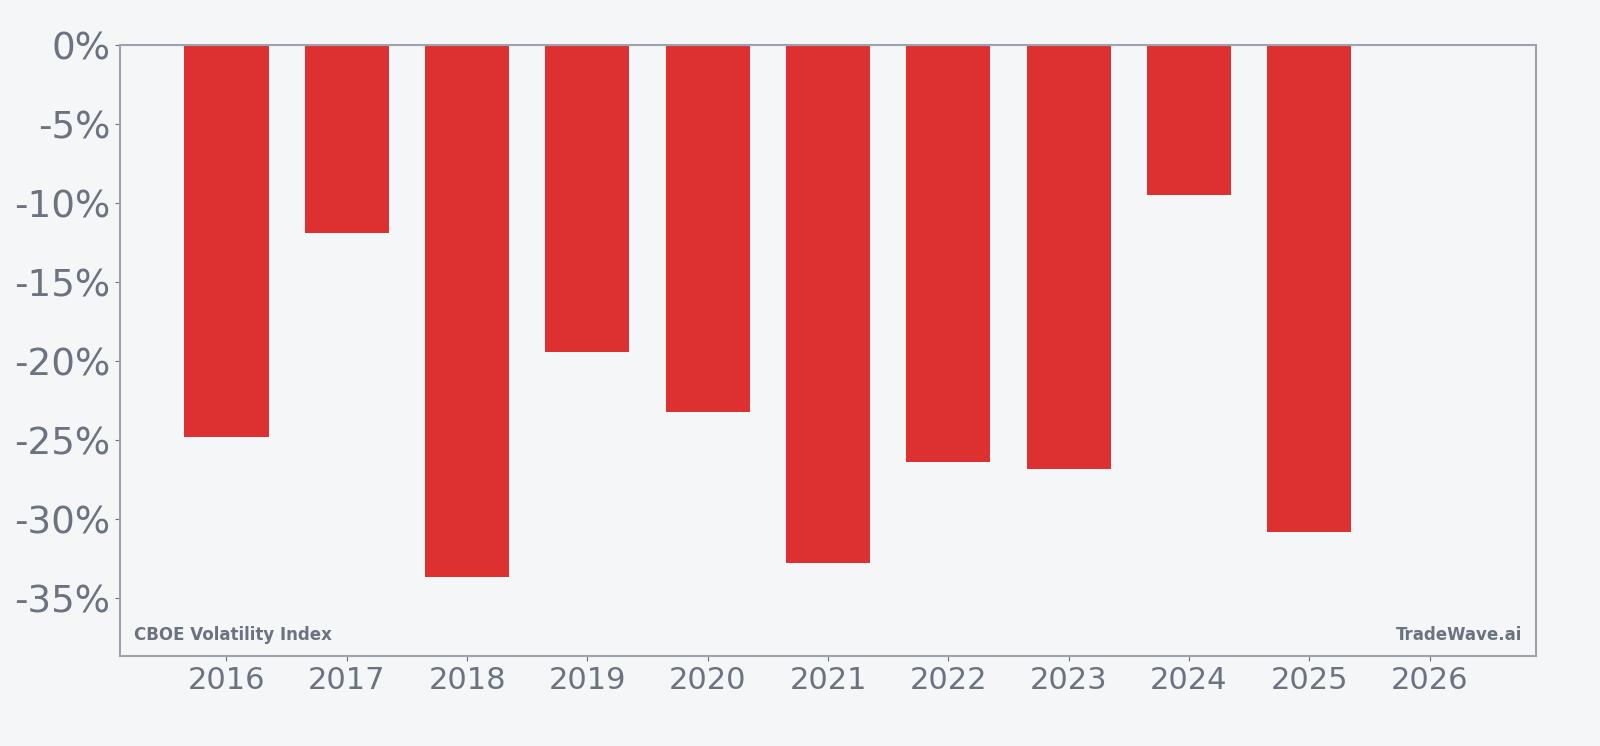
The distribution of individual years shows that some of the strongest declines came in 2018 and 2021, when end-of-window net returns were around minus 33.66% and minus 32.78% respectively, while the smallest decline was in 2024 at minus 9.52%. In other words, even the weakest year for the pattern still saw VIX finish the window lower than it began. For traders who focus on volatility products, that consistency matters because it suggests that, in prior cycles, rallies in VIX during this period have tended to fade rather than persist into sustained high-volatility regimes.
The historical seasonal trend chart suggests that much of the typical decline in VIX during this window has accrued gradually rather than in a single sharp move. On average, the index has tended to hold up or even spike early in the window before grinding lower into the later weeks, a pattern that aligns with episodes where early-spring macro scares gave way to calmer summer trading conditions.
A closer look at yearly net returns alongside best and worst intraperiod swings highlights how volatility spikes and drawdowns have coexisted within this otherwise weak seasonal stretch.
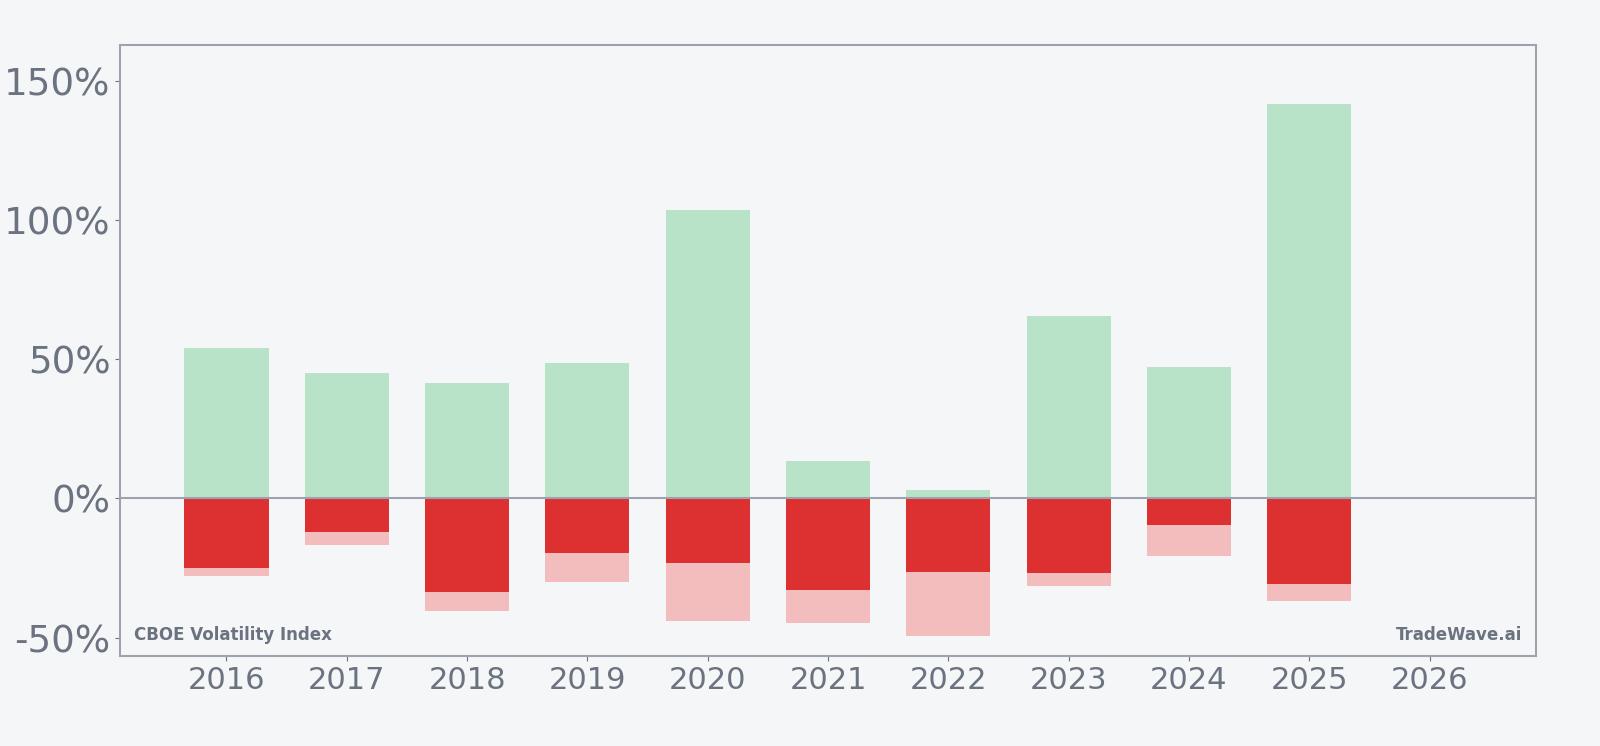
The combined net, maximum favorable excursion and maximum adverse excursion profile underlines that this has been a high-variance but ultimately downside-biased window for VIX. In 2020, for example, the best intraperiod move reached 103.79% while the worst drawdown from entry was 43.87%, and in 2025 the peak run-up hit 141.78% against a 36.87% adverse move, yet both years still closed the window with VIX lower by 23.25% and 30.84% respectively. That pattern of large spikes that eventually reverse into lower closes is typical across the sample and is reflected in the relatively high Sharpe ratio of 2.74 for the short side.
History does not guarantee future results; adverse excursions can be large even in winning windows, and volatility spikes within the period have at times been severe before fading.
Price and near-term drivers
CBOE Volatility Index closed at 17.93 on Feb 25, down 1.62 points or 8.3% on the day, leaving it in the upper half of the low-to-mid teens range that has characterized much of the past year. While that level is far from the crisis readings above 40 and 50 that have accompanied tariff shocks and trade-war scares in prior years, it is also not at the single-digit lows that have sometimes preceded abrupt volatility spikes.[4] The current backdrop comes as some derivatives strategists argue that markets look unusually calm relative to macro and political risks, and have been outlining ways for investors to hedge against a potential volatility rebound using options and related products.[12]
In Jan 2026, for example, options-focused commentators highlighted that implied volatility across major equity indices had compressed even as investors faced a busy election-year calendar, ongoing geopolitical tensions and uncertainty around the path of interest rates.[12] That tension between subdued volatility pricing and a still-complex macro environment is one reason why the upcoming seasonal window for VIX is drawing attention: if the historical pattern of lower end-of-window readings repeats, it would validate the idea that markets can stay calm for longer than many expect, whereas a decisive break from that pattern would signal that the current calm has given way to a more persistent risk-off phase.
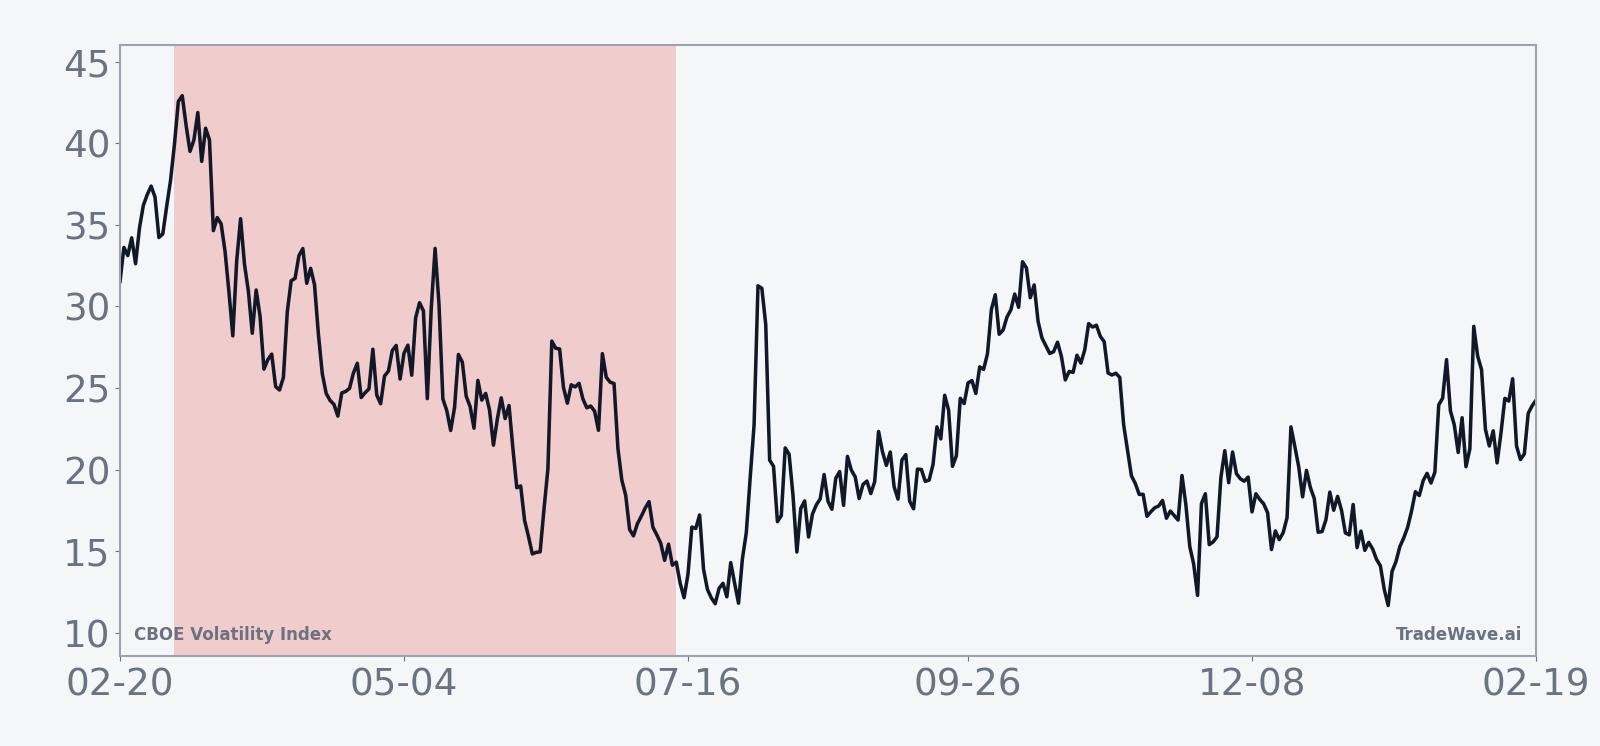
The chart below situates the latest move in its recent multi-month context.
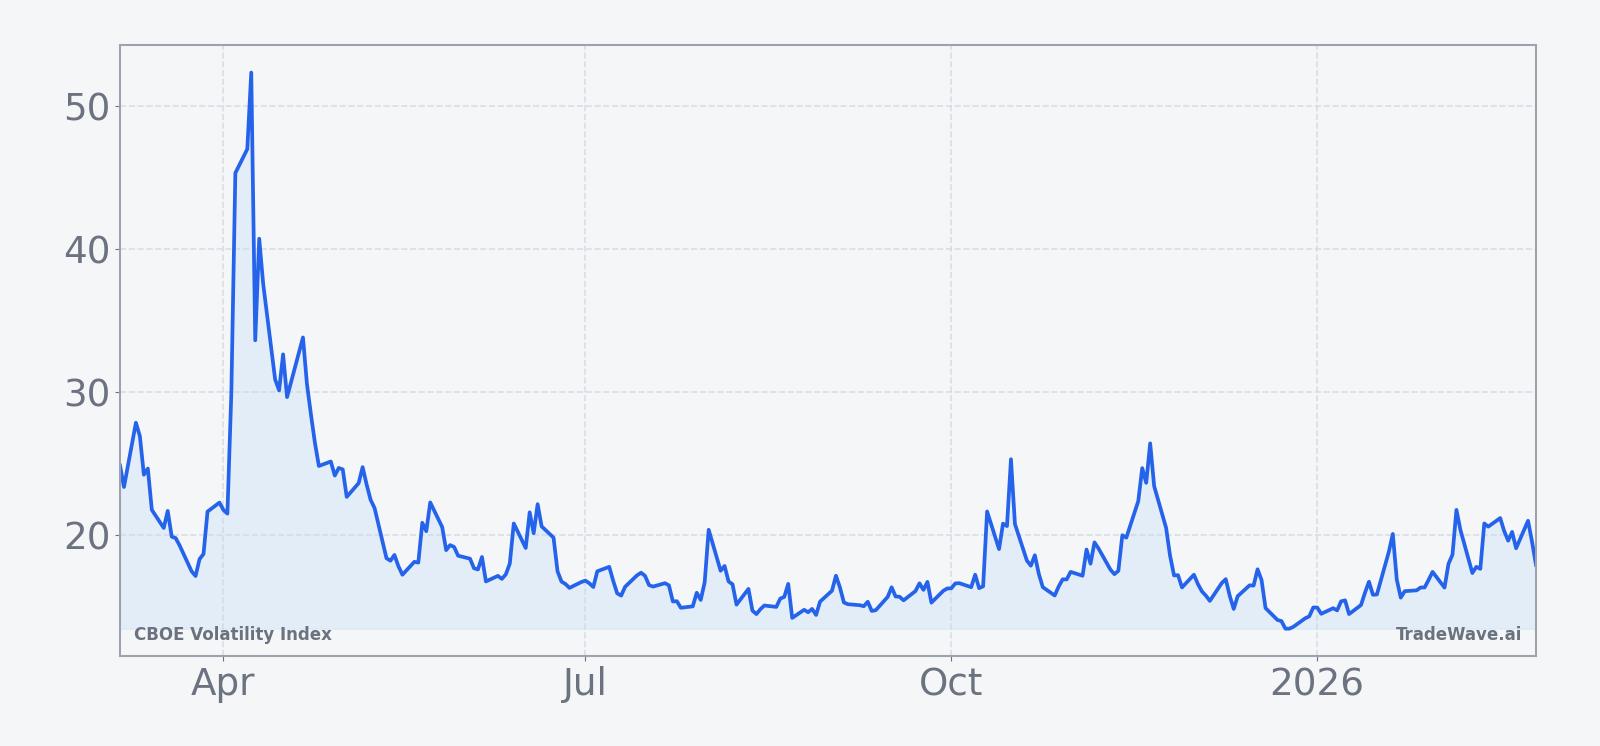
Past episodes illustrate how quickly the volatility landscape can change. In Apr 2025, steep tariff announcements pushed VIX above 50, a level associated with rare crisis conditions and intense investor fear.[4] Earlier that year, the VIX futures curve sent what some analysts described as a distress signal as equities slumped, with the index nearing 30 for the first time since a prior shock tied to tariff anxiety.[6][13] Those spikes ultimately faded, but they underscore that even in years when the seasonal window has ended with lower volatility, the path has often included sharp, if temporary, surges in implied risk.
Macro narratives have frequently been at the center of those swings. Escalating US-China trade tensions, including tariff threats and concerns over rare earth export controls, have repeatedly driven bursts of volatility that showed up as sudden jumps in VIX before conditions stabilized.[1][10] For investors looking ahead to this year’s March-to-midyear stretch, the key question is not whether volatility will spike at any point, but whether such spikes will prove fleeting, as they have in the past decade’s seasonal pattern, or whether they will mark the start of a more durable regime shift.
What to watch as the window opens
As the Mar 6 start date approaches, traders will be watching how VIX behaves around key macro and policy events that could challenge the historical pattern. A sustained move above the recent high-teens and low-20s band, particularly if it coincides with renewed trade tensions or growth concerns, would test the tendency for volatility to fade into this window rather than trend higher.[1][10] Conversely, if VIX spikes on a headline and then quickly retreats, that would be more in line with prior years where large intraperiod excursions ultimately gave way to lower closes.
Options markets will also be a focal point. The January commentary about markets being “too calm” relative to perceived risks highlighted that some investors are already thinking about hedging strategies and tail protection.[12] If demand for downside protection and volatility-linked products continues to build into the window without a corresponding, durable rise in VIX, it would reinforce the idea that the seasonal tendency toward lower end-of-window readings is still exerting influence. On the other hand, if hedging flows accelerate alongside a VIX that remains elevated or climbs further, that would signal a potential break from the decade-long pattern.
Finally, equity index behavior will provide important context. Historically, periods of compressing implied volatility have aligned with steadier or rising stock markets, while persistent VIX strength has accompanied broader risk-off phases. During this upcoming 130-day stretch, traders will be watching whether equity pullbacks are met with contained volatility that quickly subsides, consistent with the historical seasonal window, or whether volatility remains sticky after shocks, which would point to a different regime. Taken together, the seasonal statistics define the quantitative backdrop, but how VIX trades around macro headlines, options flows and equity moves will determine whether 2026 joins the list of winning years for this pattern or marks a notable exception.
Sources
- [1] Reuters, "Wall Street futures gain as corporate earnings momentum builds," Oct 20, 2025.
- [2] Reuters, "Wall St Week Ahead US stocks to be tested by Tesla, Netflix earnings and delayed CPI report," Oct 17, 2025.
- [3] Reuters, "Wall Street ends higher after brief slump on Powell firing confusion," Jul 16, 2025.
- [4] Seeking Alpha, "Wall Street's fear gauge jumps over 50 points amid tariff turmoil," Apr 7, 2025.
- [5] Seeking Alpha, "The Market Faces A Major Turning Point After Shocking Jobs Miss," Aug 3, 2025.
- [6] Bloomberg, "VIX Futures Curve Sends Distress Signal as Equities Slump," Mar 4, 2025.
- [7] Seeking Alpha, "Palantir: The Hype Has Reached Delusional Levels," Aug 18, 2025.
- [8] Business Insider, "Inside the volatility-trading strategy one investor is using to capitalize on Trump market madness," Apr 29, 2025.
- [9] MarketWatch, "Wall Street’s ‘fear gauge’ soars to a rare ‘crisis’ level. What that means for stocks.," Apr 7, 2025.
- [10] Reuters, "Wall Street's fear gauge climbs as US-China trade fears rise," Oct 14, 2025.
- [12] CNBC, "Some traders say the market is way too calm given the risks out there. How to hedge for a volatility spike," Jan 13, 2026.
- [13] Bloomberg, "VIX Nears 30 First Time Since August Shock on Tariff Anxiety," Mar 10, 2025.
- [14] Barchart.com, "Rosen Law Firm Encourages Soleno Therapeutics, Inc. Investors to Inquire About Securities Class Action Investigation - SLNO," Oct 5, 2025.